

Abstract
A ratio of the vancomycin area under the concentration-time curve to the MIC (AUC/MIC) of ≥400 has been associated with clinical success when treating Staphylococcus aureus pneumonia, and this target was recommended by recently published vancomycin therapeutic monitoring consensus guidelines for treating all serious S. aureus infections. Here, vancomycin serum trough levels and vancomycin AUC/MIC were evaluated in a “real-world” context by following a cohort of 182 patients with S. aureus bacteremia (SAB) and analyzing these parameters within the critical first 96 h of vancomycin therapy. The median vancomycin trough level at this time point was 19.5 mg/liter. There was a significant difference in vancomycin AUC/MIC when using broth microdilution (BMD) compared with Etest MIC (medians of 436.1 and 271.5, respectively; P < 0.001). Obtaining the recommended vancomycin target AUC/MIC of ≥400 using BMD was not associated with lower 30-day all-cause or attributable mortality from SAB (P = 0.132 and P = 0.273, respectively). However, an alternative vancomycin AUC/MIC of >373, derived using classification and regression tree analysis, was associated with reduced mortality (P = 0.043) and remained significant in a multivariable model. This study demonstrated that we obtained vancomycin trough levels in the target therapeutic range early during the course of therapy and that obtaining a higher vancomycin AUC/MIC (in this case, >373) within 96 h was associated with reduced mortality. The MIC test method has a significant impact on vancomycin AUC/MIC estimation. Clinicians should be aware that the current target AUC/MIC of ≥400 was derived using the reference BMD method, so adjustments to this target need to be made when calculating AUC/MIC ratio using other MIC testing methods.
INTRODUCTION
There are growing concerns about the ongoing utility of vancomycin in the treatment of serious Staphylococcus aureus infections due to increasing reports of suboptimal outcomes (1, 2). While fully vancomycin-resistant S. aureus (VRSA) remains rare (3), infections caused by vancomycin-intermediate S. aureus (VISA) and heterogeneous VISA (hVISA) may respond slowly or incompletely to vancomycin (4, 5). Recently, new concerns have been raised about suboptimal responses to vancomycin if the MIC of the infecting organism lies at the upper end of the susceptible range (6, 7), but this observation is not universal (8, 9).
The pharmacodynamic parameter that is thought to best predict vancomycin efficacy is the ratio of the 24-hour area under the concentration-time curve to MIC (here referred to as AUC/MIC) (10–13). Recently, consensus guidelines were published in the United States to assist clinicians and pharmacists regarding vancomycin dosing strategies (14). By attempting to bring consistency to therapeutic monitoring using the current state of knowledge about vancomycin pharmacodynamics and in view of potential problems of efficacy, relative resistance, and toxicity, these monitoring guidelines are intended to improve patient outcomes. These guidelines recommend a vancomycin target AUC/MIC of ≥400 (14) but also note that this target attainment is difficult for isolates with vancomycin MICs of >1 mg/liter, and they go on to suggest that alternate agents may be required for therapy for infections with high vancomycin MICs (14–20).
The serum AUC/MIC target value of ≥400 (using the 24-hour AUC) was originally derived by Moise et al. (21) in a retrospective study of methicillin-susceptible S. aureus (MSSA) and methicillin-resistant S. aureus (MRSA) hospital-acquired pneumonia using classification and regression tree (CART) analysis. The investigators showed that an AUC/MIC of >345 predicted clinical cure, while a value of >866 predicted bacterial eradication from the lower respiratory tract. This study used a formula to estimate AUC that they validated separately in adults (22). The published AUC formula, i.e., AUC = total vancomycin dose in mg over 24 h/{[(CLCR × 0.79) + 15.4] × 0.06} (22), used the total daily dose of vancomycin divided by the renal creatinine clearance (CLCR) calculated according to the Cockcroft-Gault equation (23). The MIC was measured using the Clinical and Laboratory Standards Institute (CLSI) reference broth microdilution (BMD) method, and the AUC/MIC was reported using the average AUC/MIC calculated daily.
The consensus guidelines do not state whether the method of CLCR estimation for AUC or MIC determination has any impact on the calculated AUC/MIC and whether an AUC/MIC of ≥400 is applicable to other S. aureus infection syndromes and outcome measures, especially in a “real-world” clinical setting. We have recently investigated outcomes in a multicenter cohort of S. aureus bacteremia (SAB) patients and also have demonstrated an association between increasing vancomycin MIC and increased mortality. However, surprisingly, we found an association between increased mortality and high vancomycin MIC whether or not vancomycin was used for treatment (9), which may mean that a high vancomycin MIC is a marker of some other patient or organism factor that is causally responsible for increased mortality. In this new study, we sought to evaluate the impact of different vancomycin MIC determination methods on AUC/MIC calculations and to determine if achieving a vancomycin AUC/MIC of ≥400 was associated with improved outcomes in patients from this cohort treated with vancomycin for SAB.
(This work was presented in part at the 51st Interscience Conference on Antimicrobial Agents and Chemotherapy, Chicago, IL, 2011, abstr. A-1681 [46].)
MATERIALS AND METHODS
Study population.
Patients for this observational study were vancomycin-treated patients from a previously described cohort (9). Patients younger than 12 years were excluded from this pharmacodynamic analysis because the formula we used to estimate vancomycin AUC has been validated only in adults. The primary outcome measure was 30-day all-cause mortality from the date of the first positive blood culture. Attributable 30-day mortality was also evaluated using previously published criteria (24). Other endpoints assessed included persistent bacteremia (positive blood cultures at ≥7 days after the initial isolate) and recurrence of bacteremia within 30 days of the index positive blood culture (with documented negative blood cultures after the index positive blood culture). Duration of bacteremia was measured as the number of days from the index positive blood culture to the last positive blood culture obtained.
Data collection.
Data for age, sex, onset of bacteremia, antibiotic treatment, and focus of S. aureus bacteremia infection were collected prospectively. However, additional clinical data required for this analysis were collected retrospectively using a detailed chart review. These included renal function, admission to an intensive care unit (ICU), Acute Physiology and Chronic Health Evaluation (APACHE) II score (25), Simplified Acute Physiology Score (SAPS) II (26), Charlson weighted index of comorbidity (CWI) (27), Pitt bacteremia score (28), vancomycin dosing regimens during the first 28 days of treatment, and serum vancomycin levels. Illness severity scores were calculated as the worst values within 48 h prior to the onset of SAB (measured as the time of collection of the index positive blood culture) (29). The following comorbidities were also collected: heart disease (ischemic heart disease, congestive cardiac failure, or cardiac arrhythmia requiring implantable electronic device), diabetes mellitus, dialysis (established peritoneal or hemodialysis), malignancy (solid organ or hematologic), transplant (solid organ or hematologic), immunosuppression (receipt of chemotherapy, monoclonal antibody, immunomodulation, or corticosteroids equivalent to prednisolone at 20 mg or more per day in the 30 days prior to SAB onset), liver disease (chronic liver disease or cirrhosis), dementia, and active injecting drug use (IDU). Contemporaneous local dosing guidelines recommended initial dosing of vancomycin at 25 mg/kg every 12 h in adult patients with normal renal function (30) with subsequent dose adjustment according to vancomycin serum trough levels, although individual regimens were ultimately decided by treating physicians. Compliance with these recommendations was not assessed. As this was an observational study, vancomycin levels were determined at the discretion of treating physicians. Trough levels (or spot levels for patients on hemodialysis) were generally obtained 24 to 96 h after commencement of vancomycin. Target trough levels according to local guidelines (30) were 10 to 20 mg/liter, although there was variability in recommended targets at different institutions; modifications of vancomycin doses were made by individual treating physicians. The number of vancomycin levels obtained for each patient during treatment varied according to the number of dose adjustments, fluctuating renal function, alteration in clinical status, or at the judgment of treating clinicians.
Microbiological data.
The first positive blood culture isolate from each patient was stored at −80°C until undergoing detailed microbiological testing. This included vancomycin MIC determination using BMD (31) and Etest (bioMérieux, Marcy l'Etoile, France). Screening for hVISA was performed using the Glycopeptide Resistance Detection (GRD) Etest (bioMérieux, Marcy l'Etoile, France).
Vancomycin pharmacodynamic data.
Renal function was estimated using two commonly used formulae: the “175” Modification of Diet in Renal Disease (MDRD) formula, which is an isotope dilution mass spectrometry (IDMS)-aligned equation that provides an estimated glomerular filtration rate (eGFR), i.e., MDRD CLCR = 175 × [(CR in μmol/liter × 0.0113)−1.154] × [(age in years)−0.203] × 0.742 if female (32), and the Cockcroft-Gault equation, which provides an estimated creatinine clearance (CLCR), i.e., Cockcroft-Gault CLCR = {[(140 − age in years) × weight in kg]/(CR in μmol/liter × 0.814)} × 0.85 if female, where weight was calculated using actual body weight (23). There is no correction for African-American race in the MDRD equation used in Australia and New Zealand, reflecting the low prevalence of this group in the Australasian population (33). The MDRD eGFR is automatically reported alongside serum creatinine results in most Australasian laboratories. The 24-hour vancomycin AUC was calculated using the formula AUC = total vancomycin dose in mg over 24 h/{[(CLCR × 0.79) + 15.4] × 0.06} and has been employed by other authors (34, 35). Timely achievement of therapeutic serum vancomycin levels is critical in the treatment of bacteremia, so we specifically evaluated the vancomycin AUC within the first 96 h of treatment. The total vancomycin daily dose over 24 h used in the formula corresponded to the vancomycin dose at the time of first available vancomycin trough level for each patient, taken within 96 h of vancomycin commencement. Actual body weight (where available) was used for the Cockcroft-Gault equation. The AUC/MIC was calculated using both MIC methods.
Statistical analysis.
The relationship between AUC/MIC and 30-day mortality was explored both as a categorical variable and as a continuous variable. For categorical analysis, both a two-group analysis and a three-group analysis were performed using classification and regression tree (CART) analysis to account for potential nonlinearity and nonmonotonicity, respectively. For continuous univariable analysis, the AUC/MIC was fitted by nonlinear regression to a standard exposure-response (Hill) curve. Multivariable logistic regression was performed to identify factors associated with 30-day mortality and to test the strength of the association between AUC/MIC and outcome. The recommended target AUC/MIC (≥400) and the CART-derived two-group AUC/MIC cutoff (Academic CART Pro v6.6; Salford Systems, San Diego, CA) were both used to create a dichotomous AUC/MIC variable for multivariable regression. Similarly for multivariable analysis, continuous data such as age and disease or illness severity markers were converted into dichotomous variables for logistic regression using cutoffs associated with poor clinical outcomes from previously published studies. The χ2 test or Fisher exact test was used to compare categorical variables, and the Mann-Whitney test was used for continuous nonparametric variables. Kaplan-Meier survival curves were constructed, and the log rank test was used to compare the curves. Multivariable logistic regression was performed to identify factors associated with 30-day mortality, with goodness of fit of the final model evaluated with the Hosmer-Lemeshow statistic. Analyses were performed using GraphPad Prism v5.0 (GraphPad Software, San Diego, CA), Stata v11.1 (StataCorp, College Station, TX), and R v2.15.2 (http://www.r-project.org/).
Ethics.
Human ethics committee approval was obtained at each of the participating sites.
RESULTS
Demographics.
Clinical and drug dosing data were available for 186 vancomycin-treated patients from our original cohort. Four of these patients were excluded (1 patient, 30-day outcome not recorded; 3 patients, <12 years), leaving 182 patients for final analysis. Table 1 shows patient demographics according to 30-day mortality and vancomycin AUC/MIC target attainment. The 30-day all-cause mortality was 20.9% (38/182). Attributable mortality was 12.6% (23/182), indicating that more than one-third of all deaths at 30 days (15/38, 39.5%) may have been due to causes other than SAB. Nonsurvivors were more likely to be older, to have a sepsis syndrome associated with SAB, to have a high vancomycin MIC (defined as an Etest value of >1.5 mg/liter) as previously described (9), and to have longer duration of bacteremia. Patients achieving a vancomycin AUC/MIC of ≥400 were more likely to be older and have diabetes or a requirement for permanent dialysis. The median duration of bacteremia was 1 day (range, 1 to 18 days), and rates of persistent or recurrent bacteremia in survivors and in nonsurvivors were similar. Documentation of patient weight was obtained for only 99 patients; in this subset, the median weight was 71 kg (interquartile range [IQR], 61 to 90 kg), and there was no statistical difference between survivors and nonsurvivors (P = 0.673). Acute renal failure was present in almost one-quarter of patients at onset of SAB.
Table 1.
Patient demographics according to 30-day outcome and vancomycin AUC/MIC (n = 182)a
| Characteristic | Value for groupb |
|||||
|---|---|---|---|---|---|---|
| 30-day outcome |
Vancomycin AUC/MIC |
|||||
| Survivors (n = 144) | Nonsurvivors (n = 38) | P value | <400 (n = 83) | ≥400 (n = 99) | P value | |
| Age ≥ 70 yr | 48 (33.3) | 22 (57.9) | 0.008 | 25 (30.1) | 45 (45.5) | 0.046 |
| Male sex | 105 (72.9) | 23 (60.5) | 0.163 | 62 (74.7) | 66 (66.7) | 0.258 |
| White ethnicity | 123 (85.4) | 30 (79.0) | 0.328 | 68 (81.9) | 85 (85.9) | 0.544 |
| Hospital onset | 71 (49.3) | 21 (55.3) | 0.586 | 46 (55.4) | 46 (46.5) | 0.238 |
| MRSA | 109 (75.7) | 32 (84.2) | 0.382 | 64 (77.1) | 77 (77.8) | 1.000 |
| Device associatedc | 72/135 (53.3) | 17/36 (47.2) | 0.575 | 42/76 (55.3) | 47/95 (49.5) | 0.538 |
| Line associatedd | 43/134 (32.1) | 14/36 (38.9) | 0.435 | 29/75 (38.7) | 28/95 (29.5) | 0.253 |
| Infection syndrome | ||||||
| Skin and soft tissue | 18 (12.5) | 2 (5.3) | 0.256 | 8 (9.6) | 12 (12.1) | 0.641 |
| Infective endocarditis | 7 (4.7) | 1 (2.6) | 1.000 | 3 (3.6) | 5 (5.1) | 0.729 |
| Pneumonia | 9 (6.3) | 5 (13.2) | 0.174 | 6 (7.2) | 8 (8.1) | 1.000 |
| Osteoarticular | 11 (7.6) | 3 (7.9) | 1.000 | 9 (10.8) | 5 (5.1) | 0.170 |
| Sepsis syndrome | 14 (9.7) | 9 (23.7) | 0.029 | 12 (14.5) | 11 (11.1) | 0.511 |
| Comorbidities | ||||||
| Heart disease | 54 (37.5) | 18 (47.4) | 0.271 | 29 (34.9) | 43 (43.4) | 0.287 |
| Diabetes | 45 (31.3) | 13 (34.2) | 0.845 | 19 (22.9) | 39 (39.4) | 0.025 |
| Dialysis | 27 (18.8) | 6 (15.8) | 0.815 | 8 (9.6) | 25 (25.3) | 0.007 |
| Malignancy | 28 (19.4) | 15 (39.5) | 0.017 | 24 (28.9) | 19 (19.2) | 0.161 |
| Transplant | 11 (7.6) | 0 (0.0) | 0.124 | 5 (6.0) | 6 (6.1) | 1.000 |
| Immunosuppression | 25 (17.4) | 1 (2.6) | 0.019 | 11 (13.3) | 15 (15.2) | 0.832 |
| Liver disease | 17 (11.8) | 5 (13.2) | 0.784 | 11 (13.3) | 11 (11.1) | 0.820 |
| Dementia | 8 (5.6) | 2 (5.3) | 1.000 | 3 (3.6) | 7 (7.1) | 0.350 |
| Active IDU | 8 (5.6) | 0 (0.0) | 0.208 | 6 (7.2) | 2 (2.0) | 0.144 |
| Severity-of-illness markers | ||||||
| APACHE II score ≥ 18 | 46 (31.9) | 20 (52.6) | 0.023 | 26 (31.3) | 40 (40.4) | 0.219 |
| SAPS II > 45 | 5 (3.5) | 5 (13.2) | 0.035 | 4 (4.8) | 6 (6.1) | 0.757 |
| CWI ≥ 3 | 40 (27.8) | 15 (39.5) | 0.170 | 20 (24.1) | 35 (35.4) | 0.108 |
| Pitt bacteremia score ≥ 4 | 24 (16.7) | 17 (44.7) | 0.001 | 22 (26.5) | 29 (19.2) | 0.286 |
| ICU admissionc | 37/141 (26.2) | 14/38 (36.8) | 0.226 | 26/82 (31.7) | 25/97 (25.8) | 0.409 |
| Acute renal failuree | 33/143 (23.1) | 11 (29.0) | 0.524 | 18/83 (21.7) | 26/98 (26.5) | 0.490 |
| Elevated vancomycin MICf | 54 (37.5) | 21 (55.3) | 0.063 | 37 (44.6) | 38 (38.4) | 0.451 |
| Vancomycin AUC/MIC ≥ 400 | 82 (56.9) | 17 (44.7) | 0.203 | |||
| DNR order | 19/121 (15.7) | 28 (73.7) | <0.001 | 20/74 (27.0) | 27/85 (31.8) | 0.602 |
| 30-day mortality | 21 (25.3) | 17 (17.2) | 0.203 | |||
| Persistent SABc | 15/117 (12.8) | 7/29 (24.1) | 0.149 | 11/66 (16.7) | 11/80 (13.8) | 0.649 |
| Recurrence of SABc | 19/142 (13.4) | 3/36 (8.3) | 0.574 | 9/82 (11.0) | 13/96 (13.5) | 0.654 |
| Duration of SAB, median days (IQR) | 1 (1–2) | 1.5 (1–5) | 0.039 | 1 (1–2) | 1 (1–2) | 0.857 |
Data exclude 1 patient for whom the 30-day outcome was unable to be confirmed and 3 pediatric patients of <12 years. Abbreviations: AUC, area under the concentration-time curve; MRSA, methicillin-resistant Staphylococcus aureus; IDR, injecting drug use; APACHE, Acute Physiology and Chronic Health Evaluation; SAPS, Simplified Acute Physiology Score; CWI, Charlson weighted index of comorbidity; DNR, do not resuscitate; ICU, intensive care unit; IQR, interquartile range.
Data are expressed as n (%) except as otherwise indicated.
Information not available for all patients.
Device-associated infection involving peripheral or central intravenous catheters only.
Defined using assigned category for APACHE II calculation (25).
Elevated vancomycin MIC defined as an Etest value of >1.5 mg/liter.
Vancomycin trough levels.
One or more vancomycin trough levels were obtained for 165 patients (90.7%) within 96 h of commencing treatment. The number of vancomycin levels per patient obtained within this time period varied, mainly due to differences in vancomycin dosing frequency. To account for these differences, we evaluated those patients with vancomycin trough levels obtained at 96 h after commencement (n = 102), which approximates the earliest time of near steady state in a patient with normal renal function receiving daily vancomycin dosing (before the fourth dose). The median vancomycin trough at this time was 19.5 mg/liter (interquartile range, 15.0 to 24.0 mg/liter). Table 2 shows measured vancomycin trough levels at 96 h according to methicillin susceptibility, vancomycin MIC, and 30-day outcome.
Table 2.
Vancomycin trough levels measured at 96 h after commencing treatment (n = 102)a
| Characteristic (n) | Median vancomycin trough level, mg/liter (IQR) | P value |
|---|---|---|
| Susceptibility | 0.784 | |
| MSSA (15) | 17 (15–23) | |
| MRSA (87) | 20 (15–24) | |
| Vancomycin MIC | 0.323 | |
| Low (59) | 19 (15–23) | |
| Elevatedb (43) | 21 (15–27) | |
| 30-day mortality | 0.729 | |
| Survivors (85) | 19 (15–23) | |
| Nonsurvivors (17) | 21 (16–26) |
Excludes 80 patients for whom the vancomycin trough level was drawn at other time periods or not drawn at all. Abbreviations: IQR, interquartile range; MSSA, methicillin-susceptible Staphylococcus aureus; MRSA, methicillin-resistant Staphylococcus aureus.
Elevated vancomycin MIC defined as an Etest value of >1.5 mg/liter.
Vancomycin susceptibility.
The distribution of vancomycin MICs of the isolates determined by both Etest and BMD is shown in Table 3 and demonstrates important differences in MIC between the two methods. The modal MIC was 1 mg/liter by BMD (78.6%) and 1.5 mg/liter by Etest (41.2%). Others have also noted higher MIC values with Etest than with BMD (36–39). All isolates were considered susceptible according to the CLSI reference BMD method (31), but one isolate (0.6%) demonstrated vancomycin heteroresistance using the Etest GRD.
Table 3.
Comparative vancomycin MIC distribution according to Etest and BMD (n = 182)a
| Etest MIC (mg/liter) | No. of isolates with BMD MIC (mg/liter) of: |
Total no. of isolates | |||
|---|---|---|---|---|---|
| 0.25 | 0.5 | 1 | 2 | ||
| 0.38 | 1 | 1 | |||
| 0.5 | 1 | 1 | |||
| 0.75 | 5 | 2 | 7 | ||
| 1 | 9 | 14 | 23 | ||
| 1.5 | 9 | 64 | 2 | 75 | |
| 2 | 1 | 52 | 5 | 58 | |
| 3 | 11 | 6 | 17 | ||
| Total no. of isolates | 1 | 25 | 143 | 13 | 182 |
BMD, broth microdilution.
Effect of CLCR calculation on vancomycin AUC.
The eGFR obtained using the MDRD formula was reported for all 182 patients; however, the estimated CLCR obtained using the Cockcroft-Gault equation was calculated for only the 99 patients for whom weight was documented. The MDRD formula tended to yield higher values of CLCR (median, 50.6; IQR, 23.7 to 81.3) than the Cockcroft-Gault equation (median 34.3, IQR 18.2 to 92.2); however, the difference in medians was not statistically significant (P = 0.468). The calculated vancomycin AUCs using both these CLCR estimates were similar (MDRD median, 416.2; Cockcroft-Gault median, 428.0; P = 0.850).
Effect of MIC test method on vancomycin AUC/MIC.
The vancomycin AUC/MIC was calculated using the MDRD and Cockcroft-Gault formulae for CLCR and BMD and Etest for MIC (see Table S1 in the supplemental material). As there was no significant difference in AUC calculation using either the MDRD formula or the Cockcroft-Gault equation, we chose to use the MDRD formula for CLCR as more data points were available for further analysis. The median vancomycin AUC/MIC was different using BMD and Etest (BMD median, 436.1 [IQR, 308.7 to 650.2]; Etest median, 271.5 [IQR, 189.1 to 376.6] [see Table S1 in the supplemental material]). The very high AUC/MIC was calculated in one patient with chronic kidney disease (serum creatinine, 447 μmol/liter) whose blood culture isolate had a very low vancomycin MIC (0.25 mg/liter). The calculated vancomycin AUC/MIC was significantly higher when using the BMD MIC than with the Etest MIC (P < 0.001).
Figure 1 shows a scattergram of log-transformed vancomycin AUC/MIC using BMD versus Etest. This demonstrates that there is a clear difference in AUC/MIC values according to MIC method and that the target AUC/MIC of ≥400 is MIC method dependent. Using a line of best fit derived by linear regression, the equivalent AUC/MIC using the MIC observed by BMD of 400 is 226 using the MIC observed by Etest in our cohort.
Fig 1.
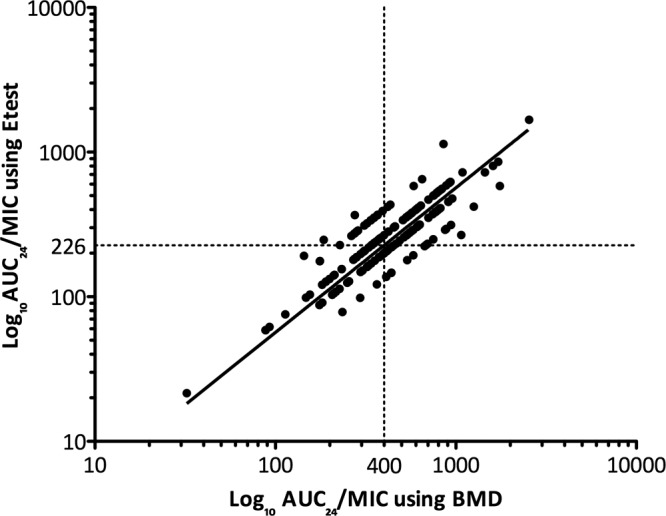
Scattergram of vancomycin AUC/MIC using BMD versus Etest. The vertical dotted line represents an AUC/MIC of 400 using BMD. The horizontal dotted line represents an AUC/MIC of 226 using Etest. The line of best fit was obtained using linear regression. BMD, broth microdilution; AUC/MIC, ratio of area under the concentration-time curve (24 h) to vancomycin MIC.
Effect of target AUC/MIC attainment on mortality in patients with SAB.
Figure 2 displays the frequency distribution of vancomycin AUC/MIC within 96 h according to the proportion of survivors. Using linear regression to create a line of best fit, there was a positive but small correlation between vancomycin AUC/MIC and mortality. Apart from the low proportion of survivors with a vancomycin AUC/MIC of <100, there was no clear demarcation of a specific vancomycin AUC/MIC associated with significant improvement of survival (r2 = 0.216, P = 0.175). Figure 3A shows the vancomycin AUC/MIC from each patient according to survivors versus nonsurvivors. The distributions of values around the target vancomycin AUC/MIC of 400 using BMD are similar in survivors and nonsurvivors (P = 0.296), with a significant number of survivors (62/144, 43.1%) failing to achieve this target. The proportion of survivors with a vancomycin AUC/MIC of <400 using BMD did not change if patients with peripheral or central intravenous catheter-associated infection were excluded (37/91, 40.7%), and there was a similar proportion of survivors failing to achieve a vancomycin AUC/MIC ratio of 226 using Etest (47/144, 32.60%).
Fig 2.
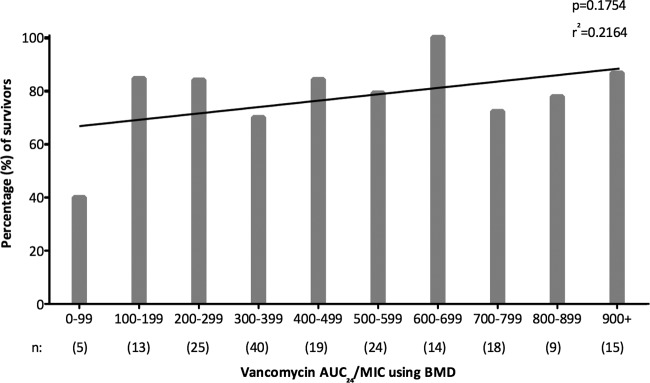
Frequency distribution of vancomycin AUC/MIC according to the proportion of survivors, including line of best fit using linear regression. AUC/MIC, ratio of area under the concentration-time curve (24 hour) to vancomycin MIC; BMD, broth microdilution.
Fig 3.

Thirty-day mortality in patients with SAB according to vancomycin AUC/MIC. (A) Vancomycin AUC/MIC according to survivors versus nonsurvivors for all-cause mortality. (B) Proportion of survivors according to target attainment using a vancomycin AUC/MIC of ≥400. (C) Kaplan-Meier curve for all-cause mortality according to target attainment using a vancomycin AUC/MIC of ≥400 (note that the P value derived using the log-rank test was slightly different to Fisher's exact test for the dichotomous variable). (D) Proportion of survivors according to target attainment using a vancomycin AUC/MIC of ≥373. (E) Kaplan-Meier curve for all-cause mortality according to target attainment using a vancomycin AUC/MIC of ≥373. The horizontal dotted line represents an AUC/MIC of 400 using BMD. Heavy black bars represent median and interquartile range. BMD, broth microdilution; AUC/MIC, ratio of area under the concentration-time curve (24 hour) to vancomycin MIC.
Patients were then divided into two groups according to whether they achieved the published target vancomycin AUC/MIC of ≥400 using BMD MIC values (14, 22). Figure 3B shows the proportion of survivors according to attainment or failure to achieve the target vancomycin AUC/MIC of ≥400, and there was no significant difference between the two groups (P = 0.203). The Kaplan-Meier survival curve for 30-day all-cause mortality (Fig. 3C) shows an early small divergence in the curves; however, there was no statistical difference in survival (log rank test, P = 0.132) in patients who did not achieve the pharmacodynamic target vancomycin AUC/MIC of ≥400 using BMD MIC compared with those who did. In addition, there was no difference in survival when analyzing according to 30-day attributable mortality (P = 0.273) or adjusting for methicillin susceptibility (see Table S2 in the supplemental material).
Using CART, a breakpoint for 30-day all-cause mortality using BMD was identified for the vancomycin AUC/MIC at 373. The probability of survival was 71.6% for those with a vancomycin AUC/MIC of ≤373, compared with 84.3% for those patients with a vancomycin AUC/MIC of >373. There was a statistically significant difference in all-cause mortality using this CART-derived vancomycin AUC/MIC (P = 0.043). Using the mortality difference between these two groups as a point estimate for absolute risk reduction (12.7%), the number needed to treat was 8 (compared with 14 for the predefined vancomycin AUC/MIC cutoff of 400). There were no major differences in baseline patient demographics according to the CART-derived vancomycin AUC/MIC target of 373 compared with those reported in Table 1 for the target of 400 (see Table S3 in the supplemental material). Figure 3D demonstrates the proportion of survivors according to attainment of the CART-derived vancomycin AUC/MIC of >373 (P = 0.043), and Fig. 3E shows the Kaplan-Meier survival curve using the CART-derived target (log rank test, P = 0.043). Among survivors, there was still a significant proportion (53/144, 36.8%) who failed to achieve a vancomycin AUC/MIC of >373. There was no difference in mortality when adjusted for methicillin susceptibility (see Table S4 in the supplemental material). The CART-derived cutoff for Etest was 130 (P = 0.005 for 30-day all-cause mortality).
We also analyzed the vancomycin AUC/MIC using BMD according to vancomycin MIC group, given our previously demonstrated association between elevated vancomycin MIC and 30-day mortality. Figure 4 shows a dot plot of vancomycin AUC/MIC according to low versus elevated vancomycin MIC (Etest, >1.5 mg/liter). As expected, the AUC/MIC was lower in the group with elevated vancomycin MIC. However, when analyzed according to target attainment of an AUC/MIC of ≥400 using BMD MIC, there was no statistical difference between the groups with low and elevated vancomycin MIC (61/107 [57.0%] versus 38/75 [50.7%], respectively; P = 0.451) or between MSSA and MRSA (22/41 [53.7%] versus 77/141 [54.6%], respectively; P = 1.000). When using the CART-derived AUC/MIC target of >373, there were also no statistical differences between these two groups (low versus elevated vancomycin MIC, P = 0.880; MSSA versus MRSA, P = 1.000).
Fig 4.
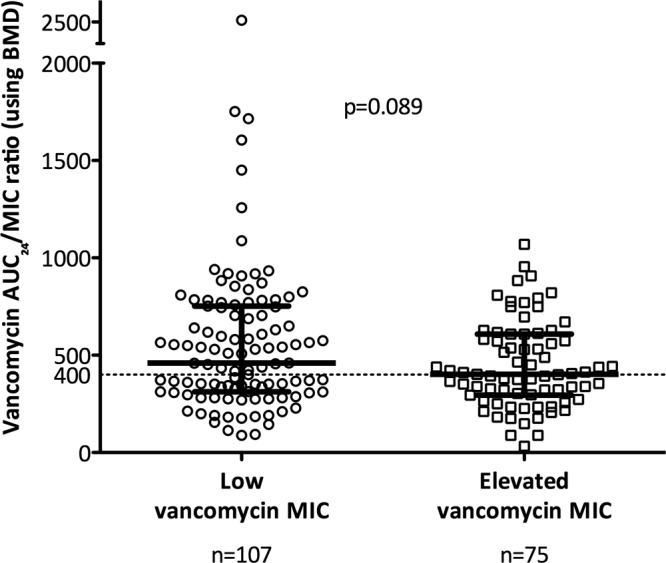
Vancomycin AUC/MIC according to groups with low versus elevated (defined as an Etest value of >1.5 mg/liter) vancomycin MIC. The horizontal dotted line represents an AUC/MIC of 400 using BMD. Heavy black bars represent median and interquartile range. BMD, broth microdilution; AUC/MIC, ratio of area under the concentration-time curve (24 hour) to vancomycin MIC.
We found no association between achieving a vancomycin AUC/MIC of ≥400 (published target) or >373 (our CART-derived target) and reduction in other secondary outcome measures such as attributable mortality (≥400, P = 0.273; >373, P = 0.115), persistent bacteremia (≥400, P = 0.649; >373, P = 1.000), or recurrent bacteremia (≥400, P = 0.654; >373, P = 0.817). Among nonsurvivors, the proportions of patients achieving a vancomycin AUC/MIC of ≥400 in attributable versus nonattributable deaths were similar (10/23 versus 7/15, respectively; P = 1.000). We also analyzed different target AUC/MIC cutoffs reported in various studies (AUC/MICBMD of >345 [21], AUC/MICBMD of >866 for bacterial eradication [21], AUC/MICEtest of >211 [40], and AUC/MICBMD of >421 [41]) and found no statistical difference in 30-day outcome according to achievement of these targets.
Relationship between vancomycin trough level and vancomycin AUC.
As the formula used to calculate vancomycin AUC, i.e., AUC = total vancomycin dose in mg over 24h/{[(CLCR × 0.79) + 15.4] × 0.06}, did not include measured vancomycin trough levels from patients, we also assessed the relationship between vancomycin trough levels measured within 96 h of treatment commencement and vancomycin AUC. There was only a moderate correlation between measured vancomycin trough levels and calculated vancomycin AUC (r = 0.246, P = 0.002).
Multivariable analysis.
Variables identified as potentially significant on univariable analysis (P < 0.2) were considered for inclusion into a multivariable model to establish risk factors for 30-day mortality. For correlated variables (for example, age and APACHE II score), only one was included in multivariable analysis. Do-not-resuscitate (DNR) orders were specifically excluded from this model as these lead to modifications or withdrawal of treatment that have a direct impact on clinical outcome. Using multivariable logistic regression, variables that were independently associated with increased 30-day mortality in SAB were age of ≥70 years, sepsis syndrome, and a Pitt bacteremia score of ≥4, whereas a vancomycin AUC/MIC of >373 was protective (Table 4) (Hosmer-Lemeshow statistic for final model, P = 0.089).
Table 4.
Final multivariable logistic regression model of factors associated with 30-day mortality in SAB (n = 182)a
| Variableb | Univariable analysis P value | Multivariable analysis |
||
|---|---|---|---|---|
| OR | 95% CI | P value | ||
| Age ≥ 70 years | 0.008 | 3.61 | 1.59–8.17 | 0.002 |
| Male sex | 0.163 | |||
| Pneumonia | 0.174 | |||
| Sepsis syndrome | 0.029 | 3.24 | 1.16–9.08 | 0.025 |
| Vancomycin AUC/MIC > 373 | 0.043 | 0.44 | 0.20–0.99 | 0.049 |
| Elevated vancomycin MICc | 0.063 | |||
| CWI ≥ 3 | 0.170 | |||
| Pitt bacteremia score ≥ 4 | 0.001 | 3.74 | 1.64–8.56 | 0.002 |
| Immunosuppression | 0.019 | |||
Abbreviations: OR, odds ratio; CI, confidence interval; AUC, area under the concentration-time curve; DNR, do not resuscitate; APACHE, Acute Physiology and Chronic Health Evaluation; SAPS, Simplified Acute Physiology Score; CWI, Charlson weighted index of comorbidity.
Variables that were significant on univariable analysis that were not considered for multivariable analysis were presence of DNR order (direct effect on outcome), an APACHE II score of ≥18, a SAPS II of >45, and heart disease and malignancy (collinearity).
Elevated vancomycin MIC defined as an Etest value of >1.5 mg/liter.
DISCUSSION
There is an accepted association between poorer outcomes in S. aureus infections and an elevated vancomycin MIC within the susceptible range (6), leading some to question the ongoing value of vancomycin in the treatment of serious S. aureus infections (1). Higher vancomycin doses have been recommended to optimize outcomes but at the price of increased nephrotoxicity (42). The most precise pharmacodynamic predictor of outcome is thought to be the vancomycin AUC/MIC, and it is considered to be more accurate than related measures such as time above MIC and the peak/MIC ratio in in vitro, animal, and small human studies (10–13, 22). Acknowledging that comprehensive clinical data are lacking, consensus guidelines (14) for vancomycin dosing and monitoring recommend a number of strategies intended to optimize outcomes, minimize toxicity, and prevent the development of resistance. Key recommendations are to achieve vancomycin serum trough levels of 15 to 20 mg/liter and an AUC/MIC of ≥400. This ratio was originally derived from patients with staphylococcal pneumonia, using the BMD method for MIC determination and a formula based on vancomycin dosing and CLCR for AUC (21, 22) and evaluating clinical success. In this study, we evaluated the usefulness of the AUC/MIC of ≥400 in patients with staphylococcal bacteremia. We also assessed the impact of two different methods of MIC determination on AUC/MIC calculations and then sought to determine if achieving a vancomycin AUC/MIC of ≥400 with the BMD method within the first critical 96 h of therapy resulted in reduced mortality in our cohort of patients with S. aureus bacteremia.
Not surprisingly we found that calculation of the vancomycin AUC/MIC is MIC method dependent, so clinicians need to be aware of this and specify the methods used to obtain MIC values when aiming for particular AUC/MIC targets. An Etest MIC is often higher than that with the BMD methodology (9, 36–38, 43). We suspect that this is the result of an inoculum effect (the inoculum is higher with Etest), which has been observed in vivo (44). As a result, the vancomycin AUC/MIC is significantly lower when using Etest MIC than when using the BMD MIC. If the Etest is used to measure MIC, then we have calculated that the equivalent AUC/MIC target should be 226 rather than 400 using our linear regression model. Vancomycin AUC measurement may also vary according to the method used for its estimation. Although the MDRD formula was developed as a tool for evaluation of chronic kidney disease and may underestimate renal clearance in healthy individuals (45), we showed that differences in CLCR calculation using the MDRD and Cockcroft-Gault formulae have little influence on vancomycin AUC estimates using the formula published by Moise-Broder et al. (22).
With these caveats in mind, we then investigated the prognostic value of the recommended vancomycin AUC/MIC of ≥400 as determined by BMD in our cohort of patients with S. aureus bacteremia in a “real-world” setting. Target vancomycin trough levels were achieved early in the vancomycin treatment course (within 96 h), potentially maximizing vancomycin efficacy. While there was a gradual rise in the proportion of survivors as the vancomycin AUC/MIC increased, there was no clear cutoff associated with improved survival (Fig. 2 and Fig. 3A). The a priori defined vancomycin AUC/MIC of ≥400 obtained within 96 h of therapy was associated with a calculated 8% reduction in mortality, but this was not a statistically useful predictor of outcome. However, when we moved away from an a priori definition and used CART analysis to establish a new AUC/MIC cutoff, we did find a statistically significant association between achieving a vancomycin AUC/MIC of >373 within the first 96 h of vancomycin therapy and reduced 30-day mortality. Patients who achieved an AUC/MIC of >373 had a 12% lower mortality than those who did not (P = 0.04). The CART-derived value is in fact closer to the original vancomycin AUC/MIC of 345 reported by Moise et al. (21), upon which the target of 400 was established. While it makes biological and clinical sense that higher vancomycin AUC/MIC ratios directly improve patient outcomes, we caution that the relationship may be more complex than this, particularly as our previous study (9) demonstrated that a high vancomycin MIC was associated with increased mortality even in patients who were not treated with vancomycin. We believe that multiple factors apart from the vancomycin AUC/MIC influence outcome, including strain-specific genotypic and virulence differences and the host-organism interaction. Even using the new cutoff of 373 that we obtained with CART, almost 90% of the survival difference between patients is likely to be explained by factors other than the AUC/MIC itself.
Other studies have examined vancomycin AUC or AUC/MIC but they describe a variety of different infection syndromes and outcome measures. In their original paper describing the vancomycin AUC/MIC, Moise et al. (21) evaluated 70 patients with hospital-acquired pneumonia (principally ventilator associated) due to MSSA and MRSA. The Cockcroft-Gault CLCR and the reference MIC BMD method were used to calculate their AUC/MIC. Other studies, including this one, have evaluated patients with staphylococcal bacteremia. Neuner et al. (35) investigated vancomycin the AUC/MIC as a predictor of persistent MRSA bacteremia in 222 patients. The median AUC/MIC using Etest was similar in the persistent versus nonpersistent bacteremia groups (325 and 283, respectively; P = 0.936), although there were only 19 patients with persistent bacteremia. Brown et al. (40) assessed 50 patients with complicated bacteremia or infective endocarditis. A vancomycin AUC/MIC of <211 using Etest was associated with attributable mortality; however, only 8 patients (16%) had mortality attributable to SAB. Interestingly our CART-derived cutoff for 30-day mortality and a vancomycin AUC/MIC obtained using Etest instead of BMD was much lower (130). More recently Kullar et al. (41) studied 320 patients with MRSA bacteremia using a composite endpoint of treatment failure (30-day mortality, persistent symptoms and signs of infection, and persistent bacteremia for ≥7 days). Both BMD and Etest MIC determinations were performed. Using CART analysis, an AUC/MIC of <421 (presumably using BMD) was associated with treatment failure. Interestingly, high rates of persistent bacteremia (127/168) were noted, and the median AUC/MIC values with treatment success versus failure were similar (587 and 537, respectively).
There are several limitations to our study. Information about surgical debridement or removal of devices was not obtained, and we were unable to ascertain compliance with local vancomycin dosing guidelines or to assess rates of nephrotoxicity. Due to widely varying dosage schedules, we did not account for expected differences in trough levels depending on dosing frequency. The vancomycin AUC was calculated with a simple formula based on daily vancomycin dose and renal function; however, this does not take into consideration the measured serum vancomycin levels obtained from patients. This is an accepted method for AUC/MIC estimation; however, more sophisticated computer-based programs may be able to improve AUC estimation. Our study also included patients with a wide variety of infective processes associated with bacteremia, including a proportion that were likely to have good outcomes, such as those with skin and skin structure infection or line sepsis who had the device removed early. Nevertheless, our study suggests that refinements need to be made to recommendations for AUC/MIC target attainment in treatment of S. aureus bacteremia. The heterogeneous nature of our results and those from other studies raises the suspicion that the relationship between vancomycin AUC and MIC may be different according to infection type or site and outcome measure. In particular infections associated with high bacterial loads may be a particular problem, as a true inoculum effect with vancomycin has been demonstrated (44). Previous studies have evaluated the average daily vancomycin AUC/MIC at steady state during a course of vancomycin treatment (22, 40), whereas we have focused on assessing the vancomycin AUC/MIC achieved within the first 96 h of vancomycin therapy. We believe that this is a clinically relevant endpoint and may provide clinicians with an alternative measure of efficacy in addition to monitoring vancomycin trough levels during the early stages of treatment for SAB.
The optimum vancomycin AUC/MIC using non-BMD MIC methods has not been established. Therefore, clinicians using pharmacodynamic targets to guide vancomycin therapy for serious S. aureus infections need to be alert to the method of MIC determination in their own laboratories when calculating the vancomycin AUC/MIC, as this will influence the numerical target. Improved algorithms for AUC calculation that include actual measured serum vancomycin levels may be beneficial. Further research into the generalizability of AUC/MIC targets in different S. aureus infection syndromes and outcome measures is required. Appropriate vancomycin dosing to achieve serum trough levels within the target therapeutic range early in the treatment course is also important, and management should also take the clinical status of the patient into consideration. Achieving a vancomycin AUC/MIC that approximates the target of ≥400 rapidly during the early treatment of SAB is associated with improved survival; however, this effect is small, and survival is likely to be heavily dependent on other, as-yet-unknown host and organism characteristics.
ACKNOWLEDGMENTS
We acknowledge Shi Yi Goo (a medical student at Princess Alexandra Hospital, Woolloongabba) for assistance in reviewing patient charts at this location and Sujata Bhavnani and Jeffrey Hammel (Institute for Clinical Pharmacodynamics, Latham, NY) for assistance and expertise with CART analyses.
This work was supported by the Australian Society for Antimicrobials for microbiological testing of the isolates. N.E.H. is supported by a National Health and Medical Research Council postgraduate scholarship. B.P.H is supported by a National Health and Medical Research Council Career Development Fellowship.
J.D.T. has received financial support from Pfizer Australia, Astra Zeneca Australia, and Novartis Australia. W.J.M. has received financial support to attend the “Susceptibility and resistance: selecting appropriate therapy for serious Gram-positive infections” educational seminar sponsored by Novartis Australia. J.O.R. has received financial support from Merck Sharp and Dohme to attend the 21st European Congress on Clinical Microbiology and Infectious Diseases in Milan, Italy. N.E.H., T.M.K., M.V.N.O., T.L.A., S.A.R., S.J.C.W., W.G., B.P.H., and P.D.R.J. have nothing to declare.
Footnotes
Published ahead of print 18 January 2013
Supplemental material for this article may be found at http://dx.doi.org/10.1128/AAC.01485-12.
REFERENCES
- 1. Deresinski S. 2007. Vancomycin and Staphylococcus aureus—an antibiotic enters obsolescence. Clin. Infect. Dis. 44:1543–1548 [DOI] [PubMed] [Google Scholar]
- 2. Gould IM. 2010. Is vancomycin redundant for serious staphylococcal infection? Int. J. Antimicrob. Agents 36(Suppl. 2):S55–S57 [DOI] [PubMed] [Google Scholar]
- 3. Rehm SJ, Tice A. 2010. Staphylococcus aureus: methicillin-susceptible S. aureus to methicillin-resistant S. aureus and vancomycin-resistant S. aureus. Clin. Infect. Dis. 51(Suppl. 2):S176–S182 [DOI] [PubMed] [Google Scholar]
- 4. Howden BP. 2005. Recognition and management of infections caused by vancomycin-intermediate Staphylococcus aureus (VISA) and heterogenous VISA (hVISA). Intern. Med. J. 35(Suppl. 2):S136–S140 [DOI] [PubMed] [Google Scholar]
- 5. Charles PG, Ward PB, Johnson PD, Howden BP, Grayson ML. 2004. Clinical features associated with bacteremia due to heterogeneous vancomycin-intermediate Staphylococcus aureus. Clin. Infect. Dis. 38:448–451 [DOI] [PubMed] [Google Scholar]
- 6. Holland TL, Fowler VG., Jr 2011. Vancomycin minimum inhibitory concentration and outcome in patients with Staphylococcus aureus bacteremia: pearl or pellet? J. Infect. Dis. 204:329–331 [DOI] [PubMed] [Google Scholar]
- 7. van Hal SJ, Lodise TP, Paterson DL. 2012. The clinical significance of vancomycin minimum inhibitory concentration in Staphylococcus aureus infections: a systematic review and meta-analysis. Clin. Infect. Dis. 54:755–771 [DOI] [PubMed] [Google Scholar]
- 8. Price J, Atkinson S, Llewelyn M, Paul J. 2009. Paradoxical relationship between the clinical outcome of Staphylococcus aureus bacteremia and the minimum inhibitory concentration of vancomycin. Clin. Infect. Dis. 48:997–998 [DOI] [PubMed] [Google Scholar]
- 9. Holmes NE, Turnidge JD, Munckhof WJ, Robinson JO, Korman TM, O'Sullivan MV, Anderson TL, Roberts SA, Gao W, Christiansen KJ, Coombs GW, Johnson PD, Howden BP. 2011. Antibiotic choice may not explain poorer outcomes in patients with Staphylococcus aureus bacteremia and high vancomycin minimum inhibitory concentrations. J. Infect. Dis. 204:340–347 [DOI] [PubMed] [Google Scholar]
- 10. Craig WA. 1998. Pharmacokinetic/pharmacodynamic parameters: rationale for antibacterial dosing of mice and men. Clin. Infect. Dis. 26:1–10 (Quiz, 26:11–12.) [DOI] [PubMed] [Google Scholar]
- 11. Craig WA. 2003. Basic pharmacodynamics of antibacterials with clinical applications to the use of beta-lactams, glycopeptides, and linezolid. Infect. Dis. Clin. North Am. 17:479–501 [DOI] [PubMed] [Google Scholar]
- 12. Drusano GL. 2004. Antimicrobial pharmacodynamics: critical interactions of ‘bug and drug’. Nat. Rev. Microbiol. 2:289–300 [DOI] [PubMed] [Google Scholar]
- 13. Rybak MJ. 2006. The pharmacokinetic and pharmacodynamic properties of vancomycin. Clin. Infect. Dis. 42(Suppl. 1):S35–S39 [DOI] [PubMed] [Google Scholar]
- 14. Rybak M, Lomaestro B, Rotschafer JC, Moellering R, Jr, Craig W, Billeter M, Dalovisio JR, Levine DP. 2009. Therapeutic monitoring of vancomycin in adult patients: a consensus review of the American Society of Health-System Pharmacists, the Infectious Diseases Society of America, and the Society of Infectious Diseases Pharmacists. Am. J. Health Syst. Pharm. 66:82–98 [DOI] [PubMed] [Google Scholar]
- 15. Sakoulas G, Moise-Broder PA, Schentag J, Forrest A, Moellering RC, Jr, Eliopoulos GM. 2004. Relationship of MIC and bactericidal activity to efficacy of vancomycin for treatment of methicillin-resistant Staphylococcus aureus bacteremia. J. Clin. Microbiol. 42:2398–2402 [DOI] [PMC free article] [PubMed] [Google Scholar]
- 16. Hidayat LK, Hsu DI, Quist R, Shriner KA, Wong-Beringer A. 2006. High-dose vancomycin therapy for methicillin-Resistant Staphylococcus aureus infections: efficacy and toxicity. Arch. Intern. Med. 166:2138–2144 [DOI] [PubMed] [Google Scholar]
- 17. Moise PA, Sakoulas G, Forrest A, Schentag JJ. 2007. Vancomycin in vitro bactericidal activity and its relationship to efficacy in clearance of methicillin-resistant Staphylococcus aureus bacteremia. Antimicrob. Agents Chemother. 51:2582–2586 [DOI] [PMC free article] [PubMed] [Google Scholar]
- 18. Mohr JF, Murray BE. 2007. Vancomycin is not obsolete for the treatment of infection caused by methicillin-Resistant Staphylococcus aureus. Clin. Infect. Dis. 44:1536–1542 [DOI] [PubMed] [Google Scholar]
- 19. del Mar Fernandez de Gatta Garcia M, Revilla N, Calvo MV, Dominguez-Gil A, Sanchez Navarro A. 2007. Pharmacokinetic/pharmacodynamic analysis of vancomycin in ICU patients. Intensive Care Med. 33:279–285 [DOI] [PubMed] [Google Scholar]
- 20. Soriano A, Marco F, Martinez JA, Pisos E, Almela M, Dimova VP, Alamo D, Ortega M, Lopez J, Mensa J. 2008. Influence of vancomycin minimum inhibitory concentration on the treatment of methicillin-resistant Staphylococcus aureus bacteremia. Clin. Infect. Dis. 46:193–200 [DOI] [PubMed] [Google Scholar]
- 21. Moise PA, Forrest A, Bhavnani SM, Birmingham MC, Schentag JJ. 2000. Area under the inhibitory curve and a pneumonia scoring system for predicting outcomes of vancomycin therapy for respiratory infections by Staphylococcus aureus. Am. J. Health Syst. Pharm. 57(Suppl. 2):S4–S9 [DOI] [PubMed] [Google Scholar]
- 22. Moise-Broder PA, Forrest A, Birmingham MC, Schentag JJ. 2004. Pharmacodynamics of vancomycin and other antimicrobials in patients with Staphylococcus aureus lower respiratory tract infections. Clin. Pharmacokinet. 43:925–942 [DOI] [PubMed] [Google Scholar]
- 23. Cockcroft DW, Gault MH. 1976. Prediction of creatinine clearance from serum creatinine. Nephron 16:31–41 [DOI] [PubMed] [Google Scholar]
- 24. Lodise TP, McKinnon PS, Swiderski L, Rybak MJ. 2003. Outcomes analysis of delayed antibiotic treatment for hospital-acquired Staphylococcus aureus bacteremia. Clin. Infect. Dis. 36:1418–1423 [DOI] [PubMed] [Google Scholar]
- 25. Knaus WA, Draper EA, Wagner DP, Zimmerman JE. 1985. APACHE II: a severity of disease classification system. Crit. Care Med. 13:818–829 [PubMed] [Google Scholar]
- 26. Le Gall J-R, Lemeshow S, Saulnier F. 1993. A new simplified acute physiology score (SAPS II) based on a European/North American multicenter study. JAMA 270:2957–2963 [DOI] [PubMed] [Google Scholar]
- 27. Charlson ME, Pompei P, Ales KL, MacKenzie CR. 1987. A new method of classifying prognostic comorbidity in longitudinal studies: development and validation. J. Chronic Dis. 40:373–383 [DOI] [PubMed] [Google Scholar]
- 28. Paterson DL, Ko WC, Von Gottberg A, Mohapatra S, Casellas JM, Goossens H, Mulazimoglu L, Trenholme G, Klugman KP, Bonomo RA, Rice LB, Wagener MM, McCormack JG, Yu VL. 2004. International prospective study of Klebsiella pneumoniae bacteremia: implications of extended-spectrum beta-lactamase production in nosocomial Infections. Ann. Intern. Med. 140:26–32 [DOI] [PubMed] [Google Scholar]
- 29. McGregor JC, Rich SE, Harris AD, Perencevich EN, Osih R, Lodise TP, Jr, Miller RR, Furuno JP. 2007. A systematic review of the methods used to assess the association between appropriate antibiotic therapy and mortality in bacteremic patients. Clin. Infect. Dis. 45:329–337 [DOI] [PubMed] [Google Scholar]
- 30. Antibiotic Expert Group 2006. Therapeutic guidelines: antibiotic, version 13. Therapeutic Guidelines Limited, Melbourne, Australia [Google Scholar]
- 31. Clinical and Laboratory Standards Institute 2006. Methods for dilution antimicrobial susceptibility tests for bacteria that grow aerobically: approved standard, 7th ed CLSI document M07-A7 CLSI, Wayne, PA [Google Scholar]
- 32. Mathew TH, Johnson DW, Jones GR. 2007. Chronic kidney disease and automatic reporting of estimated glomerular filtration rate: revised recommendations. Med. J. Aust. 187:459–463 [DOI] [PubMed] [Google Scholar]
- 33. Mathew TH. 2005. Chronic kidney disease and automatic reporting of estimated glomerular filtration rate: a position statement. Med. J. Aust. 183:138–141 [DOI] [PubMed] [Google Scholar]
- 34. Jeffres MN, Isakow W, Doherty JA, McKinnon PS, Ritchie DJ, Micek ST, Kollef MH. 2006. Predictors of mortality for methicillin-resistant Staphylococcus aureus health-care-associated pneumonia: specific evaluation of vancomycin pharmacokinetic indices. Chest 130:947–955 [DOI] [PubMed] [Google Scholar]
- 35. Neuner EA, Casabar E, Reichley R, McKinnon PS. 2010. Clinical, microbiologic, and genetic determinants of persistent methicillin-resistant Staphylococcus aureus bacteremia. Diagn. Microbiol. Infect. Dis. 67:228–233 [DOI] [PubMed] [Google Scholar]
- 36. Prakash V, Lewis JS, Jorgensen JH., II 2008. Vancomycin MICs for methicillin-resistant Staphylococcus aureus isolates differ based upon the susceptibility test method used. Antimicrob. Agents Chemother. 52:4528. [DOI] [PMC free article] [PubMed] [Google Scholar]
- 37. Hsu DI, Hidayat LK, Quist R, Hindler J, Karlsson A, Yusof A, Wong-Beringer A. 2008. Comparison of method-specific vancomycin minimum inhibitory concentration values and their predictability for treatment outcome of meticillin-resistant Staphylococcus aureus (MRSA) infections. Int. J. Antimicrob. Agents 32:378–385 [DOI] [PubMed] [Google Scholar]
- 38. Sader HS, Fey PD, Limaye AP, Madinger N, Pankey G, Rahal J, Rybak MJ, Snydman DR, Steed LL, Waites K, Jones RN. 2009. Evaluation of vancomycin and daptomycin potency trends (MIC creep) against methicillin-resistant Staphylococcus aureus isolates collected in nine U.S. medical centers from 2002 to 2006. Antimicrob. Agents Chemother. 53:4127–4132 [DOI] [PMC free article] [PubMed] [Google Scholar]
- 39. van Hal SJ, Barbagiannakos T, Jones M, Wehrhahn MC, Mercer J, Chen D, Paterson DL, Gosbell IB. 2011. Methicillin-resistant Staphylococcus aureus vancomycin susceptibility testing: methodology correlations, temporal trends and clonal patterns. J. Antimicrob. Chemother. 66:2284–2287 [DOI] [PubMed] [Google Scholar]
- 40. Brown J, Brown K, Forrest A. 2012. Vancomycin AUC24/MIC ratio in patients with complicated bacteremia and infective endocarditis due to methicillin-resistant Staphylococcus aureus and its association with attributable mortality during hospitalization. Antimicrob. Agents Chemother. 56:634–638 [DOI] [PMC free article] [PubMed] [Google Scholar]
- 41. Kullar R, Davis SL, Levine DP, Rybak MJ. 2011. Impact of vancomycin exposure on outcomes in patients with methicillin-resistant Staphylococcus aureus bacteremia: support for consensus guidelines suggested targets. Clin. Infect. Dis. 52:975–981 [DOI] [PubMed] [Google Scholar]
- 42. Lodise TP, Lomaestro B, Graves J, Drusano GL. 2008. Larger vancomycin doses (at least four grams per day) are associated with an increased incidence of nephrotoxicity. Antimicrob. Agents Chemother. 52:1330–1336 [DOI] [PMC free article] [PubMed] [Google Scholar]
- 43. Musta AC, Riederer K, Shemes S, Chase P, Jose J, Johnson LB, Khatib R. 2009. Vancomycin MIC plus heteroresistance and outcome of methicillin-resistant Staphylococcus aureus bacteremia: trends over 11 years. J. Clin. Microbiol. 47:1640–1644 [DOI] [PMC free article] [PubMed] [Google Scholar]
- 44. Rose WE, Leonard SN, Rossi KL, Kaatz GW, Rybak MJ. 2009. Impact of inoculum size and heterogeneous vancomycin-intermediate Staphylococcus aureus (hVISA) on vancomycin activity and emergence of VISA in an in vitro pharmacodynamic model. Antimicrob. Agents Chemother. 53:805–807 [DOI] [PMC free article] [PubMed] [Google Scholar]
- 45. Rule AD, Larson TS, Bergstralh EJ, Slezak JM, Jacobsen SJ, Cosio FG. 2004. Using serum creatinine to estimate glomerular filtration rate: accuracy in good health and in chronic kidney disease. Ann. Intern. Med. 141:929–937 [DOI] [PubMed] [Google Scholar]
- 46. Holmes NE, Turnidge JD, Munckhof WL, Robinson JO, Korman TM, O'Sullivan MVN, Anderson TL, Roberts SA, Gao W, Johnson PDR, Howden BP. 2011. Vancomycin pharmacodynamics in Staphylococcus aureus bacteremia, abstr A-1681. Abstr. 51st Intersci. Conf. Antimicrob. Agents Chemother. American Society for Microbiology, Washington, DC [Google Scholar]