Abstract
We used two methods to address two aspects of multi-finger synergies and their changes after fatigue of the index finger. Analytical inverse optimization (ANIO) was used to identify cost functions and corresponding spaces of optimal solutions over a broad range of task parameters. Analysis within the uncontrolled manifold (UCM) hypothesis was used to quantify co-variation of finger forces across repetitive trials that helped reduce variability of (stabilized) performance variables produced by all the fingers together. Subjects produced steady-state levels of total force and moment of force simultaneously as accurately as possible by pressing with the four fingers of the right hand. Both before- and during-fatigue, the subjects performed single trials for many force-moment combinations covering a broad range; the data were used for the ANIO analysis. Multiple trials were performed at two force-moment combinations; these data were used for analysis within the UCM hypothesis. Fatigue was induced by 1-min maximal voluntary contraction (MVC) exercise by the index finger. Principal component (PC) analysis showed that the first two PCs explained over 90% of the total variance both before and during fatigue. Hence, it was concluded that experimental observations formed a plane in the four-dimensional finger force space both before and during fatigue conditions. Based on this conclusion, quadratic cost functions with linear terms were assumed. The dihedral angle between the plane of optimal solutions and the plane of experimental observations was very small (a few degrees); it increased during fatigue. There was an increase with fatigue of the coefficient at the quadratic term for the index finger force balanced by a drop in the coefficients for the ring and middle fingers. Within each finger pair (index-middle and ring-little), the contribution of the “central” fingers to moment production increased during fatigue. An index of antagonist moment production dropped with fatigue. Fatigue led to higher co-variation indices during pronation tasks (index finger is an agonist) but opposite effects during supination tasks. The results suggest that adaptive changes in co-variation indices that help stabilize performance may depend on the role of the fatigued element, agonist or antagonist.
Keywords: fatigue, finger, redundancy, synergy, inverse optimization, uncontrolled manifold hypothesis
Introduction
Muscle fatigue leads to changes at various levels of the neuromotor system (reviewed in Enoka and Duchateau 2008; Enoka et al. 2011). Several recent studies have documented fatigue-induced changes in coordination of multi-element redundant systems that take part in virtually all natural movements (Forestier and Nougier 1998; Côté et al. 2002, 2008; Huffenus et al. 2006; Gates and Dingwell 2008; Fuller et al. 2009; Singh et al. 2010b; Singh and Latash 2011). A few of those studies used the framework of the uncontrolled manifold (UCM) hypothesis to quantify changes in multi-finger (Singh et al. 2010a, b) and multi-muscle synergies (Singh and Latash 2011) following fatigue of one of the elements (a finger or a muscle group) participating in the tasks. The UCM hypothesis (Scholz and Schöner 1999; Latash et al. 2002, 2007) assumes that the neural control of a redundant system may be adequately described as associated with the formation of a sub-space (UCM) within the space of elemental variables (for example, individual digit forces) corresponding to a desired magnitude of an important performance variable (for example, resultant force and/or moment of force produced by all the digits together). Further, variance across repetitive attempts may be represented as the sum of two components, within the UCM (“good” variance or VUCM) and orthogonal to the UCM (“bad” variance or VORT). If most of the variance is “good” (statistically, VUCM > VORT), a conclusion can be drawn that the performance variable is stabilized (in a sense of decreased variability) by co-varied adjustments of elemental variables.
The mentioned studies by Singh and colleagues of the effects of fatigue documented an increase in the variance of all elements, fatigued and non-fatigued, with most of the increase channeled into VUCM. In other words, synergy indices related to stabilization of such performance variables as total force (in finger studies) and coordinate of the center of pressure of a standing person (in multi-muscle tasks) increased during fatigue thus mitigating effects of fatigue on accuracy of performance.
Recently, a new method has been introduced to address another aspect of performance of a redundant system. The method, analytical inverse optimization (ANIO), assumes that patterns of involvement of individual elements into multi-element tasks are defined by an optimization principle. ANIO allows computing a cost function that is minimized by the system over a broad range of task parameters, under certain conditions and assumptions (Terekhov et al. 2010; Terekhov and Zatsiorsky 2011). Within the general framework of the idea of synergies (Latash 2010), ANIO addresses the problem of sharing performance variables among elements, while the UCM hypothesis addresses variable solutions during repetitive attempts at the same task.
The two approaches to analysis of synergies, UCM-based and ANIO-based, have been used together to analyze finger coordination in pressing tasks in young and older persons (Park et al. 2010, 2011a). Those studies have shown, in particular, that older persons demonstrate larger discrepancies between the observed finger force combinations and those computed from the reconstructed cost functions (quantified with the dihedral angle between the two planes corresponding to the actual and predicted from optimization finger force values, respectively). In addition, multi-finger synergies stabilizing total force and total moment were weaker in the older group. These results have suggested that there may be a link between changes in the two characteristics of synergies with age.
The main goal of the current study was to explore effects of fatigue on patterns of sharing of the total force (FTOT) and moment (MTOT) across a redundant set of fingers in pressing tasks. To perform the ANIO analysis, we used a set of single trials performed over a broad range of {FTOT; MTOT} values. We introduced a few changes into the ANIO methodology. Unlike earlier studies, the range of MTOT was scaled to FTOT to avoid combinations of large MTOT and small FTOT that proved to be hard to perform. We also changed the method of normalization of the coefficients reconstructed with ANIO (see Methods for details). Two {FTOT; MTOT} combinations were selected to perform analysis of synergies across repetitive trials using the UCM-based analysis
Based on the earlier studies (Singh et al. 2010a, b), we hypothesized that fatigue would lead to stronger synergies reflected in larger co-variation among elemental variables across repetitive attempts at the same task. On the other hand, we expected performance across different tasks to be less consistent in following a single optimization principle (cf. Enoka and Duchateau 2008) resulting in larger values of the dihedral angle between the planes of optimal solutions and experimental observations. Potentially, these two hypotheses can compete with each other, given the reported link between the synergy indices and the dihedral angle (Park et al. 2010, 2011a).
Methods
Subjects
Eight young male subjects were recruited in the study. Their average age, height, and weight were 28.38 ± 5.73 years (mean ± standard deviation), 175 ± 4.66 cm, 70.89 ± 6.90 kg. All subjects were right-handed with no known previous history of neuropathies or traumas to their upper extremities. Also, none of the subjects had a history of excessive use of hands and fingers such as typing as a job and playing musical instruments. Before testing, the experimental procedures of the study were explained and the subjects signed a consent form approved by the Office for Research Protection in the Pennsylvania State University.
Apparatus
Four force sensors (Nano-17, ATI Industrial Automation, Garner, NC) were used to measure vertical forces (i.e., normal forces) by individual fingers. The sensors were attached to a customized flat panel (140 × 90 × 5 mm) (Fig. 1c). The sensors were covered with sandpaper in order to increase the friction between subject’s fingertips and the surfaces of sensors. The position of each sensor in the sagittal plane (i.e., Y-axis) was adjusted according to the hand anatomy of individual subject, and then the sensors were mounted on the adjusted position throughout the whole experiments. The distance between adjacent sensors was 3.0cm in medio-lateral direction within the panel. The panel was mechanically fixed to a stationary table. The four normal force signals were digitized at 200 Hz with a 16-bit resolution (PCI-6225, National Instrument, Austin, TX) with a customized LabVIEW program (LabVIEW 8.5, National Instrument, Austin, TX).
Figure 1.
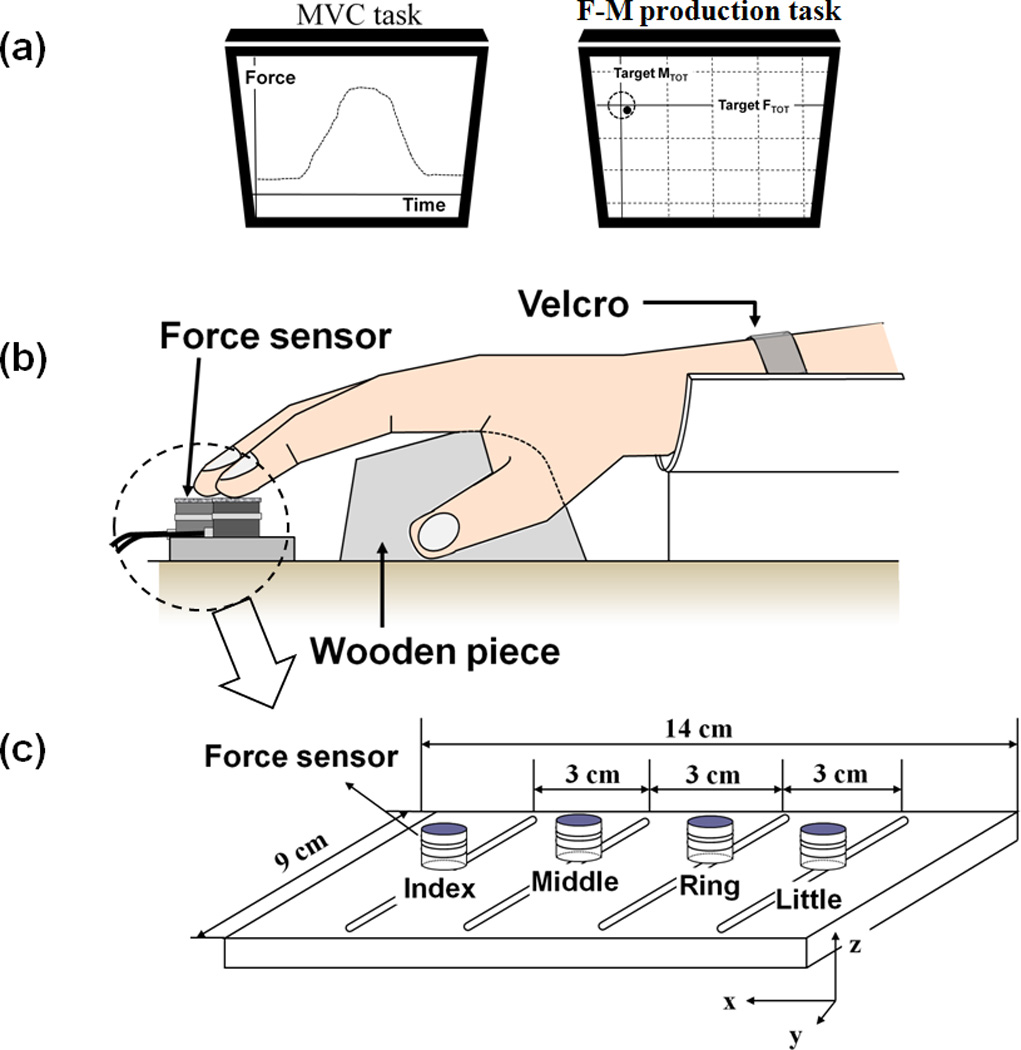
a: The feedback screens during the MVC task and accurate force-moment production tasks. During each trial, the produced FTOT and MTOT values were displayed on the computer screen, which showed the task and the cursor corresponding to the current FTOT along the vertical axis and MTOT along the horizontal axis. b: The experimental setup. A wooden piece was placed underneath the subject’s right palm in order to avoid changes in the configuration of the hand and fingers. c: The finger pressing setup. The sensors, shown as white cylinders, were attached to a wooden frame. The frame was fixed to the immovable table.
Procedures
Subjects had a 20-min orientation session to be instructed in the experimental procedure and to become familiar with the experimental setup. The subjects had multiple practice trials to ensure that they were able to perform the tasks prior to the main experiments. The subjects sat in a chair facing the 19-inch computer screen, which was positioned 0.5m in front of the subject, and positioned their right upper arm on a wrist-forearm brace that was fixed to the table. The forearm was held stationary with Velcro straps. The subjects placed the fingertips on the centers of sensors and kept the fingertips on the sensors during finger force measurement (Fig. 1b). A wooden piece was placed underneath the subject’s right palm (Fig. 1b) in order to avoid changes in the configuration of the hand and fingers (Li et al. 1998; Kang et al. 2004; Olafsdottir et al. 2007). The experiment consisted of two main conditions including before fatigue and during fatigue conditions. Within each condition, there were two main tasks, 1) maximal voluntary contraction (MVC) tasks and 2) accurate total force-moment {FTOT; MTOT} production tasks.
Before-fatigue condition
First, the four fingers maximal voluntary contraction force (MVCIMRL) and index finger MVC force (MVCI) were measured in order to scale the task space in the {FTOT; MTOT} production tasks. During the MVC tests, the subjects were instructed to reach maximal pressing force within 3 s by the index finger alone (MVCI) and by all four fingers (MVCIMRL), and the maximal force was measured. During the MVCI task, the subjects were asked to keep all the fingers on the sensors and ignore possible force production by other fingers. During the accurate force-moment production tasks, the subjects were required to produce various {FTOT; MTOT} combinations as accurately as possible. MTOT was computed with respect to the mid-point between the middle (M) and ring (R) fingers assuming lever arms dI = −4.5 cm, dM = −1.5 cm, dR = 1.5 cm, dL = 4.5 cm (I – index, M-middle, R – ring, L - little). The subjects were explicitly told how MTOT was computed and had sufficient practice trials during the orientation session.
In each trial, the subjects were required to reach the {FTOT; MTOT} target values in a moderate speed and maintain these values at least for 1.5 s as accurately as possible within 6 s. The subjects relaxed and waited for the next target as soon as a given trial was done successfully. The computer screen showed the task and the cursor corresponding to the current FTOT along the vertical axis and MTOT along the horizontal axis (see Fig. 1a).
There were nine levels of FTOT, from 5% to 45% of MVCIMRL at 5% intervals, and 16 levels of MTOT, from 4.0SU to 4.0PR at 0.5PR intervals; PR – pronation, SU – supination. As in earlier studies (Park et al. 2010, 2011a, b), 1PR was defined as the product of 7% of MVCI by the lever arm of the index finger (dI = −4.5 cm). The number of MTOT levels was different for each level of FTOT as shown in Table 1. As a result, the {FTOT; MTOT} task space formed a triangle, which differed from the rectangular task spaces employed in previous studies (Park et al. 2010, 2011a, b). This was done to avoid relatively large performance errors in tasks involving low FTOT and high MTOT.
Table 1.
Combinations of target total force (FTOT) and moment of force (MTOT)
| FTOT (%MVC) | MTOT (PR) | ||||||||||||||||
|---|---|---|---|---|---|---|---|---|---|---|---|---|---|---|---|---|---|
| 45 | −4.0 | −3.5 | −3.0 | −2.5 | −2.0 | −1.5 | −1.0 | −0.5 | 0.0 | 0.5 | 1.0 | 1.5 | 2.0 | 2.5 | 3.0 | 3.5 | 4.0 |
| 40 | −3.5 | −3.0 | −2.5 | −2.0 | −1.5 | −1.0 | −0.5 | 0.0 | 0.5 | 1.0 | 1.5 | 2.0 | 2.5 | 3.0 | 3.5 | ||
| 35 | −3.0 | −2.5 | −2.0 | −1.5 | −1.0 | −0.5 | 0.0 | 0.5 | 1.0 | 1.5 | 2.0 | 2.5 | 3.0 | ||||
| 30 | −2.5 | −2.0 | −1.5 | −1.0 | −0.5 | 0.0 | 0.5 | 1.0 | 1.5 | 2.0 | 2.5 | ||||||
| 25 | −2.0 | −1.5 | −1.0 | −0.5 | 0.0 | 0.5 | 1.0 | 1.5 | 2.0 | ||||||||
| 20 | −1.5 | −1.0 | −0.5 | 0.0 | 0.5 | 1.0 | 1.5 | ||||||||||
| 15 | −0.5 | −1.0 | 0.0 | 0.5 | 1.0 | ||||||||||||
| 10 | −0.5 | 0.0 | 0.5 | ||||||||||||||
| 5 | 0.0 | ||||||||||||||||
The levels of target FTOT and MTOT are given in percent of four fingers MVC (maximal voluntary contraction) and multiples of 1PR, respectively. 1PR was defined as the product of 7% index finger MVC by the lever arm of the index finger (−4.5cm). PR stands for pronation.
The subjects performed one trial for each {FTOT; MTOT} combination in a random order for a total of 81 trials. Finger forces from these 81 trials were used to compute a cost function with the ANIO approach. Two sets of {FTOT; MTOT} combinations, {30% of MVCIMRL, 2PR} and {30% of MVCIMRL, 2SU}, were performed 20 times each by each subject. These sets of trials were used to perform analysis of synergies within the UCM hypothesis framework. After each block of 5 trials, a 20-s break was given. When the subjects requested, additional rest was provided, and no subjects reported fatigue in the before-fatigue condition.
During-fatigue condition
The subjects had a 5-min break upon the completion of the before-fatigue condition. As in earlier studies (Danion et al. 2000, 2001; Singh et al. 2010a, b), we used 1-min MVC force production by the index finger to induce initial fatigue. After the initial fatiguing exercise, MVCIMRL and MVCI were measured to re-scale the task space. Within the newly scaled task space, the subjects performed the same numbers of trials for force-moment production tasks, 81 trials at different {FTOT, MTOT} combinations for the ANIO analysis and 20 trials at each of the two {FTOT, MTOT} combinations for the UCM analysis. To avoid index finger force recovery, after every five trials of {FTOT; MTOT} production tasks, the subjects were asked to perform MVCI for 20 s as an additional exercise. This was done to keep the fatigue-induced drop in MVCI at about 30% (as in Singh et al. 2010a,b). Thus, each subject performed 24 of 20-s subsequent fatigue exercises. Note that only the index finger was actively involved in the fatigue exercise, and the subjects were instructed to avoid the force production by other fingers. The entire experiment including both before- and during-fatigue conditions lasted for approximately 1.5 hours.
Data Analysis
Initial data processing
Matlab (Matlab 7.4.0, Mathworks, Inc) programs were written for data processing and analysis. The 4th-order, 5-Hz Butterworth low-pass digital filter was applied to the original force data. The filtered finger force data from each trial were averaged over 1.5 s in the middle of the time period where steady-state values of individual finger forces were observed. The steady-state time period was identified by visual data inspection.
Task constraints
There were two constraints for each trial:
| (1) |
where α indicates a given percentage of MVC (α = 5 to 45% at 5% interval).
| (2) |
where d stands for the lever arm; β = −4 to 4 at 0.5 intervals.
The ANIO approach (for details see Appendix 1)
First, principal component analysis (PCA) was performed on the 81-trial sets of the finger force data for each subject collected in the before- and during-fatigue conditions separately. The significant PCs were extracted with the Kaiser Criterion (Kaiser 1960; PCs with eigevvalues over 1.0). The percent of the total variance explained by the first two PCs was computed to examine whether the experimental data were confined to a two-dimensional space in the four-dimensional force space. Assuming planar data distributions (as in earlier studies, Park et al. 2010, 2011), the objective function was expected to be:
| (3) |
where i = {index (I), middle (M), ring (R), and little (L)}, and k and w are coefficients. All the coefficients were normalized by the square root of the sum of the second-order coefficient squared (i.e., by ) for across-subjects comparisons. We expected all ki > 0 to comply with the basic assumptions of the objective function minimization (Terekhov et al. 2010). The angle between the plane of optimal solutions computed for the same set of {FTOT, MTOT} combinations based on the computed cost function and the plane determined by the experimental observations (the dihedral angle, DANGLE) was computed for each condition.
Co-contraction index
The IM and RL finger pairs produced moments of force in opposite directions, PR or SU, respectively. Agonist moment (MAGO) and antagonist moment (MANT) were defined as the moment produced by the finger pair acting in the direction of task MTOT and opposite to the required direction, respectively. I and M fingers produced MAGO during PR and MANT during SU. R and L fingers produced MANT during PR and MAGO during SU. A co-contraction index (CCI) was computed using absolute magnitudes of MAGO and MANT:
| (4) |
Theoretically, CCI could range from 0 (MANT = 0), to 1 (MAGO = −MANT).
The task space was divided into six areas, and average CCI was computed within each area. The six areas corresponded to three levels of FTOT (Low – 10–20%, Mid – 25–35%, and High – 40–45%) and two levels of MTOT (PR and SU).
Moment of force sharing analysis
Given that the nominal pivot was in-between the M and R fingers, the lateral fingers (I and L) had larger moment arms as compared to the central fingers. The percent of MAGO and MANT produced by the lateral fingers, %MAGO_Lateral and %MANT_Lateral was quantified:
| (5) |
| (6) |
Total performance error
Over the two sets of 20 trials for the two {FTOT; MTOT} combinations, the total performance error (TPE) was quantified as the average absolute magnitude of the difference between the produced and task variables. It was quantified in percent to the task variables:
| (7) |
| (8) |
where and represent the produced total force and moment of force at i-th trial, respectively. FTarget and MTarget indicate the prescribed total force and moment of force, respectively.
Synergy analysis (for details see Appendix 2)
The finger force data were analyzed within the framework of the UCM hypothesis (Scholz and Schöner 1999) using the sets of 20 trials at the same {FTOT; MTOT} combinations. Briefly, two variance components were computed across the 20 trials. One of the components (VUCM) did not change the averaged across trials magnitude of the selected performance variable, while the other component (VORT) reflected force variance that did. VUCM and VORT were computed with respect to FTOT, MTOT, and {FTOT, MTOT} simultaneously as the performance variables. Further, an index reflecting the relative amounts of VUCM and VORT was computed as:
| (10) |
where VTOT stands for the total finger force variance, and each variance index is computed per degree-of-freedom in the corresponding spaces. The index was computed with respect to FTOT (ΔVF), MTOT (ΔVM), and {FTOT, MTOT} (ΔVFM). Prior to statistical analysis (see later), this index was transformed using a Fisher z-transformation (ΔVz) adapted to the boundaries of ΔV.
Statistics
The data are presented as means and standard errors. For the sets of 81 combinations of {FTOT; MTOT}, we explored effects of fatigue on the coefficients (ki and wi) in the J function, the co-contraction index (CCI), and the torque shares by the lateral moment agonist (%MAGO_Lateral) and antagonist (%MANT_Lateral). Repeated-measures ANOVAs were used with factors Fatigue (two levels: before- and during-fatigue), Force (three levels: Low, Mid, and High), and Moment (two levels: PR and SU). The assumptions of sphericity were checked using Mauchly’s sphericity test, and the Greenhouse-Geisser correction was used if the assumption of sphericity was violated. For the coefficients in the J cost function and DANGLE, Wilcoxon’s signed-ranks test was used for comparisons between before- and during-fatigue conditions.
For the sets of 20 repetitive trials for two {FTOT; MTOT} combinations, ANOVAs with repeated measures were used with the following factors: Fatigue, Moment, Analysis (two levels: FTOT, MTOT or three levels: FTOT, MTOT, {FTOT; MTOT}), and Finger (four levels: I, M, R and L). The factors were chosen based on particular comparisons. For comparison of force-sharing patterns between the before- and after-fatigue conditions, MANOVA was used, and Rao’s R was computed. Since the sum of force shares of individual fingers is always 100%, only three shares, those by the M, R, and L fingers were used for comparison. Tukey’s honestly significant difference tests and pairwise contrasts were used to explore significant effects.
UANGLE, the dihedral angle between the UCM and the plane of optimal solutions, was compared between the before-fatigue () and during-fatigue () conditions and also to 90° (t-tests).
Prior to ANOVAs, variables with computational boundaries were transformed using Fisher’s z-transformation according to the boundaries of each variable. The statistical power for all comparisons was computed, and for all planned comparisons the power was over 0.7 for the pool of 8 subjects. The level of significance was set at p < 0.05.
Results
Effect of fatigue on maximal force production
The average MVC of the index finger (MVCI) and all four fingers (MVCIMRL) across subjects was 34.63 N (± 7.91 N) and 70.13 N (± 5.87 N), respectively. After the one-minute MVC exercise by the index finger (the initial fatigue exercise), MVC forces dropped significantly for both the index finger (to 20.88 ± 4.76 N, p < 0.001) and four fingers (to 55.13 ± 7.00 N, p < 0.01). On average, the peak force dropped by 36.2% [range 21.95% to 47.2%] and 17.6% [range 7.8% to 30.0%], for the I-finger and four-finger tasks respectively.
Principal component analysis
The PCA was performed on the sets of 81 finger force combinations performed both before- and during-fatigue conditions. The 81 observations covered a broad range of {FTOT; MTOT} combinations (see Methods for details). Overall, the first two PCs accounted for more than 90% of the total variance in the finger force space for both before- and during-fatigue conditions (Table 2). Both the average across subjects amount of variance explained by the first PCs (94.96% vs. 94.45%) were similar for the two conditions. The ranges were also similar. The PCA results show that the experimental observations were mainly confined to a two-dimensional hyper-plane in the four-dimensional force space, and the planarity was not affected by fatigue.
Table 2.
Variance explained by PCs
| PC1 | PC2 | PC1 + PC2 | ||||
|---|---|---|---|---|---|---|
| Mean | Range [min, max] |
mean | Range [min, max] |
mean | Range [min, max] |
|
| Before fatigue | 66.16 | [59.60, 71.37] | 28.80 | [25.45, 31.75] | 94.96 | [91.36, 96.82] |
| During fatigue | 69.68 | [61.93, 79.10] | 24.76 | [17.65, 29.03] | 94.45 | [90.96, 96.75] |
The average and minimal-maximal percent variances (in parentheses) explained by PC1, PC2, and PC1+PC2 across subjects are shown.
The ANIO approach
Based on the PCA results, we concluded that the cost-function was quadratic with linear terms: (see ‘Method’ and Terekhov et al. 2010). The coefficients at the quadratic (ki) and the linear terms (wi) were defined to provide the best fit for the data. These coefficients for individual subjects in the two conditions (before- and during-fatigue) are presented in Table 3. Note that all the k coefficients are positive, which confirms the applicability of the ANIO method (see Terekhov et al. 2010; Terekhov and Zatsiorsky 2011).
Table 3.
The parameters ki and wi estimated from the ANIO approach
| Subject | kI | kM | kR | kL | wI | wM | wR | wL |
DANGLE (° ) |
|
|---|---|---|---|---|---|---|---|---|---|---|
| 1 | Before fatigue | 0.43 | 0.36 | 0.41 | 0.72 | −0.60 | 0.51 | 0.77 | −0.69 | 1.06 |
| During fatigue | 0.51 | 0.43 | 0.41 | 0.62 | −0.11 | 0.00 | 0.32 | −0.22 | 3.55 | |
| 2 | Before fatigue | 0.50 | 0.40 | 0.57 | 0.52 | −0.10 | 0.20 | −0.08 | −0.01 | 1.49 |
| During fatigue | 0.56 | 0.40 | 0.51 | 0.51 | −0.09 | 0.15 | 0.04 | −0.07 | 1.51 | |
| 3 | Before fatigue | 0.29 | 0.35 | 0.47 | 0.76 | −0.10 | 0.00 | 0.03 | −0.21 | 1.38 |
| During fatigue | 0.41 | 0.29 | 0.38 | 0.78 | −0.10 | 0.05 | 0.03 | −0.07 | 2.66 | |
| 4 | Before fatigue | 0.55 | 0.52 | 0.52 | 0.40 | −0.11 | 0.15 | 0.04 | −0.07 | 1.88 |
| During fatigue | 0.58 | 0.49 | 0.50 | 0.47 | −0.06 | 0.08 | 0.03 | −0.05 | 3.15 | |
| 5 | Before fatigue | 0.60 | 0.44 | 0.48 | 0.47 | −0.39 | 0.48 | 0.22 | −0.31 | 6.70 |
| During fatigue | 0.79 | 0.33 | 0.32 | 0.39 | −0.38 | 0.46 | 0.21 | −0.29 | 6.00 | |
| 6 | Before fatigue | 0.64 | 0.43 | 0.40 | 0.50 | −0.13 | 0.28 | −0.16 | 0.01 | 3.08 |
| During fatigue | 0.74 | 0.37 | 0.34 | 0.45 | −0.06 | 0.16 | −0.13 | 0.03 | 3.80 | |
| 7 | Before fatigue | 0.17 | 0.16 | 0.31 | 0.92 | −0.11 | 0.12 | 0.07 | −0.09 | 2.04 |
| During fatigue | 0.27 | 0.19 | 0.33 | 0.88 | −0.11 | 0.13 | 0.06 | −0.08 | 2.17 | |
| 8 | Before fatigue | 0.56 | 0.31 | 0.39 | 0.66 | −0.02 | 0.09 | 0.11 | −0.05 | 0.58 |
| During fatigue | 0.63 | 0.08 | 0.12 | 0.76 | −0.32 | 0.32 | 0.34 | −0.33 | 4.87 |
ki and wi are the second- and first-order coefficients, respectively. I, M, R, and L stand for the index, middle, ring, and little finger, respectively. DANGLE is the dihedral angle between the plane of computed optimal solutions and the plane of experimental observations.
After the fatiguing exercise, the second-order coefficients (kI) at the I finger force increased for all subjects, while k for the M and R finger forces decreased for most subjects (kM: for 5 out of 8 subjects, kR: for 6 out of 8 subjects) (Fig. 2a). There was no consistency in the changes in kL for the L finger force. Wilcoxon’s signed-ranks test confirmed significant differences in kI and kR (p < 0.05). The coefficients at the linear terms (w) for the lateral (I and L) finger forces were negative, while those for the central (M and R) finger forces were positive both before and during fatigue (Fig. 2b). There were no significant changes in the magnitude of w after the fatiguing exercise.
Figure 2.
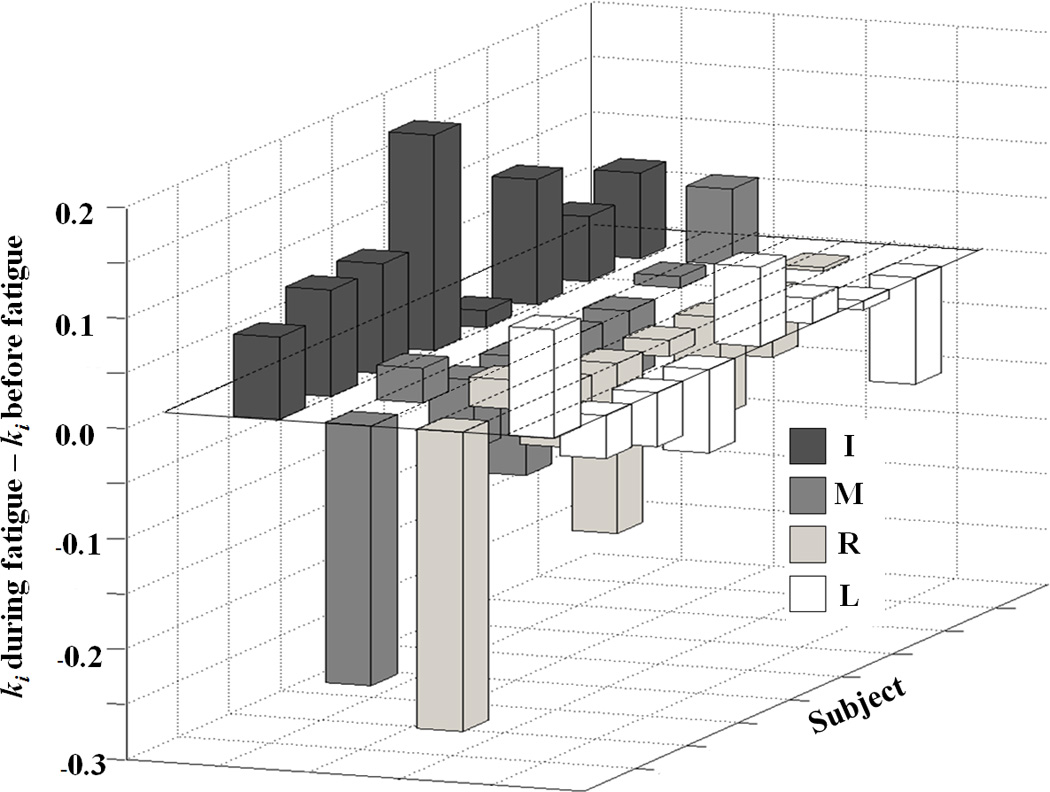
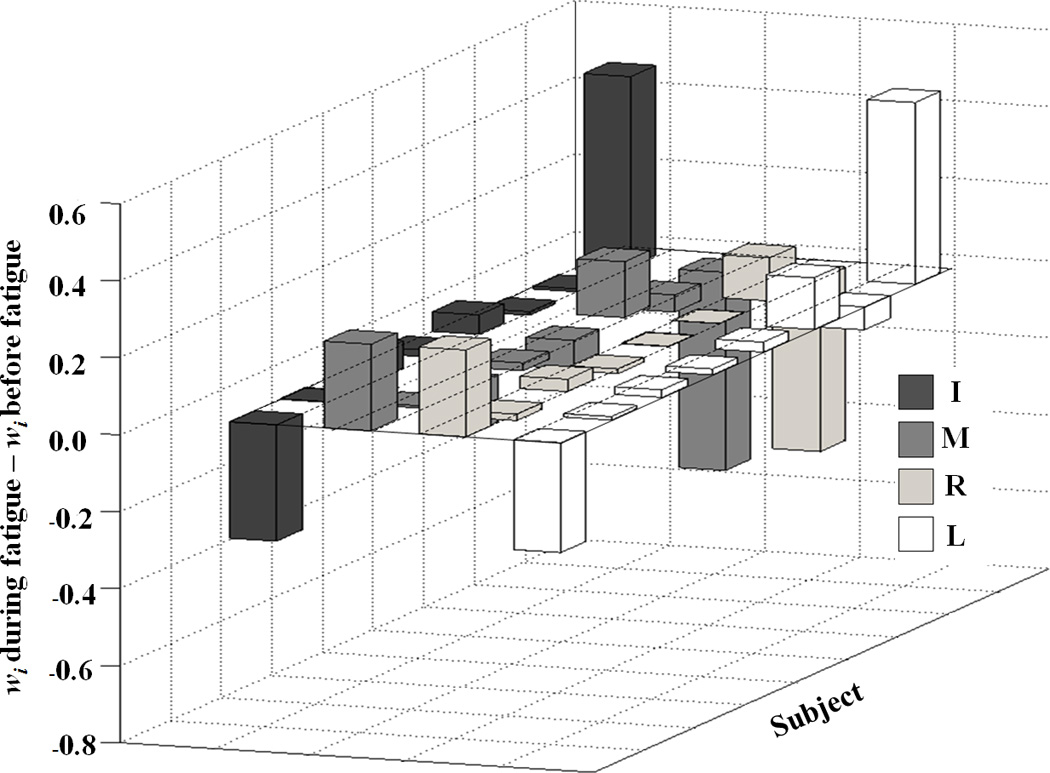
The differences between the coefficients in the cost functions computed based on the before-fatigue and during-fatigue conditions for a: the second-order (wi) and b: the first-order terms (ki) for individual subjects. The positive values mean that coefficients increased during fatigue, while negative values mean that coefficients decreased during fatigue. i = {I – index, M – middle, R – ring, L – little}.
The average DANGLE (the angle between the plane of optimal solution and the plane of experimental observations) across subjects increased with the fatiguing exercise, on average, from 2.37 ± 1.91° to 3.72 ± 1.46° (p < 0.05, t-test).
Co-contraction index
In all tasks that required non-zero MTOT production, fingers that acted in the MTOT direction (agonists, MAGO) and those that acted in the opposite direction (antagonists, MANT) produced force. The co-contraction index (CCI) quantified the relative magnitude of MANT with respect to MAGO. Because the task space was scaled with MVCIMRL (along the FTOT axis) and MVCI (along the MTOT axis), the fatiguing exercise led to a reduction of the task space along both axes. The CCI comparison between the two conditions was performed using the data before fatigue for task sub-spaces that overlapped with the task space during fatigue (in absolute units, N and Nm). For each subject, this task space was divided into six areas corresponding to three levels of force (Low, Mid, and High) and two levels of moment (PR and SU) – see Methods for more details.
Figure 3 illustrates the CCI indices averaged across subjects. CCI increased with FTOT (Low, Mid < High), and it was higher for PR tasks as compared to SU tasks. Fatigue led to a significant drop in CCI; these effects were stronger for PR tasks. A three-way repeated-measures ANOVA on z-transformed CCI, Fatigue × Force × Moment confirmed significant effects of all three factors [Fatigue: F[1,7] = 67.67, p < 0.001; Force: F[2,14] = 57.50, p < 0.001; Moment: F[1,7] = 91.00, p < 0.001] with significant Fatigue × Force [F[2,14] = 16.99, p < 0.01] and Fatigue × Moment [F[1,7] = 25.50, p < 0.01] interactions. The Fatigue × Force interaction reflected the fact that CCI before fatigue was larger than CCI during fatigue at Low and Mid force conditions (p < 0.05).
Figure 3.
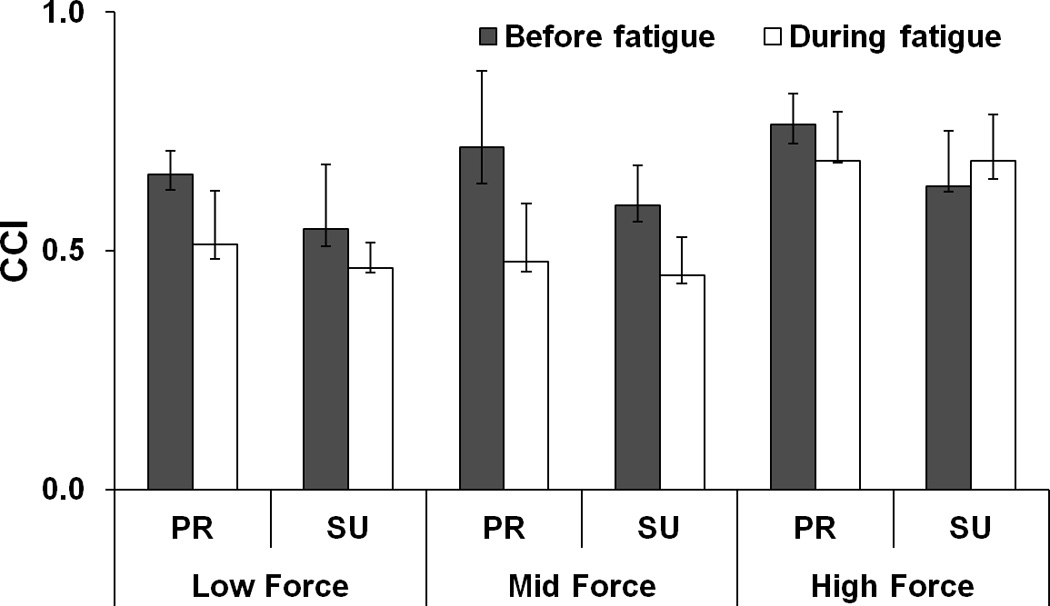
Co-contraction index (CCI) for different {FTOT; MTOT} combinations before fatigue (black bars) and during fatigue (white bars). The average values across subjects are presented. The error bars represent the lower and upper quartiles of the data distribution (25% – 75%). Low, Mid, and High forces correspond to the ranged of 10 – 20%, 25 – 35%, and 40 – 45% of MVCIMRL, respectively. PR and SU stand for pronation and supination, respectively.
Moment of force sharing
Further, we analyzed the relative contributions of the lateral (I and L) fingers to both MAGO and MANT (%MAGO_LATERAL and %MANT_LATERAL). As shown in Fig. 4, both indices were significantly larger before fatigue than during fatigue. In addition, %MAGO_LATERAL decreased with the magnitude of prescribed force (Low > Mid > High), particularly for PR tasks; %MAGO_LATERAL in PR was larger than that in SU when the prescribed force was Low (Fig. 4a). No such differences were observed for %MANT_LATERAL. These results were confirmed by ANOVAs on z-transformed %MAGO_LATERAL and %MANT_LATERAL that showed main effect of Fatigue on both indices [F[1,7] = 6.56, p < 0.05 for %MAGO_LATERAL; F[1,7] = 10.15, p < 0.05 for %MANT_LATERAL] and significant interactions Force × Fatigue [F[2,14] = 4.15, p < 0.05] and Force × Moment [F[2,14] = 8.97, p < 0.01] for %MAGO_LATERAL. The significant Force × Fatigue interaction reflected a significant drop in %MAGO_LATERAL with fatigue only at the High forces (p < 0.05). The significant Force × Moment interaction for %MAGO_LATERAL reflected larger %MAGO_LATERAL in PR than in SU only at Low forces (p < 0.05).
Figure 4.
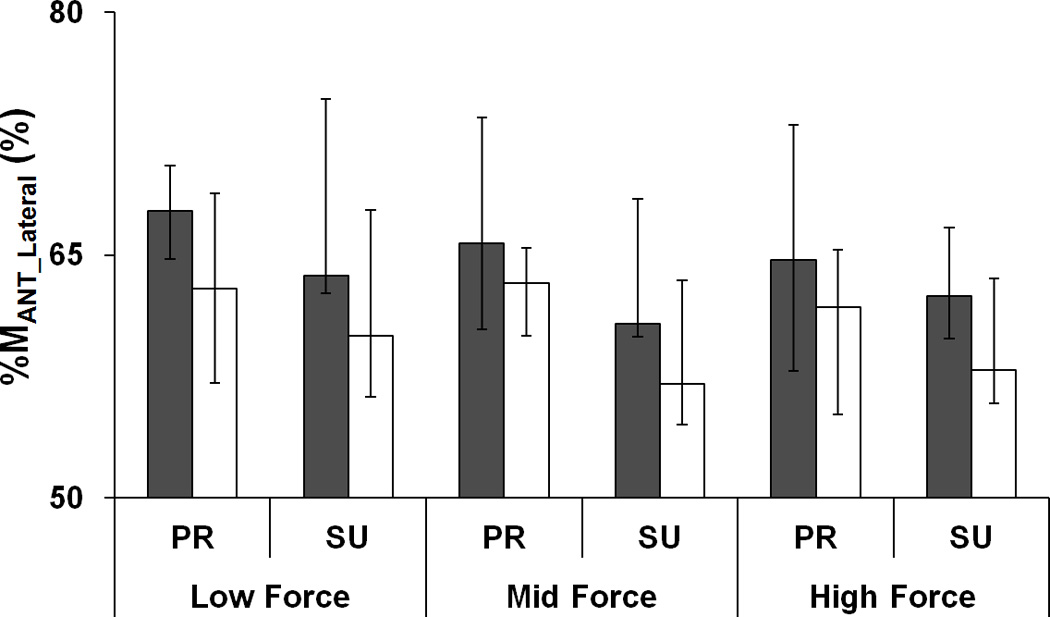
a: The percent torque produced by lateral agonist (%MAGO_Lateral) to total agonist moment (MAGO) and b: the percent torque produced by lateral antagonist (%MANT_Lateral) to the total antagonist moment (MANT) before fatigue (black bars) and during fatigue (white bars). The average values across subjects are presented. The error bars represent the lower and upper quartiles of the data distribution (25% – 75%). Low, Mid, and High forces correspond to the ranged of 10 – 20%, 25 – 35%, and 40 – 45% of MVCIMRL, respectively. PR and SU stand for pronation and supination, respectively.
Effect of fatigue on total performance errors
The total performance errors (TPE) with respect to task FTOT and MTOT measured in individual trials were averaged across trials (20 trials) for each subject and condition, and then averaged across subjects. Overall, TPE of MTOT (TPEM) was significantly larger than TPE of FTOT (TPEF). Fatigue led to increase in both TPEF and TPEM, particularly for the PR task (Fig. 5). These results were confirmed by ANOVAs on z-transformed TPE that showed main effects of Analysis (two levels: FTOT and MTOT) [F[1,7] = 11.18, p < 0.05] and Fatigue [F[1,7] = 18.67, p < 0.01] with a significant Fatigue × Moment interaction [F[1,7] = 5.17, p < 0.05]. The interaction reflected a significant increase in TPE with fatigue only for the PR task (p < 0.05).
Figure 5.
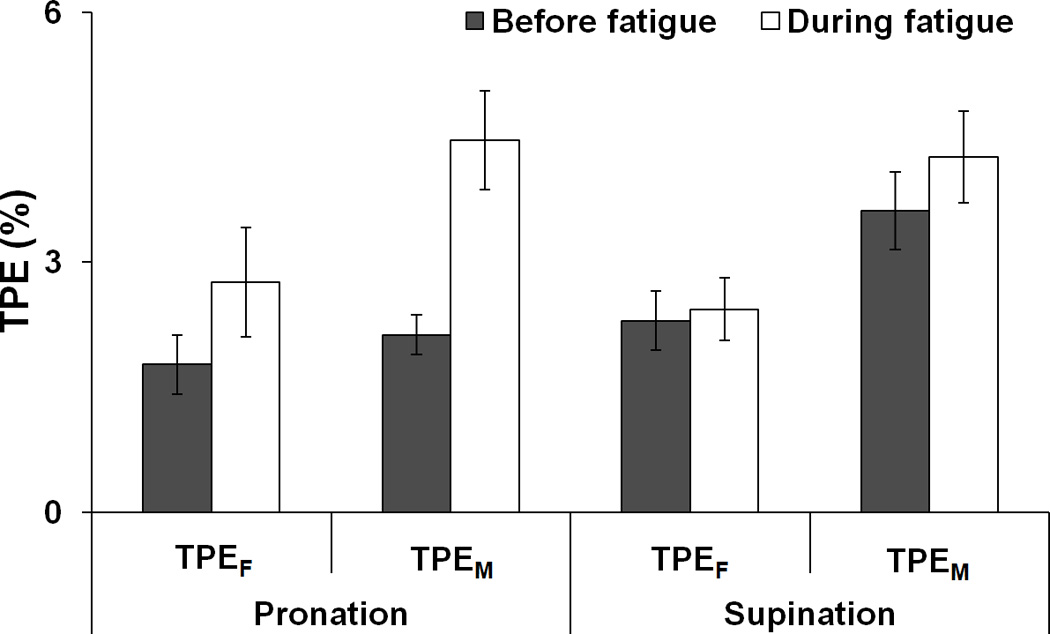
The total performance error (TPE) computed for total force (TPEF) and total moment of force (TPEM) before fatigue (black bars) and during fatigue (white bars). The average values across subjects are presented with standard error bars.
Effect of fatigue on the sharing patterns and coefficient of variation
The average shares of FTOT by individual fingers across 20 repetitive trials for two {FTOT; MTOT} combinations were computed. The shares of the lateral finger (I and L) forces decreased during fatigue, while the central finger (M and R) shares increased with fatigue for both PR and SU tasks (Fig. 6a). MANOVA with factors Fatigue (two levels), and Moment (two levels) showed significant main effects of Fatigue [R[3,5] = 6.65, p < 0.05 and of Moment [R[3,5] = 99.91, p < 0.0001] with a significant interaction Moment × Fatigue [R[3,5] = 11.50, p < 0.05]. Further, univariate analysis of individual finger force shares showed an effect of Fatigue for the I finger [F[1,7] = 24.56, p < 0.01, before fatigue > during fatigue], M finger [F[1,7] = 11.47, p < 0.05, before fatigue < during fatigue], and L finger [F[1,7] = 15.29, p < 0.01, before fatigue > during fatigue]. The main effect of Moment was significant for all three fingers (p < 0.001). A significant Fatigue × Moment interaction for the force share of L finger [F[1,7] = 10.18, p < 0.05] reflected the fact that this share before fatigue was larger than that during fatigue, particularly for SU tasks (p <0.05).
Figure 6.
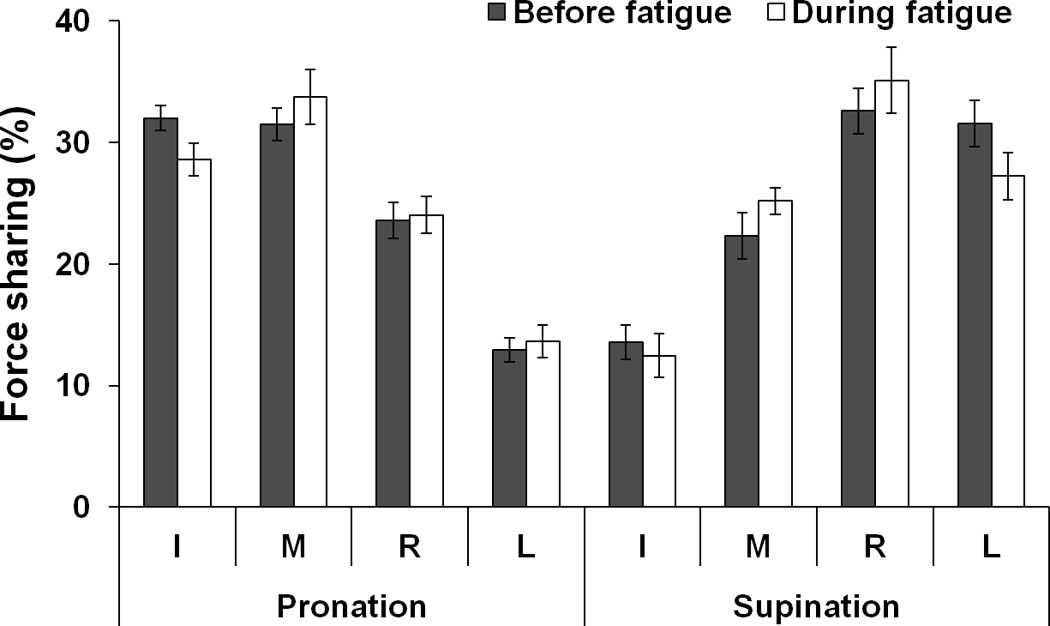
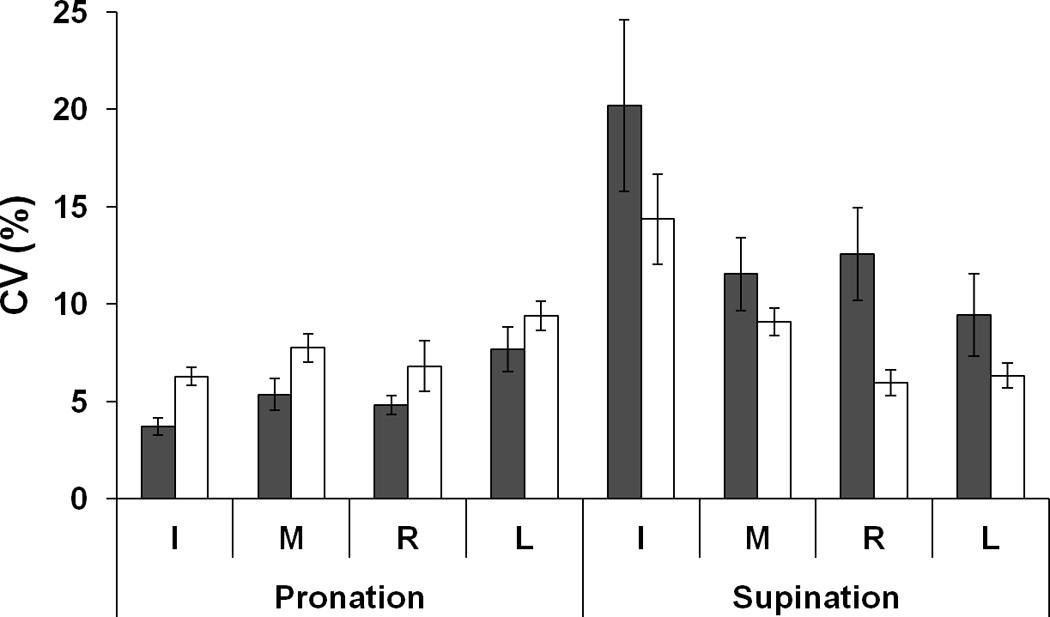
a: Force shares of the index (I), middle (M), ring (R), and little (L) fingers before fatigue (black bars) and during fatigue (white bars) averaged across subjects. b: coefficient of variation (CV) before fatigue (black bars) and during fatigue (white bars). Values are means ± standard errors.
Coefficient of variation (CV) was computed for each individual finger force over the 20 repetitive trials. Overall, CV during SU was significantly larger than during PR (except for L finger). Fatigue led to higher CV during the PR tasks but lower CV during the SU tasks (Fig. 6b). A three-way ANOVA on CV, Fatigue × Finger × Moment showed main effects of Moment [F[1,7] = 15.77, p < 0.01] and Finger [F[3,21] = 3.11, p < 0.05] with significant interactions Fatigue × Moment [F[1,7] = 4.83, p < 0.05] and Moment × Finger [F[3,21] = 12.43, p < 0.001]. The Fatigue × Moment interaction reflected opposite changes in CV for the PR and SU tasks with fatigue (p < 0.05). The Moment × Finger interaction reflected significant CV differences between the PR and SU tasks for the I and M finger forces (p < 0.05), but not for the R and L finger forces.
Analysis of multi-finger synergies
Two components of finger force variances, VUCM and VORT, were quantified per degree-of-freedom with respect to FTOT, MTOT, and their combination, {FTOT, MTOT}. Variances in the individual finger forces were normalized by MVCIMRL squared of corresponding subject and fatigue conditions.
Generally, VUCM was always greater than VORT meaning that finger force variability across trials was mostly confined to a sub-space where the selected performance variables remained unchanged. Both VUCM and VORT increased with fatigue during the PR task, while VUCM decreased with fatigue during the SU task. VUCM for {FTOT; MTOT} stabilization was larger than VUCM for FTOT and MTOT stabilizations, particularly during the SU task (FTOT, MTOT < FMTOT) (Fig. 7a). VORT for MTOT stabilization was smaller than for the other two analyses (MTOT < FTOT < FMTOT) (Fig. 7b). These findings were supported by ANOVAs performed separately on VUCM and VORT with factors Fatigue, Moment, and Analysis (three levels: FTOT-related, MTOT-related, and FMTOT-related). Main effect of Analysis on both indices was significant [F[1.08,7.58] = 47.35, p < 0.001 for VUCM; F[1,7] = 7.70, p < 0.01 for VORT]. There were significant interactions Fatigue × Moment [F[2,14] = 5.80, p < 0.05], Analysis × Moment [F[1.38,9.67] = 17.03, p < 0.001], and Fatigue × Analysis × Moment [F[1.04,7.31] = 6.01, p < 0.05] for VUCM. The Analysis × Moment interaction reflected the fact that the effect of Analysis on VUCM (FTOT, MTOT < FMTOT) was stronger during SU task than during PR task (p < 0.05), and this two-way interaction was observed only before fatigue (confirmed by the three-way interaction Fatigue × Analysis × Moment). The other significant two-way interaction Fatigue × Moment reflected the fact that VUCM for the PR task was larger than for the SU task before fatigue, while VUCM (PR) < VUCM (SU) during fatigue (p < 0.05). The difference in VORT for the PR task between the two fatigue conditions (before fatigue < during fatigue) was just under the significance level (p = 0.09).
Figure 7.
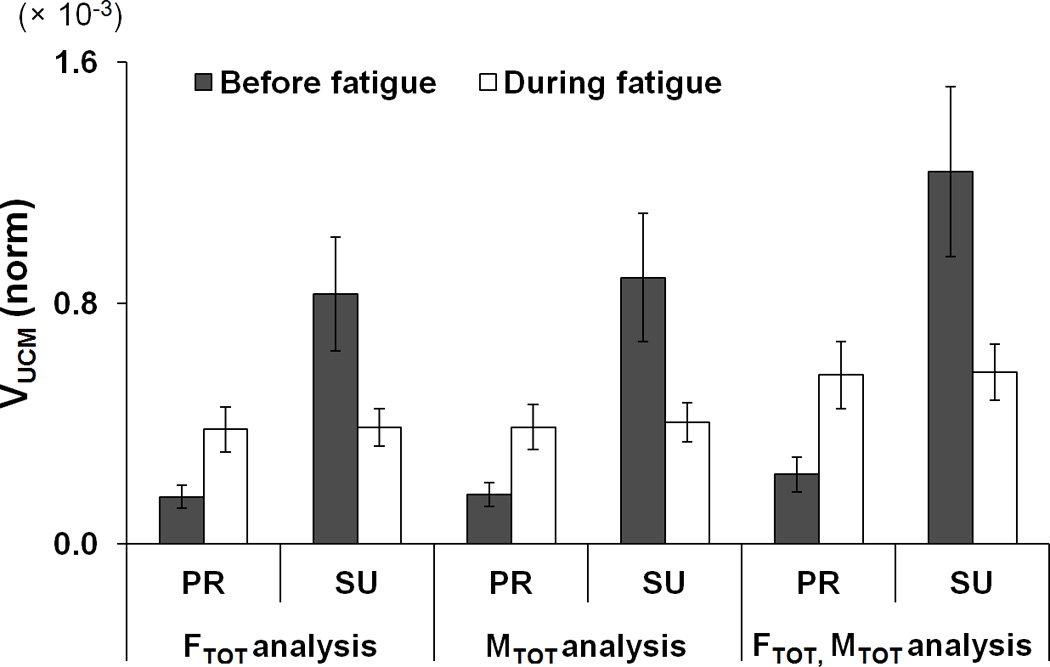
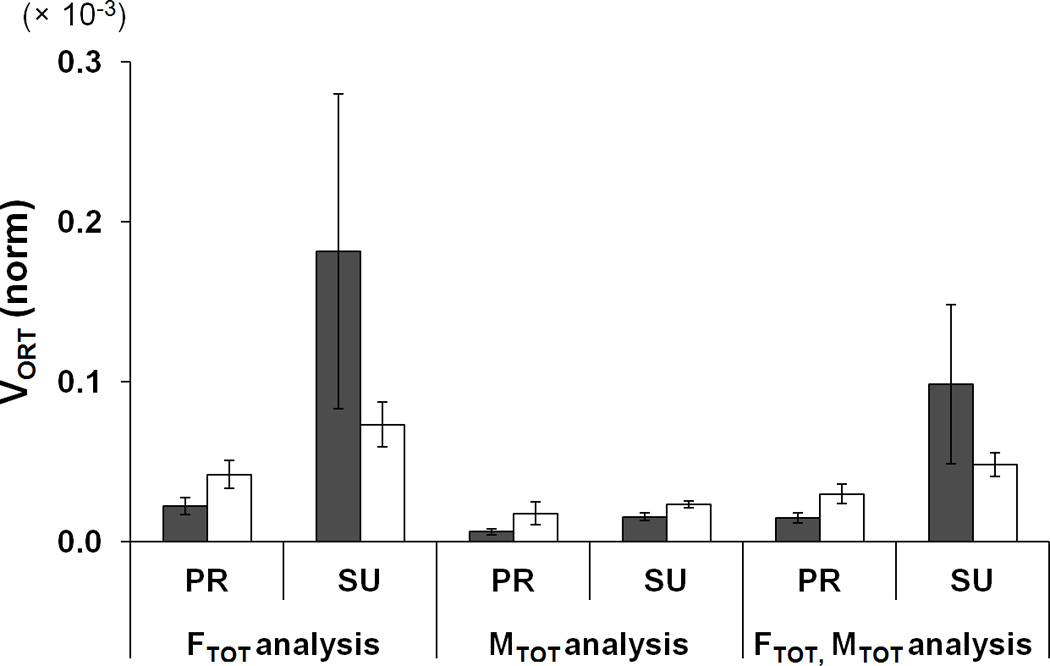
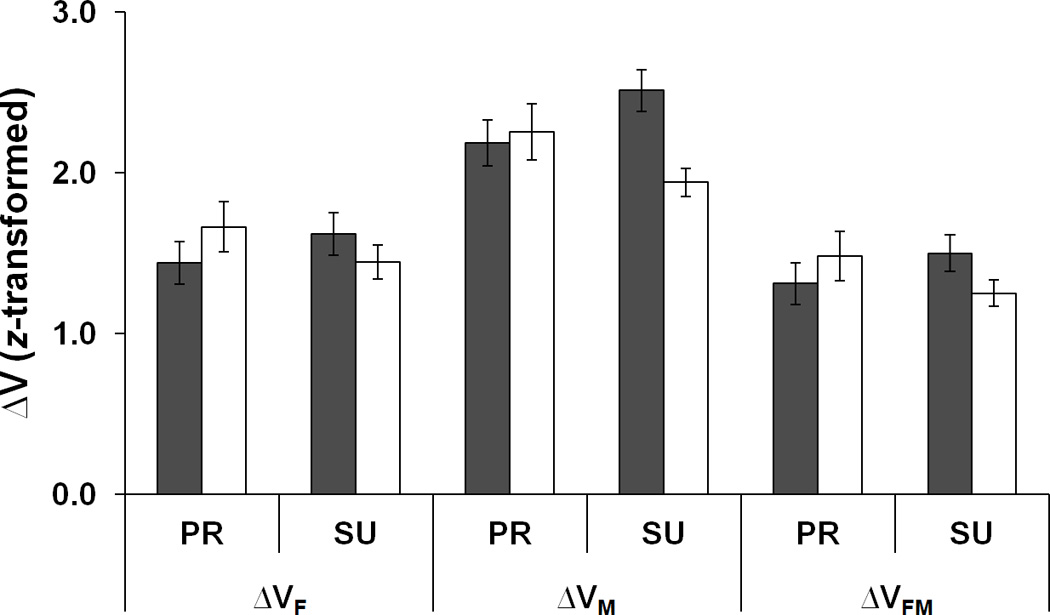
Two components of variance, a: VUCM, b: VORT, and c: z-transformed ΔV (dimensionless) in the finger force space for the FTOT related, MTOT related, and {FTOT; MTOT} related. PR and SU represent pronation and supination, respectively. Variances were quantified per degree-of-freedom of corresponding spaces and normalized to the square of MVCIMRL. The average values across subjects are presented with standard error bars.
The ΔV indices for FTOT (ΔVF), MTOT (ΔVM), and {FTOT, MTOT} (ΔVFM) were computed as the normalized difference between VUCM and VORT (see Methods). Across the conditions, ΔVM > ΔVF > ΔVFM. Fatigue resulted in higher ΔVF and ΔVFM during PR task, while ΔVF, ΔVM, and ΔVFM during SU task became smaller (Fig. 7c). A three-way repeated measures ANOVA with the factors Fatigue, Moment, and Analysis was performed on z-transformed ΔV values. The main effects of Analysis was significant [F[1.02,7.16] = 112.33, p < 0.001) , and the pairwise comparisons confirmed that ΔVM > ΔVF > ΔVFM (p < 0.001). There was a significant two-way interaction Fatigue × Moment [F[2,14] = 12.76, p < 0.001], reflecting the fact that ΔV increased during fatigue for the PR task and dropped during the SU task (p < 0.05).
The angle between the UCM and space of optimal solutions
UANGLE, the dihedral angle between the UCM computed with respect to {FTOT; MTOT} stabilization and the space of optimal solutions defined with the ANIO approach, was computed. This angle before fatigue, was larger than during fatigue, > , on average, 87.49° ± 2.38° vs. 84.58° ± 3.29° respectively. This difference was, however, slightly below the level of significance (p = 0.07). The one-sample t-tests against 90° confirmed that both and were significantly different from 90° (p < 0.05).
Discussion
Only some of the main hypotheses formulated in the Introduction have been confirmed. In particular, fatigue led to less consistency in following an optimization principle and larger values in the dihedral angle between the planes of optimal solutions and of experimental observations (i.e., DANGLE). These observations are similar to the earlier described differences between young and healthy elderly persons (Park et al. 2011a). Fatigue produced changes in the two components of finger force variance (VUCM and VORT) that confirmed earlier observations only partly. There was an increase in both VUCM and VORT during the pronation (PR) tasks, with VUCM showing larger changes (similar to Singh et al. 2010a, b). However, this was not the case for the supination (SU) tasks, which showed, on average, a drop in VUCM with fatigue, while VORT increased. These results suggest an increase in the synergy index during fatigue for PR tasks only. Further we discuss implications of the study for the effects of fatigue on synergic action of fingers and for moments of force performed into PR and SU.
Two aspects of multi-finger synergies
As in earlier studies (reviewed in Latash et al. 2007; Latash 2010), our understanding of synergies is based on two main characteristics of action of redundant multi-element systems. The first is related to patterns of sharing of potentially important performance variables across the elemental variables. These patterns show consistency across ranges of performance variables. For example, Li et al. (1998) showed that shares of the total force produced during pressing tasks by individual fingers are consistent over the whole range of total force values. The second characteristic has been described using different terms such as stability and flexibility. It refers to an ability of the system to use variable solutions to achieve highly consistent performance over repeated attempts at the same task. For example, when a person presses with two fingers and tries to produce the same total force level in a series of trials, the individual finger forces (or commands to fingers, “finger modes” –Zatsiorsky et al. 1998, 2002b; Li et al. 2002; Danion et al. 2003) show negative co-variation across trials (Latash et al. 2001; Scholz et al. 2002). If one considers the two characteristics together, the former describes preferred areas in the space of elemental variables while the other describes their co-variation potentially leading to different shapes of data point clouds over repeated trials.
The uncontrolled manifold (UCM) hypothesis (Scholz and Schöner 1999) has proven to provide a powerful toolbox to analyze the latter feature by comparing variance within two sub-spaces, the UCM corresponding to a fixed value of a performance variable and the orthogonal sub-space. In contrast, the ANIO deals with the former aspect, that is, the sharing aspect of synergies (Terekhov et al. 2010). Unlike commonly used optimization methods, it does not start with assuming a cost function based on some intuitive considerations from physics, physiology, or psychology (Nubar and Contini 1961; Rosenbaum et al. 2001; Prilutsky and Zatsiorsky 2002; Ait-Haddou et al. 2004), but analyzes a cloud of data points obtained during performance that covers a broad range of task variables. The ANIO procedure results in a cost function, which in case of four-finger tasks with two constraints {FTOT; MTOT} has been shown to represent a second-order polynomial with person-specific coefficients (Park et al. 2010, 2011a). Further, the cost function is used to compute an “optimal” data set for the same values of the {FTOT; MTOT} constraints. The DANGLE between this space and the space of original data may be used as an index of consistency in following an optimization principle described by the cost function.
Figure 8 illustrates the idea using a two-element task with only one constraint, total force (FTOT) produced by two fingers. The lines with a negative slope are the UCMs for different FTOT values. Ellipses show possible experimental data distributions. The line fitted to the observations that cover the whole range represents the sub-space of optimal solutions. Note that it is not orthogonal to the UCMs (UANGLE < 90°). Note that the angle between the sub-spaces of experimental data and optimal solutions (DANGLE) is very small.
Figure 8.
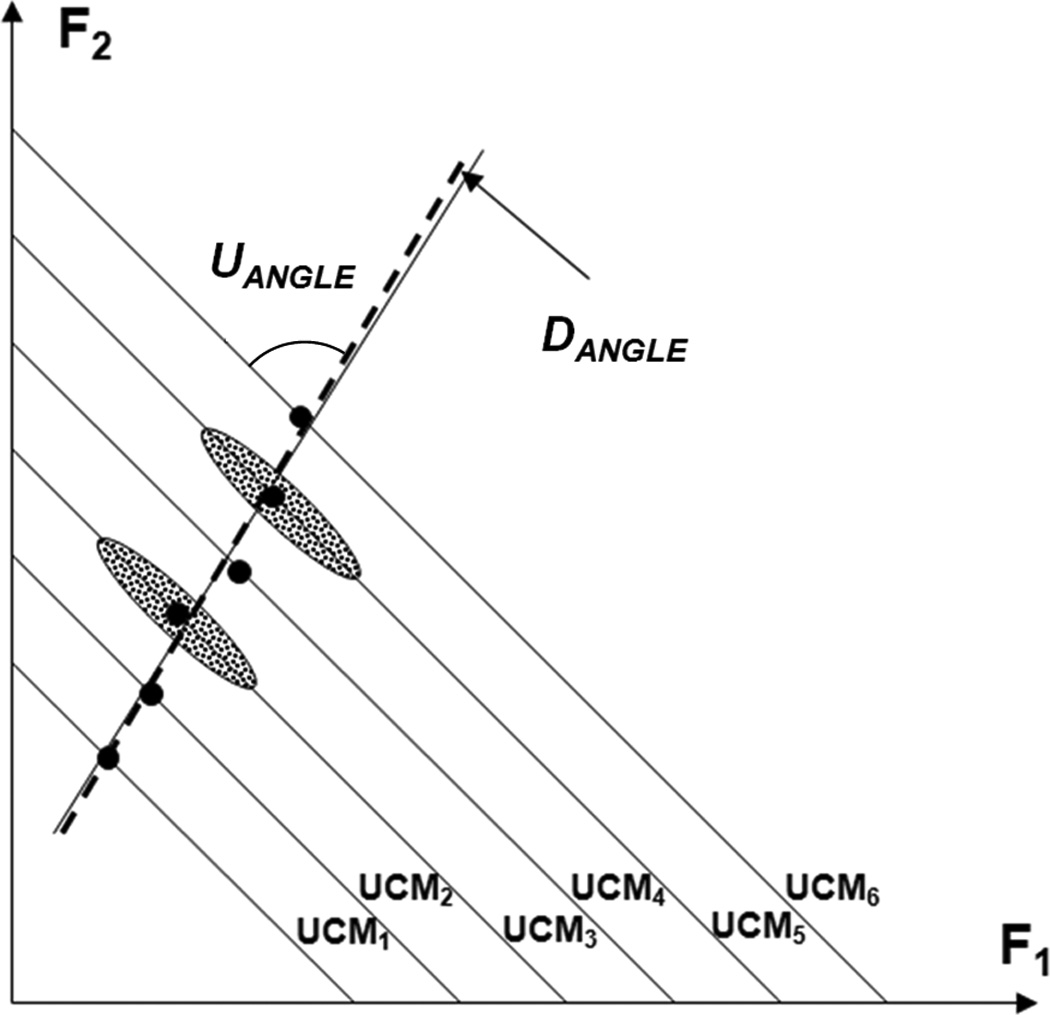
An illustration of the main ideas with an imagined two-digit force production task. Data over the first session (ANIO analysis) are represented with large dots; data over the second session (UCM analysis) are represented by ellipses. The lines with negative slopes are the UCMs. Note the angle between the space (line) of optimal solutions (the thick dashed line) and the UCM, which differs from 90° (UANGLE < 90°). Note the small angle between the space of experimental observations (the thin solid line) and space of optimal solutions.
The two approaches seem to be incompatible since direct optimization produces a single solution for every set of task constraints while the idea of flexibility/stability assumes numerous solutions, mostly elongated along the UCM as in Figure 8. However, within the described scheme, there is no incompatibility because optimization defines not a single solution but the center of a distribution of possible numerous solutions.
In the current study, the overall findings are well compatible with the described theory. Both before and during fatigue, PCA of the finger force data showed that two PCs accounted for well over 90% of total variance. It is important that the data fit a plane equally well before and after the fatiguing exercise, which justifies assuming a quadratic polynomial cost function in both conditions. The exact distribution of the total variance between the first two PCs is of a lesser importance, and we will not consider this difference here, particularly because it was small. The computed cost functions produced sets of optimal solutions that formed a plane that was nearly parallel to the plane of experimental observations (DANGLE on the order of a few degrees). When the subjects performed repeated tasks over two sets of {FTOT; MTOT} combinations, VORT was significantly smaller than VUCM for all analyses, both tasks, and both before and during fatigue. This may be interpreted as multi-digit synergies stabilizing both FTOT and MTOT simultaneously. By itself, this is not a trivial observation. It supports a general idea that one of the major purposes of synergies is to allow a multi-element system to participate in several tasks simultaneously with minimal interference between the tasks (Zhang et al. 2008; Gera et al. 2010).
Fatigue-induced changes in synergies
Fatigue led to significant changes in both characteristics of multi-finger synergies. As expected, during fatigue, the performance was less consistent in following an optimization principle, which was reflected in higher DANGLE magnitudes. There were relatively minor changes in the coefficients within the cost function. Only coefficients at the second-order terms showed significant changes, an increase of kI (for the I finger) and a decrease in kR (for the R finger). Higher coefficients mean that producing force with that particular finger leads to higher cost function values that, by definition, are to be avoided. So, these results may be interpreted as higher costs of using the fatigued finger balanced naturally with lower costs for force production by other fingers (although only effects for the R finger reached significance).
The fatigued I finger decreased its contribution to PR moments of force during both PR and SU tasks (when it acted as a moment agonist and moment antagonist, respectively); correspondingly, the share of the M finger in PR moment production increased. A similar redistribution happened within the RL finger pair: The share of the L finger dropped, while the share of the R finger increased (see Fig. 4). While the effect on the IM moment sharing may be viewed as a direct consequence of I finger fatigue, the effects on the RL moment sharing are less obvious. It is possible that symmetry of the IM and RL sharing patterns is a default, which is being followed under a variety of conditions including the one we studied.
A number of earlier studies reported relatively minor changes in accuracy of performing a variety of tasks by multi-element systems after fatigue of one (or a few) of the elements (Forestier and Nougier 1998; Côté et al. 2002, 2008; Huffenus et al. 2006; Gates and Dingwell 2008; Fuller et al. 2009). Since fatigue is known to lead to an increase in motor variability (Carpentier et al. 2001; Evans et al. 2003; Allen and Proske 2006; Missenard et al. 2008, 2009; Contessa et al. 2009), these phenomena suggest that multi-element systems afford the central nervous system an advantage of being able to adjust to fatigue of an element by adjustments in the coordination among the elements. An increase in the relative amount of “good” variance (VUCM) has indeed been documented in several earlier studies (Singh et al. 2010a, b; Singh and Latash 2011). Importance of redundancy for such effects have been indirectly supported by a study of Kruger et al. (2007) who reported no increase in the synergy index after fatigue of all four fingers.
Results of the current study have been unexpectedly ambiguous with respect to effects of fatigue on the synergy indices (ΔV). Only PR tasks showed changes in the amounts of VUCM and VORT that could be expected from the cited earlier studies. In contrast, during SU tasks, VUCM dropped while VORT increased corresponding to a drop in the synergy index. Earlier studies (Singh et al. 2010a, b) used total force production tasks only. In such tasks subjects naturally prefer finger force sharing patterns with higher forces produced by the I and M fingers as compared to the forces by the R and L fingers (Li et al. 1998; Zatsiorsky et al. 1998). So, when there are no constraints on MTOT, subjects naturally produce a PR moment of force with respect to the mid-point between the M and R fingers. Our results with PR MTOT production confirmed an increase in the synergy index during fatigue, as in the cited earlier studies.
There is an important difference between the PR and SU tasks: The I finger that performed the fatiguing exercise was a moment agonist in the PR tasks and moment antagonist in the SU tasks. So, we can tentatively conclude that increased co-variation (stronger synergies) can be used by the central nervous system only if the fatigued element is an agonist within the task. This may be related to the relative magnitude of the contribution of the fatigued element to the task. If an element is an antagonist, its force is typically much lower as compared to a comparable task in which the element is an agonist. The lower magnitude of force is typically associated with lower force variance (Newell and Carlton 1988; Christou et al. 2002; Shapkova et al. 2008). This low variance may not afford enough room for an accurate adjustment of variance by other fingers.
Note that the I and M fingers typically show lower indices of variability as compared to the R and L fingers (Gorniak et al. 2008). It is not surprising, therefore, that SU tasks that used the R and L fingers as moment agonists were associated with significantly higher coefficients of variation than the PR tasks. Similar results were obtained in a previous study (Park et al. 2010) but not reported in that paper; we re-analyzed the data from that study and confirmed the finding of significantly higher coefficients of variation in the SU tasks. Fatigue led to opposite changes in the finger force variance for the two tasks such that the variance magnitudes nearly equalized during fatigue. There was a significant difference between the PR and SU tasks in the way the increased variance was distributed between the UCM and the orthogonal sub-space: During the PR task, it was primarily channeled into VUCM, while during the SU task it mostly contributed to an increase in VORT.
Several recent studies have emphasized positive effects on motor variability on motor performance associated with repetitive actions. Our results are in line with this line of thinking; they suggest that an increase in variability of individual effectors can attenuate adverse effects of fatigue on the combined output of a redundant set of elements (although confirmed for PR tasks only).
Comparing the effects of aging and fatigue
There is a surprising overlap between the effects of fatigue found in this study and effects of aging described earlier (Park et al. 2011a). It seems as if fatigue made our participants older with respect to motor performance of their hands. Indeed, both fatigue and aging led to: (1) an increase in the DANGLE; (2) an increase in the coefficients at the second-order terms (k) for forces by fingers other than I finger (the normalization by kI in the former study does not allow direct comparisons of its changes between the studies); (3) a drop in the co-contraction index, CCI; and (4) a drop in the share of the lateral fingers (I and L) in moment production. The synergy index was lower for the elderly participants in the earlier study, similarly to the current results for the SU task only.
The drop in CCI looks particularly counter-intuitive. In our study, as well as in the mentioned study of elderly persons, lower values of CCI imply seemingly more economic performance, which seems advantageous. This advantage may be only seeming. Indeed, during fatigue, subjects decreased the shares of MTOT produced by lateral fingers (I and L). This means that relatively larger forces had to be produced by the central fingers (M and R) to reach required {FTOT; MTOT} combinations. Since the central fingers had smaller lever arms, for a given MTOT, larger force had to be produced by the agonist finger pair (IM for PR tasks and RL for SU tasks). Since FTOT is limited, this leaves less force for the antagonist finger pair, resulting in smaller CCI. So, the smaller CCI is a mechanical necessity given the drop in the share of the lateral fingers. This is an example of so-called chain effects (Zatsiorsky et al. 2002b, 2003; Zatsiorsky and Latash 2004; Shim et al. 2005) when a sequence of mechanically necessitated cause-effect pairs leads to a non-trivial outcome.
Concluding Comments
The main results of the study may be summarized as changes in both aspects of multi-digit synergies, sharing patterns and co-variation, following fatigue of a finger. More subtle changes include the redistribution of the moment of force between the central and lateral fingers within each finger pair (IM and RL), changes in the co-contraction index (CCI) ,and different effects of fatigue on multi-finger synergies during PR and SU tasks.
There have been a few methodological changes in this study as compared to the previous ones using the ANIO approach. On the one hand, these changes were implemented to avoid some of the earlier problems, such as difficult {FTOT, MTOT} combinations with high MTOT and low FTOT, as well as normalization of the coefficients of the cost functions that made kI=1 in all conditions. On the other hand, these changes complicate comparisons with earlier studies, which may be viewed as a limitation of the current design.
Acknowledgments
We are grateful to Dr. Alexander Terekhov for his advice. The study was supported in part by NIH grants AG-018751, NS-035032, and AR-048563.
Appendix 1
Analytical Inverse Optimization (ANIO) approach
The optimization problem in the current study was defined as
| (A1) |
The two linear constraints are expressed as
| (A2) |
The task involved two constraints (FTOT and MTOT values) and four elemental variables (finger forces). Thus, the solutions of this undetermined system were expected to be confined to a two-dimensional surface in the four-dimensional force space. Planarity of this surface was checked using the PCA. The following computational procedure explains how the optimization cost-function is obtained.
First, we identify whether the optimization problem is splittable or not by observing the (4×4) matrix:
| (A3) |
Second, we check whether the experimental data actually lie on a hyperplane (and not for instance on a curved hypersurface) and then define the observed hyperplane mathematically as
| (A4) |
where A is a 2×4 matrix composed of the transposed vectors of the two lesser principal components obtained from the PCA from the finger force data in session-1. A large percentage of the total variance explained by the two first principal components was considered an indicator that the data lie on a hyperplane. However, the data points were not perfectly confined to a plane due to the variability of performance and instrumental noise. Also, the plane computed from Eq. A4 is affected by experimental errors.
Third, we compare the experimentally determined hyperplane to the theoretical plane derived from the Uniqueness Theorem. The experimental data must be fitted by the following equation:
| (A5) |
where
fi are arbitrary continuously differentiable functions. At the second step the data are discovered to lie on the plane and hence the function fi '(.) are linear:
| (A6) |
where i = {index (I), middle (M), ring (R), and little (L)}.
Therefore,
| (A7) |
The values of the coefficients of the second-order terms ki can be determined by minimizing the dihedral angle between the two planes: the plane of optimal solutions and the plane of experimental observations (A⋅FT=0). The values of the coefficients of the first-order terms wi were found to correspond to a minimal vector length (w = (windex, wmiddle, wring, wlittle)T ) bringing the theoretical and the experimental plane as close to each other as possible. Vector w satisfy the following equation:
| (A8) |
where K = (kI, kM, kR, kL)T and w = (wI, wM, wR, wL)T.
Then, the functions gi in Equation A3 are the following:
| (A9) |
where r is a nonzero number, consti can be any real number, and qi is any real number satisfying the equation (Terekhov et al., 2010). Multiplication of the cost function by a constant value or adding a constant value to it does change the cost function essentially. Hence we can arbitrary assume that r = 1 and consti = 0. According to the Uniqueness Theorem identification of the cost function can be performed only up to unknown linear terms which are parameterized by the values qi. We assume that qi = 0 in order to simplify gi(xi). It must be kept in mind, however, that the true cost function used by the CNS might have these terms.
Uniqueness Theorem (for the mathematical proof see Terekhov et al. 2010)
The core of the ANIO approach is the theorem of uniqueness that specifies conditions for unique (with some restrictions) estimation of the objective functions. The main idea of the theorem of uniqueness is to find necessary conditions for the uniqueness of solutions in an inverse optimization problem. An optimization problem (i.e., direct optimization problem) with an additive objective function and linear constraints are defined as:
| (A10) |
where X=(x1, x2,…, xn)∈Rn, gi is an unknown scalar differentiable function with g'(∙)>0. gi came from the Lagrange minimum principle, which has a unique solution. On the contrary, the functions of gi can be computed from the set of solutions X* (e.g., experimental data). This inverse procedure is called the inverse optimization problem. C is a k×n matrix and B is a k-dimension vector, k<n.
First, assume that the optimization problem (A10) with k≥2 is non-splittable. If the inverse optimization is splittable, the preliminary step is to split it until a non-splittable subproblem is acquired. If the functions gi(xi) in problem (A10) are twice continuously differentiable (i.e., twice continuously differentiable functions fi ) and is not identically constant, complying for all X ∈ X*,
| (A11) |
and
| (A12) |
then
| (A13) |
for every , where and X* is the set of the solutions for all B ∈ Rk. The constants qi satisfy the equation where q = (q1, ⋯, qn)T. Primes designate derivatives.
If the experimental data correspond to solutions of an inverse optimization problem with additive objective function (gi) and linear constraints, equation (X ∈ X*) must be satisfied (i.e., the Lagrange principle). The Uniqueness Theorem provides sufficient condition (i.e., ) for solving the inverse optimization problem in a unique way up to linear terms.
Appendix 2
Uncontrolled manifold (UCM) analysis (see Latash et al. 2002; Scholz et al. 2002 for details)
For FTOT, changes in the elemental variables (finger forces) sum up to produce a change in FTOT:
| (B1) |
The UCM was defined as an orthogonal set of the vectors ei in the space of the elemental forces that did not change the net normal force, i.e.:
| (B2) |
These directions were found by taking the null-space of the Jacobian of this transformation ([1 1 1 1] ei). The mean-free forces were then projected onto these directions and summed to produce:
| (B3) |
where n=4 is the number of degrees-of-freedom of the elemental variables, and p=1 is the number of degrees-of-freedom of the performance variable (FTOT). The component of the de-meaned forces orthogonal to the null-space is given by:
| (B4) |
The amount of variance per degree of freedom parallel to the UCM is:
| (B5) |
The amount of variance per degree of freedom orthogonal to the UCM is :
| (B6) |
The normalized difference between these variances is quantified by a variable ΔV:
| (B7) |
where VTOT is the total variance, also quantified per degree of freedom. If ΔV is positive, VUCM > VORT, caused by negative co-variation of the finger forces, which we interpret as evidence for a force-stabilizing synergy. In contrast, ΔV=0 indicates independent variation of the finger forces, while ΔV < 0 indicates positive co-variation of the individual finger forces, which contributes to variance of FTOT.
A similar procedure was used to compute the two variance components related to stabilization of MTOT. The only difference was in using a different Jacobian corresponding to the lever arms of individual finger forces, [dI dM dR dL].
We also analyzed the data with respect to stabilization of both FTOT and MTOT simultaneously. In that case, the Jacobian was [1 1 1 1; dI dM dR dL]. The dimensionality of VUCM for the analysis with respect to FTOT and MTOT separately is three (one constraint), while the dimensionality of VUCM with respect to FTOT and MTOT simultaneously is two (two constraints).
References
- Ait-Haddou R, Jinha A, Herzog W, Binding P. Analysis of the force-sharing problem using an optimization model. Math Biosci. 2004;191:111–122. doi: 10.1016/j.mbs.2004.05.003. [DOI] [PubMed] [Google Scholar]
- Allen TJ, Proske U. Effect of muscle fatigue on the sense of limb position and movement. Exp Brain Res. 2006;170:30–38. doi: 10.1007/s00221-005-0174-z. [DOI] [PubMed] [Google Scholar]
- Carpentier A, Duchateau J, Hainaut K. Motor unit behaviour and contractile changes during fatigue in the human first dorsal interosseus. J Physiol. 2001;534:903–912. doi: 10.1111/j.1469-7793.2001.00903.x. [DOI] [PMC free article] [PubMed] [Google Scholar]
- Christou EA, Grossman M, Carlton LG. Modeling variability of force during isometric contractions of the quadriceps femoris. J Mot Behav. 2002;34:67–81. doi: 10.1080/00222890209601932. [DOI] [PubMed] [Google Scholar]
- Contessa P, Adam A, De Luca CJ. Motor unit control and force fluctuation during fatigue. J Appl Physiol. 2009;107:235–243. doi: 10.1152/japplphysiol.00035.2009. [DOI] [PMC free article] [PubMed] [Google Scholar]
- Côté JN, Feldman AG, Mathieu PA, Levin MF. Effects of fatigue on intermuscular coordination during repetitive hammering. Motor Control. 2008;12:79–92. doi: 10.1123/mcj.12.2.79. [DOI] [PubMed] [Google Scholar]
- Côté JN, Mathieu PA, Levin MF, Feldman AG. Movement reorganization to compensate for fatigue during sawing. Exp Brain Res. 2002;146:394–398. doi: 10.1007/s00221-002-1186-6. [DOI] [PubMed] [Google Scholar]
- Danion F, Latash ML, Li ZM, Zatsiorsky VM. The effect of fatigue on multifinger co-ordination in force production tasks in humans. J Physiol 523 Pt. 2000;2:523–532. doi: 10.1111/j.1469-7793.2000.00523.x. [DOI] [PMC free article] [PubMed] [Google Scholar]
- Danion F, Latash ML, Li ZM, Zatsiorsky VM. The effect of a fatiguing exercise by the index finger on single- and multi-finger force production tasks. Exp Brain Res. 2001;138:322–329. doi: 10.1007/s002210100698. [DOI] [PMC free article] [PubMed] [Google Scholar]
- Danion F, Schöner G, Latash ML, Li S, Scholz JP, Zatsiorsky VM. A mode hypothesis for finger interaction during multi-finger force-production tasks. Biol Cybern. 2003;88:91–98. doi: 10.1007/s00422-002-0336-z. [DOI] [PubMed] [Google Scholar]
- Enoka RM, Baudry S, Rudroff T, Farina D, Klass M, Duchateau J. Unraveling the neurophysiology of muscle fatigue. J Electromyogr Kinesiol. 2011;21:208–219. doi: 10.1016/j.jelekin.2010.10.006. [DOI] [PubMed] [Google Scholar]
- Enoka RM, Duchateau J. Muscle fatigue: what, why and how it influences muscle function. J Physiol. 2008;586:11–23. doi: 10.1113/jphysiol.2007.139477. [DOI] [PMC free article] [PubMed] [Google Scholar]
- Evans RK, Scoville CR, Ito MA, Mello RP. Upper body fatiguing exercise and shooting performance. Mil Med. 2003;168:451–456. [PubMed] [Google Scholar]
- Forestier N, Nougier V. The effects of muscular fatigue on the coordination of a multijoint movement in human. Neurosci Lett. 1998;252:187–190. doi: 10.1016/s0304-3940(98)00584-9. [DOI] [PubMed] [Google Scholar]
- Fuller JR, Lomond KV, Fung J, Côté JN. Posture-movement changes following repetitive motion-induced shoulder muscle fatigue. J Electromyogr Kinesiol. 2009;19:1043–1052. doi: 10.1016/j.jelekin.2008.10.009. [DOI] [PubMed] [Google Scholar]
- Gates DH, Dingwell JB. The effects of neuromuscular fatigue on task performance during repetitive goal-directed movements. Exp Brain Res. 2008;187:573–585. doi: 10.1007/s00221-008-1326-8. [DOI] [PMC free article] [PubMed] [Google Scholar]
- Gera G, Freitas S, Latash M, Monahan K, Schöner G, Scholz J. Motor abundance contributes to resolving multiple kinematic task constraints. Motor Control. 2010;14:83–115. doi: 10.1123/mcj.14.1.83. [DOI] [PMC free article] [PubMed] [Google Scholar]
- Gorniak SL, Duarte M, Latash ML. Do synergies improve accuracy? A study of speed-accuracy trade-offs during finger force production. Motor Control. 2008;12:151–172. doi: 10.1123/mcj.12.2.151. [DOI] [PMC free article] [PubMed] [Google Scholar]
- Granata KP, Marras WS, Davis KG. Variation in spinal load and trunk dynamics during repeated lifting exertions. Clin Biomech. 1999;14:367–375. doi: 10.1016/s0268-0033(99)00004-2. [DOI] [PubMed] [Google Scholar]
- Huffenus AF, Amarantini D, Forestier N. Effects of distal and proximal arm muscles fatigue on multi-joint movement organization. Exp Brain Res. 2006;170:438–447. doi: 10.1007/s00221-005-0227-3. [DOI] [PubMed] [Google Scholar]
- Kadefors R, Petersen I, Herberts P. Muscular reaction to welding work: an electromyographic investigation. Ergonomics. 1976;19:543–548. doi: 10.1080/00140137608931568. [DOI] [PubMed] [Google Scholar]
- Kaiser HF. The application of electronic computers to factor analysis. Psychol Meas. 1960;20:141–151. [Google Scholar]
- Kang N, Shinohara M, Zatsiorsky VM, Latash ML. Learning multi-finger synergies: an uncontrolled manifold analysis. Exp Brain Res. 2004;157:336–350. doi: 10.1007/s00221-004-1850-0. [DOI] [PubMed] [Google Scholar]
- Kruger ES, Hoopes JA, Cordial RJ, Li S. Error compensation during finger force production after one- and four-finger voluntarily fatiguing exercise. Exp Brain Res. 2007;181:461–468. doi: 10.1007/s00221-007-0942-z. [DOI] [PMC free article] [PubMed] [Google Scholar]
- Latash ML. Motor synergies and the equilibrium-point hypothesis. Motor Control. 2010;14:294–322. doi: 10.1123/mcj.14.3.294. [DOI] [PMC free article] [PubMed] [Google Scholar]
- Latash ML, Scholz JF, Danion F, Schöner G. Structure of motor variability in marginally redundant multifinger force production tasks. Exp Brain Res. 2001;141:153–165. doi: 10.1007/s002210100861. [DOI] [PubMed] [Google Scholar]
- Latash ML, Scholz JP, Schöner G. Toward a new theory of motor synergies. Motor Control. 2007;11:276–308. doi: 10.1123/mcj.11.3.276. [DOI] [PubMed] [Google Scholar]
- Latash ML, Scholz JP, Schöner G. Motor control strategies revealed in the structure of motor variability. Exerc Sport Sci Rev. 2002;30:26–31. doi: 10.1097/00003677-200201000-00006. [DOI] [PubMed] [Google Scholar]
- Li ZM, Latash ML, Zatsiorsky VM. Force sharing among fingers as a model of the redundancy problem. Exp Brain Res. 1998;119:276–286. doi: 10.1007/s002210050343. [DOI] [PubMed] [Google Scholar]
- Li ZM, Zatsiorsky VM, Latash ML, Bose NK. Anatomically and experimentally based neural networks modeling force coordination in static multi-finger tasks. Neurocomputing. 2002;47:259–275. [Google Scholar]
- Madeleine P, Madsen TM. Changes in the amount and structure of motor variability during a deboning process are associated with work experience and neck-shoulder discomfort. Appl Ergonom. 2009;40:887–894. doi: 10.1016/j.apergo.2008.12.006. [DOI] [PubMed] [Google Scholar]
- Madeleine P, Voigt M, Mathiassen SE. The size of cycle-to-cycle variability in biomechanical exposure among butchers performing a standardised cutting task. Ergonomics. 2008;51:1078–1095. doi: 10.1080/00140130801958659. [DOI] [PubMed] [Google Scholar]
- Missenard O, Mottet D, Perrey S. Muscular fatigue increases signal-dependent noise during isometric force production. Neurosci Lett. 2008;437:154–157. doi: 10.1016/j.neulet.2008.03.090. [DOI] [PubMed] [Google Scholar]
- Missenard O, Mottet D, Perrey S. Factors responsible for force steadiness impairment with fatigue. Muscle Nerve. 2009;40:1019–1032. doi: 10.1002/mus.21331. [DOI] [PubMed] [Google Scholar]
- Nubar Y, Contini R. A Minimal Principle in Biomechanics. Bull Math Biophys. 1961;23:377–391. [Google Scholar]
- Newell KM, Carlton LG. Force variability in isometric responses. J Exp Psychol: Hum Percept Perform. 1988;14:37–44. [PubMed] [Google Scholar]
- Olafsdottir H, Zhang W, Zatsiorsky VM, Latash ML. Age-related changes in multifinger synergies in accurate moment of force production tasks. J Appl Physiol. 2007;102:1490–1501. doi: 10.1152/japplphysiol.00966.2006. [DOI] [PMC free article] [PubMed] [Google Scholar]
- Park J, Sun Y, Zatsiorsky VM, Latash ML. Age-related changes in optimality and motor variability: an example of multifinger redundant tasks. Exp Brain Res. 2011a;212:1–18. doi: 10.1007/s00221-011-2692-1. [DOI] [PMC free article] [PubMed] [Google Scholar]
- Park J, Zatsiorsky VM, Latash ML. Optimality vs. variability: an example of multi-finger redundant tasks. Exp Brain Res. 2010;207:119–132. doi: 10.1007/s00221-010-2440-y. [DOI] [PMC free article] [PubMed] [Google Scholar]
- Park J, Zatsiorsky VM, Latash ML. Finger coordination under artificial changes in finger strength feedback: a study using analytical inverse optimization. J Mot Behav. 2011b;43:229–235. doi: 10.1080/00222895.2011.568990. [DOI] [PubMed] [Google Scholar]
- Prilutsky BI, Zatsiorsky VM. Optimization-based models of muscle coordination. Exerc Sport Sci Rev. 2002;30:32–38. doi: 10.1097/00003677-200201000-00007. [DOI] [PMC free article] [PubMed] [Google Scholar]
- Rosenbaum DA, Meulenbroek RJ, Vaughan J, Jansen C. Posture-based motion planning: applications to grasping. Psychol Rev. 2001;108:709–734. doi: 10.1037/0033-295x.108.4.709. [DOI] [PubMed] [Google Scholar]
- Scholz JP, Danion F, Latash ML, Schöner G. Understanding finger coordination through analysis of the structure of force variability. Biol Cybern. 2002;86:29–39. doi: 10.1007/s004220100279. [DOI] [PubMed] [Google Scholar]
- Scholz JP, Schöner G. The uncontrolled manifold concept: identifying control variables for a functional task. Exp Brain Res. 1999;126:289–306. doi: 10.1007/s002210050738. [DOI] [PubMed] [Google Scholar]
- Shapkova EY, Shapkova AL, Goodman SR, Zatsiorsky VM, Latash ML. Do synergies decrease force variability? A study of single-finger and multi-finger force production. Exp Brain Res. 2008;188:411–425. doi: 10.1007/s00221-008-1371-3. [DOI] [PMC free article] [PubMed] [Google Scholar]
- Shim JK, Latash ML, Zatsiorsky VM. Prehension synergies in three dimensions. J Neurophysiol. 2005;93:766–776. doi: 10.1152/jn.00764.2004. [DOI] [PMC free article] [PubMed] [Google Scholar]
- Singh T, Latash ML. Effects of muscle fatigue on multi-muscle synergies. Exp Brain Re. 2011 doi: 10.1007/s00221-011-2831-8. [DOI] [PMC free article] [PubMed] [Google Scholar]
- Singh T, S KMV, Zatsiorsky VM, Latash ML. Adaptive increase in force variance during fatigue in tasks with low redundancy. Neurosci Lett. 2010a;485:204–207. doi: 10.1016/j.neulet.2010.09.012. [DOI] [PMC free article] [PubMed] [Google Scholar]
- Singh T, Varadhan SK, Zatsiorsky VM, Latash ML. Fatigue and motor redundancy: adaptive increase in finger force variance in multi-finger tasks. J Neurophysiol. 2010b;103:2990–3000. doi: 10.1152/jn.00077.2010. [DOI] [PMC free article] [PubMed] [Google Scholar]
- Terekhov AV, Pesin YB, Niu X, Latash ML, Zatsiorsky VM. An analytical approach to the problem of inverse optimization with additive objective functions: an application to human prehension. J Math Biol. 2010;61:423–453. doi: 10.1007/s00285-009-0306-3. [DOI] [PMC free article] [PubMed] [Google Scholar]
- Terekhov AV, Zatsiorsky VM. Analytical and numerical analysis of inverse optimization problems: conditions of uniqueness and computational methods. Biol Cybern. 2011;104:75–93. doi: 10.1007/s00422-011-0421-2. [DOI] [PMC free article] [PubMed] [Google Scholar]
- Zatsiorsky VM, Gao F, Latash ML. Prehension synergies: effects of object geometry and prescribed torques. Exp Brain Res. 2003;148:77–87. doi: 10.1007/s00221-002-1278-3. [DOI] [PMC free article] [PubMed] [Google Scholar]
- Zatsiorsky VM, Gregory RW, Latash ML. Force and torque production in static multifinger prehension: biomechanics and control. I. Biomechanics. Biol Cybern. 2002a;87:50–57. doi: 10.1007/s00422-002-0321-6. [DOI] [PMC free article] [PubMed] [Google Scholar]
- Zatsiorsky VM, Gregory RW, Latash ML. Force and torque production in static multifinger prehension: biomechanics and control. II. Control. Biol Cybern. 2002b;87:40–49. doi: 10.1007/s00422-002-0320-7. [DOI] [PMC free article] [PubMed] [Google Scholar]
- Zatsiorsky VM, Latash ML. Prehension synergies. Exerc Sport Sci Rev. 2004;32:75–80. doi: 10.1097/00003677-200404000-00007. [DOI] [PMC free article] [PubMed] [Google Scholar]
- Zatsiorsky VM, Li ZM, Latash ML. Coordinated force production in multi-finger tasks: finger interaction and neural network modeling. Biol Cybern. 1998;79:139–150. doi: 10.1007/s004220050466. [DOI] [PubMed] [Google Scholar]
- Zhang W, Scholz JP, Zatsiorsky VM, Latash ML. What do synergies do? Effects of secondary constraints on multidigit synergies in accurate force-production tasks. J Neurophysiol. 2008;99:500–513. doi: 10.1152/jn.01029.2007. [DOI] [PMC free article] [PubMed] [Google Scholar]


