Abstract
Quantifying cartilage contact stress is paramount to understanding hip osteoarthritis. Discrete element analysis (DEA) is a computationally efficient method to estimate cartilage contact stresses. Previous applications of DEA have underestimated cartilage stresses and yielded unrealistic contact patterns because they assumed constant cartilage thickness and/or concentric joint geometry. The study objectives were to: 1) develop a DEA model of the hip joint with subject-specific bone and cartilage geometry, 2) validate the DEA model by comparing DEA predictions to those of a validated finite element analysis (FEA) model, and 3) verify both the DEA and FEA models with a linear-elastic boundary value problem. Springs representing cartilage in the DEA model were given lengths equivalent to the sum of acetabular and femoral cartilage thickness and joint space in the FEA model. Material properties and boundary/loading conditions were equivalent. Walking, descending, and ascending stairs were simulated. Solution times for DEA and FEA models were ~7 seconds and ~65 minutes, respectively. Irregular, complex contact patterns predicted by DEA were in excellent agreement with FEA. DEA contact areas were 7.5%, 9.7% and 3.7% less than FEA for walking, descending stairs, and ascending stairs, respectively. DEA models predicted higher peak contact stresses (9.8–13.6 MPa) and average contact stresses (3.0–3.7 MPa) than FEA (6.2–9.8 and 2.0–2.5 MPa, respectively). DEA overestimated stresses due to the absence of the Poisson’s effect and a direct contact interface between cartilage layers. Nevertheless, DEA predicted realistic contact patterns when subject-specific bone geometry and cartilage thickness were used. This DEA method may have application as an alternative to FEA for pre-operative planning of joint-preserving surgery such as acetabular reorientation during peri-acetabular osteotomy.
Keywords: Hip, cartilage, cartilage mechanics, contact stress, discrete element analysis, finite element analysis, computational modeling
2. INTRODUCTION
Chronic exposure of elevated cartilage contact stresses has been shown to predict the onset and progression of osteoarthritis (OA) in the hip (Harris, 1986; Maxian et al., 1995; Mavcic et al., 2008). Thus, methods to quantify hip joint cartilage contact stresses are clinically relevant and necessary to improve our understanding of hip OA. For example, the magnitude and distribution of cartilage contact stress could be used to quantify mechanical differences between normal and pathologic hips, generate preoperative surgical plans, and predict long-term prognosis following surgical treatment. However, direct measurement of cartilage contact stresses and contact area in-vivo is currently not possible.
Computational modeling is an alternative to direct in-vivo measurement of cartilage contact stresses. Both finite element analysis (FEA) (Brown and DiGioia, 1984; Anderson et al., 2005; Bachtar et al., 2006; Chegini et al., 2009; Gu et al., 2011; Henak et al., 2011) and discrete element analysis (DEA) (Genda et al., 2001; Tsumura et al., 2005; Yoshida et al., 2006; Armiger et al., 2009; Chao et al., 2010) have been used to estimate hip cartilage contact stresses. FEA models of the hip can predict cartilage contact stresses consistent with experimental data when subject-specific bone and cartilage geometry are used and bones are modeled as deformable (Anderson et al., 2008; Henak et al., 2011). However, the construction and analysis of FEA models are time-intensive and computationally expensive. Thus, many published FEA models simplify the complex geometry of the hip joint by assuming spherical geometry (Bachtar et al., 2006; Chegini et al., 2009) or constant cartilage thickness (Gu et al., 2011). Models that assume ideal geometry underestimate peak cartilage contact stresses by 60%, average cartilage contact stresses by 21%, and overestimate contact area by 25% (Anderson et al., 2010).
DEA (i.e. rigid body spring method) is a computationally efficient method for calculating cartilage stresses. Using DEA, bones are modeled as rigid bodies and cartilage is represented as an array of springs (Li et al., 1997; Volokh et al., 2007; Chao et al., 2010). Cartilage contact stress is quantified based on spring deformation. Previous DEA models have assumed concentric hip joint geometry and constant cartilage thickness (Genda et al., 1995; Genda et al., 2001; Armand et al., 2005; Yoshida et al., 2006) or cartilage thickness equal to the distance between the acetabulum and femoral head (Tsumura et al., 2005). These assumptions for DEA underestimate cartilage stress and predict unrealistic, simplified contact patterns (Genda et al., 2001; Armand et al., 2005; Yoshida et al., 2006; Armiger et al., 2009) when compared to experimentally measured contact stress magnitudes and complex contact patterns (Brown and Shaw, 1983; Afoke et al., 1987; von Eisenhart et al., 1999). However, it is possible that DEA could provide realistic predictions of hip cartilage contact stress if subject-specific bone and cartilage thickness were incorporated. The study objectives were to: 1) develop a DEA model of the hip joint with subject-specific bone and cartilage geometry, 2) validate the DEA model by comparing DEA predictions to those of a validated FEA model, and 3) verify both the DEA and FEA models with a linear-elastic boundary value problem.
3. METHODS
High resolution CT image data (512×512, 320 mm field of view, in-plane resolution 0.625×0.625 mm, 0.6 mm slice thickness) of a 25 year old male cadaveric hip provided baseline geometry (cortical bone and cartilage surfaces) for both the DEA and previously validated subject-specific FEA model (Anderson et al., 2008).
3.1 Discrete Element Analysis Implementation
A custom C++ program was written to perform DEA. A Newton solver was used to determine the position of the femur such that the sum of the spring forces balanced the applied force. As the DEA method requires rigid bones, both the pelvis and femur were modeled as rigid, triangulated surfaces with position dependent cartilage thickness values assigned to each node. Nodal cartilage thicknesses were computed as the distance between cartilage and cortical bone surfaces projected along the surface normal vector. Cartilage was represented by a distribution of compressive springs generated in the region of the femoral head underlying the acetabulum in each loading scenario. One end of the spring was attached at the center of each triangle on the acetabulum and the other was determined by projecting the point along the acetabular surface normal onto the femoral head. The initial spring length was calculated as a distance between starting and projection points, and was defined as the sum of acetabular and femoral cartilage thickness and gap distance at the corresponding location of the FEA model (Fig. 1). Since the spring attachment at the femur did not necessarily terminate directly at a femur surface node, femoral cartilage thicknesses were interpolated from neighboring nodes. The springs resisted compressive forces (spring length less than the sum of acetabular and femoral cartilage thickness) but not tensile forces (Fig. 1). The force generated by compression of an individual spring was calculated according to Hooke’s law:
| (1) |
where Δxi is the spring compression distance, ki is spring stiffness, and ni is the local surface normal. The spring stiffness ki depended on Young’s modulus and Poisson’s ratio (E = 11.85 MPa, v = 0.45) (Genda et al., 2001; Yoshida et al., 2006):
| (2) |
Figure 1.
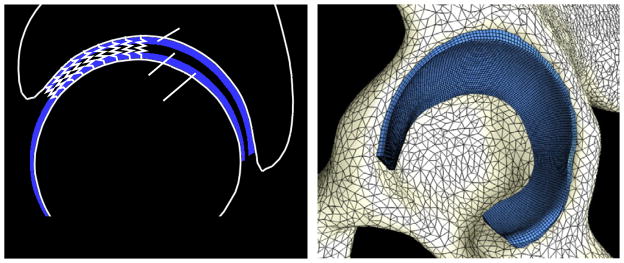
Sagittal view of DEA representation. Bones were rigid and cartilage was represented by an array of springs (left). 3D FEA model; triangular shell and hexahedral elements defined cortical bone and cartilage, respectively (right).
Here, Ai is a triangular element area and hi is the sum of acetabular and femoral cartilage thicknesses. The spring forces (Eq. (1)) that balance the applied force are a nonlinear function of femur position. Newton’s method determined the position of the femur so that spring forces balanced the applied force. The initial condition was the initial position of the femur and pelvis, positioned according to in-vivo kinematic data (Bergmann et al., 2001). Newton’s method was used to calculate the root of the residual function, defined as the difference between the user input force and the sum of the spring forces. The updated position of the femur was calculated at each Newton-iteration and projection points of springs on the femoral head were re-generated following each update to account for the new position of the femur. To maintain the appropriate kinematic position, rotation of the femur was restricted, and therefore, moments were not balanced. Contact stresses were calculated from the spring force and triangular element area where each spring was attached. A convergence study determined the number of springs necessary.
3.2 Finite Element Analysis
Triangular shell elements defined bone geometry (Anderson et al., 2008), and were assumed rigid to correspond with DEA model assumption. Cartilage was represented using hexahedral elements as a neo-Hookean hyperelastic material, and the shear modulus, G, and bulk modulus, K, were assigned based on the Young’s modulus E and Poisson’s ratio ν used in the DEA analysis:
| (3) |
| (4) |
FEA models were analyzed using NIKE3D (Puso et al., 2007).
3.3 Loading and Boundary Conditions
The pelvis was assumed rigid and fixed in space. The femoral head was modeled as rigid but free to translate in all three axes (rotations constrained). Loading conditions and geometric orientation of the femur relative to the pelvis were based on published data for in-vivo hip loads (Bergmann et al., 2001). Walking (W), descending stairs (DS), and ascending stairs (AS) for the average subject in (Bergmann et al., 2001) were analyzed; 800 N bodyweight was assumed. Force was applied to the geometric center of the femoral head, determined as the center of a sphere fit to the femoral head using a least squares optimization.
3.4 Data Analysis
To facilitate DEA and FEA comparisons, DEA nodal results (defined on triangulated bone surfaces) were projected onto the articulating (quadrilateral) surface of the FEA cartilage mesh and interpolated. Interpolation was accomplished by locating the closest point projection of each quadrilateral node onto the triangular bone surface. The value at the projection point was interpolated from nodal values using element shape functions. Predictions of peak contact stress, average contact stress, and contact area were compared descriptively between DEA and FEA to validate the DEA model, where validation was as the process of ensuring that a computational model accurately represents the physics of the real world system (Anderson et al., 2007; Henninger et al., 2010). Cartilage contact stress was sampled on the surface of the acetabular cartilage, and average contact stress was calculated for each loading scenario considering all articulating nodes in contact (i.e. nodes with a positive contact stress). Cartilage contact area was calculated by summing the surface area of each element in the acetabular cartilage that was in contact with the femoral cartilage. The acetabular cartilage was divided into anterior, superior, and posterior regions, where each region contained an equivalent number of elements (Athanasiou et al., 1994). Both DEA and FEA models were preprocessed using PreView and post-processed using PostView (www.febio.org).
3.5 Model Verification
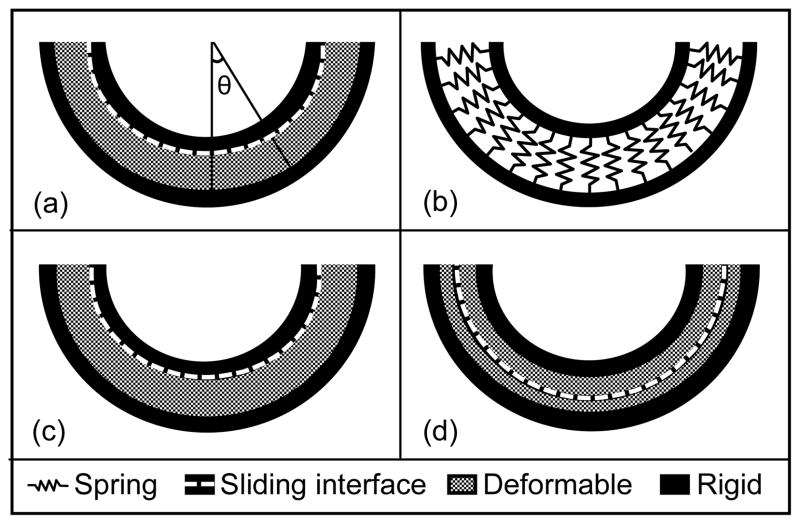
A linear-elastic boundary value problem (Fig. 2) served as verification of the DEA and FEA models, where verification was defined as determining that a computational model accurately represents the underlying mathematical model and its solution (American Society of Mechanical Engineers, 2006; Anderson et al., 2007; Henninger et al., 2010). Specifically, contact stress predictions were compared to the simplified elasticity solution of an elastic sphere supported bilaterally by concentric rigid spheres (Bartel et al., 1985; Li et al., 1997). The model dimensions, constitutive models and loading conditions were comparable to physiologic hip models. Rigid hemispheres radii were 20 and 24 mm, and the elastic sphere conformed to the rigid backings and was 4 mm thick, similar to the thickness of two cartilage layers (Macirowski et al., 1994; Menschik, 1997; Kohnlein et al., 2009). The simplified elasticity solution described displacement as the differential equations of equilibrium in spherical coordinates and assumed displacement was confined to the radial direction (Bartel et al., 1985).
Figure 2.
Schematic of verification problem under 2000 N load. Geometry was concentric: inner rigid material r = 20 mm, outer rigid material r = 24 mm, 4 mm thick cartilage between rigid materials. (a) Analytical solution modeled a single cartilage layer. Contact stress was calculated as a function of theta, the angle from vertical. (b) A single cartilage layer was represented by springs in DEA. (c) One layer FEA model. (d) Two layer FEA model.
To model the equivalent using FEA, 4 mm thick cartilage was represented with hexahedral elements as a single layer (10 through the thickness, total of 108,000 elements). The outer surface cartilage nodes were fixed and the smaller rigid sphere was represented by hexahedral elements (2 elements through thickness, total of 21,600 elements). Cartilage was a neo-Hookean, hyperelastic material (E = 11.85 MPa, ν = 0.45, EQ 3,4) and a frictionless sliding interface was defined between the smaller rigid hemisphere and cartilage layer. An additional FEA model was generated with a frictionless sliding interface between two cartilage layers. Here, cartilage was modeled as two separate materials using hexahedral elements (2 mm thickness each, 5 elements through thickness, total of 54,000 elements for each cartilage layer). Cartilage layers were tied to rigid bone backings. All FEA models utilized quarter symmetry and were analyzed in NIKE3D (Puso et al., 2007).
A DEA simulation was analyzed with rigid hemispheres (r = 20 mm, 24 mm) and constant cartilage thickness of 4 mm. Spring stiffness was determined following material properties equivalent to the analytical solution and FEA (E = 11.85 MPa, ν = 0.45). A convergence study determined the number of springs required. A range of forces (100 N – 4000 N) was applied through the smaller rigid hemisphere to compare predictions across loads in both FEA and DEA models.
4. RESULTS
4.1 Contact Area
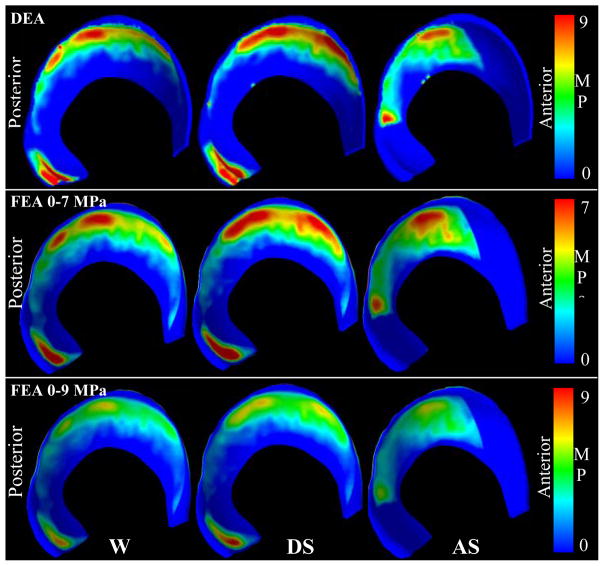
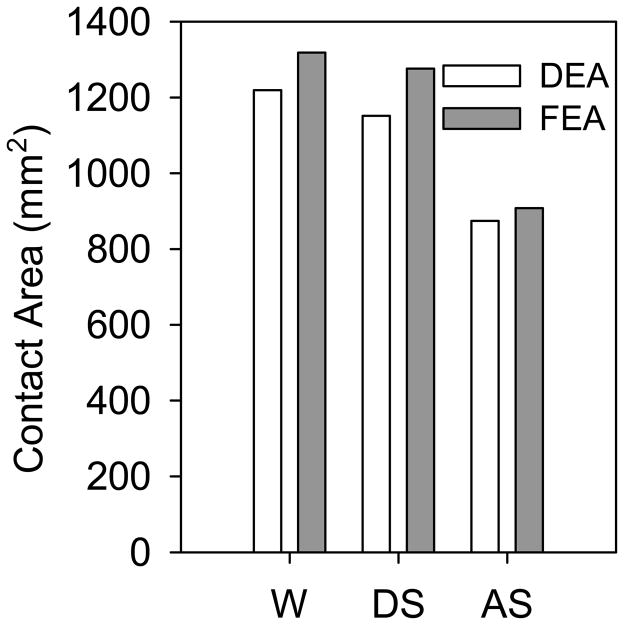
DEA and FEA contact patterns corresponded well and predicted irregular, complex contact for all three loading scenarios (Fig. 3). For walking and descending stairs, both methods predicted contact predominantly in the superolateral region. For ascending stairs, contact was predicted posteriorly (Fig. 3). DEA contact areas were 7.5%, 9.7% and 3.7% less than FEA contact areas for walking, descending stairs, and ascending stairs, respectively (Fig. 4). Regional contact areas (anterior, superior, posterior) were consistently reduced in DEA compared with FEA and averaged 71.1±16.7, 85.8±16.7, and 26.4±1.5 mm2 less than FEA in walking, descending stairs, and ascending stairs, respectively.
Figure 3.
Contact stress patterns corresponded well between DEA and FEA for walking (W), descending stairs (DS), and ascending stairs (AS). The top/middle rows were scaled differently to show similarities in contact pattern. The bottom row shows the FEA results scaled the same as the DEA results (top row), indicating that DEA predicted higher contact stresses than FEA.
Figure 4.
DEA contact areas were comparable to FEA predictions for walking (W), descending stairs (DS), and ascending stairs (AS).
4.2 Contact Stress
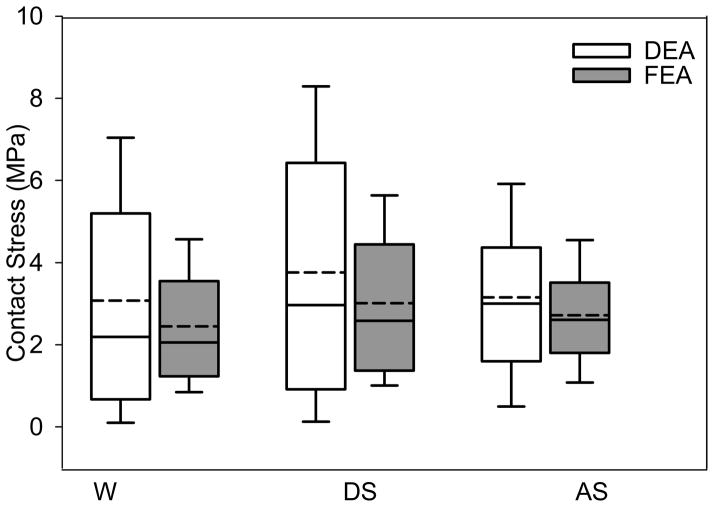
DEA contact stress distributions were similar to FEA, but DEA predictions exhibited greater variation, especially at higher magnitudes of contact stress (Fig. 5). Mean and median contact stresses averaged 43% and 44% higher in DEA, respectively. Peak contact stresses for DEA and FEA ranged from 9.8–13.6 and 6.2–9.8 MPa, respectively. Average contact stresses for DEA and FEA ranged from 3.0–3.7 and 2.0–2.5 MPa, respectively.
Figure 5.
Box plots of cartilage contact stress (all nodes in contact on the articulating surface) for the DEA and FEA models under conditions of walking (W), descending stairs (DS), and ascending stairs (AS), indicating the 25th and 75th percentiles with error bars at the 5th and 95th percentiles. Contact stresses predicted by DEA were elevated and more variable, especially at higher values. The mean (solid lines) and median contact stresses (dashed lines) were higher in DEA in all loading conditions.
4.3 Verification Results
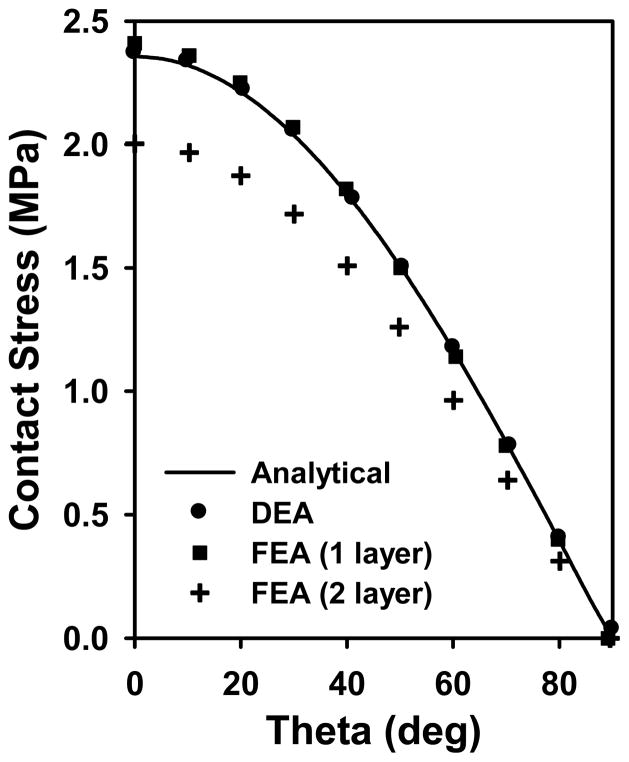
At a force of 2000 N, DEA and FEA models that analyzed a single layer of cartilage predicted peak contact stress 0.42% and 2.11% higher than the analytical solution, respectively (Fig. 6). Contact stress predicted by the FEA model with two layers of cartilage was reduced compared with the analytical solution and FEA model that analyzed a single layer of cartilage. The difference in contact stresses was largest at the location of maximum stress (θ = 0), where DEA predicted a contact stress 18.5% greater than the 2 layer FEA model. The mean and median contact stresses were 17.1% and 15.7% higher in DEA than the 2 layer FEA model. Results were consistent over forces varying from 100 – 4000 N, a range that encompasses loads experienced in-vivo (Bergmann et al., 2001).
Figure 6.
Comparisons of contact stresses predicted by FEA and DEA to an analytical solution. Contact stress predictions were consistent between analytical, DEA, FEA (1 layer) but reduced in FEA (2 layer). In the 2 layer FEA model, the difference in contact stresses was largest at the location of maximum contact stress (θ = 0) where DEA predicted a contact stress higher than the two layer FEA model.
4.4 Convergence and Computation Time
The DEA convergence study demonstrated that ~20,000 and ~5,000 springs were required to achieve <5% change in average/peak contact stress and contact area upon further refinement in the subject-specific hip models and spherical verification model, respectively. The solution time for each DEA model was ~7 seconds (IBM ThinkPad Intel Core 2 Duo cpu @2.80 GHz, 3 GB RAM). FEA models required an average solution time of ~65 minutes on a computing cluster (SUN FIRE X2270 2 cpu/8 core Intel Xeon X5550 @ 2.67GHz (16 cores with HT) 48GB of RAM 1GB network interface).
5. DISCUSSION
The results of this study demonstrated that when subject-specific bone and cartilage geometry are included in DEA, cartilage contact stress distributions in the hip are consistent with a validated FEA model. Furthermore, DEA was able to provide general trends for contact stress magnitudes and yield information about cartilage contact stress profiles. However, we found that DEA could not reliably predict the true magnitude of contact stress at specific locations in the hip joint. Despite this limitation, DEA could be a useful tool for comparative studies (normal vs. pathologic or pre- vs. post-op), where the difference between groups, rather than the true magnitude of contact stress, is of primary interest. DEA could also be useful for applications where contact area or contact stress profiles are important (pre-operative planning or intra-operative surgical tools).
The average increase of 43% and 44% in mean and median cartilage contact stresses (Fig. 5) in DEA compared to FEA may be partially explained by differences in the model representations. While FEA models have two deformable cartilage parts in contact, DEA represents cartilage as a single part, where one spring is attached to bone on each end. The reduction in contact stresses when two deformable cartilage surfaces contact (i.e., FEA) compared to springs compressed by rigid materials on either side (i.e., DEA) was demonstrated in the verification problem, where the difference in cartilage representation and contact definition resulted in ~16% reduction in average and median contact stresses in a perfectly concentric model (Fig. 6). Although this does not account for the magnitude of difference in the hip model (~44%), the incongruency in the hip model likely exacerbates any differences due to representations of cartilage and the contact interface. Although the femoral head was free to translate in all directions, the DEA models did not model deformation in the lateral direction of cartilage, and Poisson’s Effect was effectively ignored. Therefore, in this way, the true deformation of cartilage is not modeled in DEA. Conversely, FEA models can model the lateral response of cartilage under compression, which effectively reduces contact stresses compared to DEA.
Overall, the contact stress distributions corresponded well between DEA and FEA. This is due to two factors. First, the initial positions of bone and cartilage were identical in FEA and DEA. Second, subject-specific cartilage thickness was accounted for in DEA by assigning spring lengths equivalent to cartilage thickness, based directly on the FEA model. Therefore, despite differences in contact stress magnitudes, DEA predicted contact stress distributions that corresponded very well with FEA. In fact, contact areas were within an average of 7% of FEA. One explanation for this small difference in contact area is as follows: For the FEA model, the total area available for cartilage contact was simply the area of the cartilage-cartilage contact interface. However, in the DEA models, a true cartilage-cartilage contact interface did not exist since a single spring represented both layers of cartilage. For DEA, the total available contact area was the area of the acetabular cartilage-bone interface in the FEA model (the acetabular cortical bone served as the spring origin). Regardless, the difference in available contact area between DEA and FEA was only 15%. Thus, it is the kinematic position and contact interface geometry (i.e. cartilage thickness) that primarily dictates the contact stress distribution and area; differences in the approach utilized to model cartilage deformation and manner in which contact area is calculated is less important.
The magnitude of the difference in contact stress and area between FEA and DEA varied with respect to the loading scenario analyzed. For example, in the ascending stairs scenario, DEA cartilage contact stresses were ~20% higher, compared to the ~40% DEA versus FEA difference in the descending stairs and walking models. The differences in DEA-FEA agreement among the loading scenarios likely resulted from the inability of DEA to model the Poisson’s Effect. This becomes apparent in scenarios such as descending stairs and walking where contact stresses had a high concentration of contact stresses in the posteroinferior region of the acetabular cartilage (Fig. 3). In contrast, in the ascending stairs scenario, there was no contact in that region and thus less bias towards higher stress magnitudes overall.
The complex spatial distribution of contact stress and the magnitude of stresses predicted in our study are in contrast with the results of previously reported DEA models of the hip. Specifically, contact stress patterns in our study did not follow the typical unicentric, equally-distributed contact patterns seen in previously published DEA studies. Most prior studies used 2D radiographic measures to define geometry of the bone and cartilage and assumed a spherical articulating surface (Genda et al., 1995; Genda et al., 2001; Armand et al., 2005; Yoshida et al., 2006). A few studies have improved the implementation of DEA by using CT data to model the cartilage-bone interfaces (Tsumura et al., 2005; Armiger et al., 2009). However, CT images did not visualize cartilage in these prior studies. Thus, the articulating surface was assumed to be spherical (Armiger et al., 2009) or represented by cartilage thickness equal to the joint space (Tsumura et al., 2005). The hip joint is not perfectly spherical (Eckstein et al., 1997; Menschik, 1997; Kohnlein et al., 2009) and cartilage thickness varies throughout the joint (Eckstein et al., 1997; Shepherd and Seedhom, 1999). Accordingly, FEA and DEA models that simplify the cartilage contact interface can be expected to underestimate cartilage contact stresses and overestimate contact area (Anderson et al., 2010; Gu et al., 2011). To obtain cartilage contact stress predictions that are consistent with in-vitro studies (Brown and Shaw, 1983; Afoke et al., 1987; Anderson et al., 2008), it is necessary to include subject-specific bone geometry and cartilage thickness in computational models of the hip.
There are a number of limitations that deserve discussion. The first is the assumption that bones are rigid. This is a limitation that is inherent in the DEA method. In an FEA model, it has been previously shown that the rigid bone assumption increases predicted cartilage contact stresses (Anderson et al., 2010). However, in the present study, rigid bones were assumed for both FEA and DEA; error as a result of this assumption would be consistent between modeling approaches. Another inherent limitation of the DEA method is the representation of two layers of cartilage as a single spring. This simplified representation of cartilage in DEA limits results to a single force value for each spring, and therefore predicts a single value of stress throughout the cartilage thickness, which will be higher than FEA models that represent cartilage with two parts in contact. The difference in model representations of cartilage contact complicates the method by which results were compared between DEA and FEA. In DEA studies, stresses would typically be calculated at the bone surface where springs are attached. Since the cartilage geometry is often unknown, and there is no cartilage surface or mesh available, calculating stress at the bone interface is usually the only option. In our study, contact stress was determined at the articulating cartilage surface since the cartilage surface geometry was available from the FEA model. In contrast, FEA models predict stresses throughout the cartilage thickness and are not limited to the primary result of a force value through the thickness of cartilage. Another potential limitation in our study is the difference in material models between DEA and FEA. In our study, the DEA model employed a linear-elastic spring model whereas the FEA model represented cartilage materials as neo-Hookean. Cartilage was not modeled as linear in FEA because it is not rotationally invariant (spurious strains are induced by rigid body rotations) and would therefore provide an inaccurate solution. This is not a problem with DEA because it models spring deformation as a one dimensional strain problem. Thus, although material models are not consistent between modeling methods, the authors believe the use of a Neo-Hookean cartilage material in FEA and linear elasticity for DEA was warranted. Finally, model predictions and potential extensions of this work should be interpreted with caution considering the limited number of simulations that were performed on a single cadaveric hip.
To our knowledge, this is the first implementation of a subject-specific DEA model of the hip. When subject-specific bone geometry and cartilage thickness were included in the DEA model, realistic contact stress patterns were predicted. Although advanced imaging, such as CT or MR arthrography, may not be available to create subject-specific reconstructions of the hip that include detailed bone geometry and cartilage thickness, it is important to recognize that DEA models using simplified contact interface geometry will underestimate cartilage contact stresses, overestimate contact areas and predict unrealistic cartilage contact stress patterns.
Assuming detailed information is available for bone and cartilage, the new DEA algorithm presented herein offers a computationally efficient alternative to FEA modeling for the prediction of contact stresses. Considering the differences in contact area predictions were small, DEA may be utilized in modeling studies where the contact area and distribution of cartilage contact stresses, and not the absolute magnitude of contact stress, is of primary importance. In particular, DEA may be clinically useful for applications that require a large number of simulations or where time is limited. For example, our DEA modeling approach could be used to generate pre-operative plans, based on an optimization routine to minimize cartilage contact stress, or for intra-operative feedback systems in the treatment of hip pathologies such as dysplasia or femoroacetabular impingement.
Acknowledgments
Financial support from NIH R01AR053344 and R01GM083925 is gratefully acknowledged.
Footnotes
7. CONFLICT OF INTEREST STATEMENT
The authors do not have any financial and personal relationships with other people or organizations that could inappropriately influence (bias) the work.
Publisher's Disclaimer: This is a PDF file of an unedited manuscript that has been accepted for publication. As a service to our customers we are providing this early version of the manuscript. The manuscript will undergo copyediting, typesetting, and review of the resulting proof before it is published in its final citable form. Please note that during the production process errors may be discovered which could affect the content, and all legal disclaimers that apply to the journal pertain.
Contributor Information
Christine L. Abraham, Harold K. Dunn Orthopaedic Research Laboratory, Department of Orthopaedics, Department of Bioengineering, University of Utah, Salt Lake City, UT 84108.
Steve A. Maas, Department of Bioengineering, and Scientific Computing and Imaging Institute, University of Utah, Salt Lake City, UT 84102.
Jeffrey A. Weiss, Departments of Bioengineering and Orthopedics, and Scientific Computing and Imaging Institute, University of Utah, Salt Lake City, UT 84102, USA.
Benjamin J. Ellis, Musculoskeletal Research Laboratories, Department of Bioengineering, and Scientific Computing and Imaging Institute, University of Utah, Salt Lake City, UT 84102, USA.
Christopher L. Peters, Department of Orthopaedics, University of Utah School of Medicine, Salt Lake City, UT 84108, USA.
Andrew E. Anderson, Harold K. Dunn Orthopaedic Research Laboratory, Department of Orthopaedics, Department of Bioengineering, Scientific Computing and Imaging Institute, Department of Physical Therapy, University of Utah School of Medicine, Salt Lake City, UT 84108, 1 (801) 414-4119 USA.
References
- Afoke NY, Byers PD, Hutton WC. Contact pressures in the human hip joint. J Bone Joint Surg Br. 1987;69(4):536–41. doi: 10.1302/0301-620X.69B4.3611154. [DOI] [PubMed] [Google Scholar]
- Anderson AE, Ellis BJ, Maas SA, Peters CL, Weiss JA. Validation of finite element predictions of cartilage contact pressure in the human hip joint. J Biomech Eng. 2008;130(5):051008. doi: 10.1115/1.2953472. [DOI] [PMC free article] [PubMed] [Google Scholar]
- Anderson AE, Ellis BJ, Maas SA, Weiss JA. Effects of idealized joint geometry on finite element predictions of cartilage contact stresses in the hip. J Biomech. 2010;43(7):1351–7. doi: 10.1016/j.jbiomech.2010.01.010. [DOI] [PMC free article] [PubMed] [Google Scholar]
- Anderson AE, Ellis BJ, Weiss JA. Verification, validation and sensitivity studies in computational biomechanics. Comput Methods Biomech Biomed Engin. 2007;10(3):171–84. doi: 10.1080/10255840601160484. [DOI] [PMC free article] [PubMed] [Google Scholar]
- Anderson AE, Peters CL, Tuttle BD, Weiss JA. Subject-specific finite element model of the pelvis: Development, validation and sensitivity studies. J Biomech Eng. 2005;127(3):364–73. doi: 10.1115/1.1894148. [DOI] [PubMed] [Google Scholar]
- Armand M, Lepisto J, Tallroth K, Elias J, Chao E. Outcome of periacetabular osteotomy: Joint contact pressure calculation using standing ap radiographs, 12 patients followed for average 2 years. Acta Orthop. 2005;76(3):303–13. [PMC free article] [PubMed] [Google Scholar]
- Armiger RS, Armand M, Tallroth K, Lepisto J, Mears SC. Three-dimensional mechanical evaluation of joint contact pressure in 12 periacetabular osteotomy patients with 10-year follow-up. Acta Orthop. 2009;80(2):155–61. doi: 10.3109/17453670902947390. [DOI] [PMC free article] [PubMed] [Google Scholar]
- Athanasiou KA, Agarwal A, Dzida FJ. Comparative study of the intrinsic mechanical properties of the human acetabular and femoral head cartilage. Journal of orthopaedic research: official publication of the Orthopaedic Research Society. 1994;12(3):340–9. doi: 10.1002/jor.1100120306. [DOI] [PubMed] [Google Scholar]
- Bachtar F, Chen X, Hisada T. Finite element contact analysis of the hip joint. Med Biol Eng Comput. 2006;44(8):643–51. doi: 10.1007/s11517-006-0074-9. [DOI] [PubMed] [Google Scholar]
- Bartel DL, Burstein AH, Toda MD, Edwards DL. The effect of conformity and plastic thickness on contact stresses in metal-backed plastic implants. J Biomech Eng. 1985;107(3):193–9. doi: 10.1115/1.3138543. [DOI] [PubMed] [Google Scholar]
- Bergmann G, Deuretzbacher G, Heller M, Graichen F, Rohlmann A, Strauss J, Duda GN. Hip contact forces and gait patterns from routine activities. J Biomech. 2001;34(7):859–71. doi: 10.1016/s0021-9290(01)00040-9. [DOI] [PubMed] [Google Scholar]
- Brown TD, DiGioia AM., 3rd A contact-coupled finite element analysis of the natural adult hip. J Biomech. 1984;17(6):437–48. doi: 10.1016/0021-9290(84)90035-6. [DOI] [PubMed] [Google Scholar]
- Brown TD, Shaw DT. In vitro contact stress distributions in the natural human hip. J Biomech. 1983;16(6):373–84. doi: 10.1016/0021-9290(83)90071-4. [DOI] [PubMed] [Google Scholar]
- Chao EY, Volokh KY, Yoshida H, Shiba N, Ide T. Discrete element analysis in musculoskeletal biomechanics. Mol Cell Biomech. 2010;7(3):175–92. [PubMed] [Google Scholar]
- Chegini S, Beck M, Ferguson SJ. The effects of impingement and dysplasia on stress distributions in the hip joint during sitting and walking: A finite element analysis. J Orthop Res. 2009;27(2):195–201. doi: 10.1002/jor.20747. [DOI] [PubMed] [Google Scholar]
- Eckstein F, von Eisenhart-Rothe R, Landgraf J, Adam C, Loehe F, Muller-Gerbl M, Putz R. Quantitative analysis of incongruity, contact areas and cartilage thickness in the human hip joint. Acta Anat (Basel) 1997;158(3):192–204. doi: 10.1159/000147930. [DOI] [PubMed] [Google Scholar]
- Genda E, Iwasaki N, Li G, MacWilliams BA, Barrance PJ, Chao EY. Normal hip joint contact pressure distribution in single-leg standing--effect of gender and anatomic parameters. J Biomech. 2001;34(7):895–905. doi: 10.1016/s0021-9290(01)00041-0. [DOI] [PubMed] [Google Scholar]
- Genda E, Konishi N, Hasegawa Y, Miura T. A computer simulation study of normal and abnormal hip joint contact pressure. Arch Orthop Trauma Surg. 1995;114(4):202–6. doi: 10.1007/BF00444263. [DOI] [PubMed] [Google Scholar]
- Gu DY, Hu F, Wei JH, Dai KR, Chen YZ. Contributions of non-spherical hip joint cartilage surface to hip joint contact stress. Conf Proc IEEE Eng Med Biol Soc. 2011;2011:8166–9. doi: 10.1109/IEMBS.2011.6092014. [DOI] [PubMed] [Google Scholar]
- American Society of Mechanical Engineers. Guide for verification and validation in computational solid dynamics. 2006. [Google Scholar]
- Harris WH. Etiology of osteoarthritis of the hip. Clin Orthop Relat Res. 1986;(213):20–33. [PubMed] [Google Scholar]
- Henak CR, Ellis BJ, Harris MD, Anderson AE, Peters CL, Weiss JA. Role of the acetabular labrum in load support across the hip joint. J Biomech. 2011;44(12):2201–6. doi: 10.1016/j.jbiomech.2011.06.011. [DOI] [PMC free article] [PubMed] [Google Scholar]
- Henninger HB, Reese SP, Anderson AE, Weiss JA. Validation of computational models in biomechanics. Proc Inst Mech Eng H. 2010;224(7):801–12. doi: 10.1243/09544119JEIM649. [DOI] [PMC free article] [PubMed] [Google Scholar]
- Kohnlein W, Ganz R, Impellizzeri FM, Leunig M. Acetabular morphology: Implications for joint-preserving surgery. Clin Orthop Relat Res. 2009;467(3):682–91. doi: 10.1007/s11999-008-0682-9. [DOI] [PMC free article] [PubMed] [Google Scholar]
- Li G, Sakamoto M, Chao EY. A comparison of different methods in predicting static pressure distribution in articulating joints. J Biomech. 1997;30(6):635–8. doi: 10.1016/s0021-9290(97)00009-2. [DOI] [PubMed] [Google Scholar]
- Macirowski T, Tepic S, Mann RW. Cartilage stresses in the human hip joint. J Biomech Eng. 1994;116(1):10–8. doi: 10.1115/1.2895693. [DOI] [PubMed] [Google Scholar]
- Mavcic B, Iglic A, Kralj-Iglic V, Brand RA, Vengust R. Cumulative hip contact stress predicts osteoarthritis in ddh. Clin Orthop Relat Res. 2008;466(4):884–91. doi: 10.1007/s11999-008-0145-3. [DOI] [PMC free article] [PubMed] [Google Scholar]
- Maxian TA, Brown TD, Weinstein SL. Chronic stress tolerance levels for human articular cartilage: Two nonuniform contact models applied to long-term follow-up of cdh. J Biomech. 1995;28(2):159–66. doi: 10.1016/0021-9290(94)00054-8. [DOI] [PubMed] [Google Scholar]
- Menschik F. The hip joint as a conchoid shape. J Biomech. 1997;30(9):971–3. doi: 10.1016/s0021-9290(97)00051-1. [DOI] [PubMed] [Google Scholar]
- Puso MA, Maker BN, Ferencz RM, Halloquist JO. User’s manual. 2007. Nike3d: A nonlinear, implicit, three-dimensional finite element code for solid and structural mechanics. [Google Scholar]
- Shepherd DE, Seedhom BB. Thickness of human articular cartilage in joints of the lower limb. Ann Rheum Dis. 1999;58(1):27–34. doi: 10.1136/ard.58.1.27. [DOI] [PMC free article] [PubMed] [Google Scholar]
- Tsumura H, Kaku N, Ikeda S, Torisu T. A computer simulation of rotational acetabular osteotomy for dysplastic hip joint: Does the optimal transposition of the acetabular fragment exist? J Orthop Sci. 2005;10(2):145–51. doi: 10.1007/s00776-004-0866-4. [DOI] [PubMed] [Google Scholar]
- Volokh KY, Chao EY, Armand M. On foundations of discrete element analysis of contact in diarthrodial joints. Mol Cell Biomech. 2007;4(2):67–73. [PMC free article] [PubMed] [Google Scholar]
- von Eisenhart R, Adam C, Steinlechner M, Muller-Gerbl M, Eckstein F. Quantitative determination of joint incongruity and pressure distribution during simulated gait and cartilage thickness in the human hip joint. Journal of orthopaedic research: official publication of the Orthopaedic Research Society. 1999;17(4):532–9. doi: 10.1002/jor.1100170411. [DOI] [PubMed] [Google Scholar]
- Yoshida H, Faust A, Wilckens J, Kitagawa M, Fetto J, Chao EY. Three-dimensional dynamic hip contact area and pressure distribution during activities of daily living. J Biomech. 2006;39(11):1996–2004. doi: 10.1016/j.jbiomech.2005.06.026. [DOI] [PubMed] [Google Scholar]


