

Abstract
Background
The taxonomic distinctiveness of Ascaris lumbricoides and A. suum, two of the world's most significant nematodes, still represents a much-debated scientific issue. Previous studies have described two different scenarios in transmission patterns, explained by two hypotheses: (1) separated host-specific transmission cycles in highly endemic regions, (2) a single pool of infection shared by humans and pigs in non-endemic regions. Recently, A. suum has been suggested as an important cause of human ascariasis in endemic areas such as China, where cross-infections and hybridization have also been reported. The main aims of the present study were to investigate the molecular epidemiology of human and pig Ascaris from non-endemic regions and, with reference to existing data, to infer the phylogenetic and phylogeographic relationships among the samples.
Methodology
151 Ascaris worms from pigs and humans were characterized using PCR-RFLP on nuclear ITS rDNA. Representative geographical sub-samples were also analysed by sequencing a portion of the mitochondrial cox1 gene, to infer the extent of variability at population level. Sequence data were compared to GenBank sequences from endemic and non-endemic regions.
Principal Findings
No fixed differences between human and pig Ascaris were evident, with the exception of the Slovak population, which displays significant genetic differentiation. The RFLP analysis confirmed pig as a source of human infection in non-endemic regions and as a corridor for the promulgation of hybrid genotypes. Epidemiology and host-affiliation seem not to be relevant in shaping molecular variance. Phylogenetic and phylogeographical analyses described a complex scenario, involving multiple hosts, sporadic contact between forms and an ancestral taxon referable to A. suum.
Conclusions/Significance
These results suggest the existence of homogenizing gene flow between the two taxa, which appear to be variants of a single polytypic species. This conclusion has implications on the systematics, transmission and control programs relating to ascariasis.
Author Summary
Ascaris lumbricoides, the world's most common human nematode, and A. suum, the pig roundworm, are two of the most important soil-transmitted helminthes of public health and socio-economic concern. However, previously documented similarities at the morphological and genetic level, coupled with evidence for hybridization and gene flow, have clouded the taxonomic distinctiveness of these two nematodes. To date, molecular epidemiological studies have been carried out, mostly in highly endemic regions, where two different transmission cycles have been described. Recently, pigs have been recognized as an important source of human ascariasis in China, opening questions about the zoonotic potential and the efficiency of control programs. Here, samples from non-endemic regions have been analysed using a nuclear marker to identify nematodes to species level plus a mitochondrial marker to investigate the phylogeographic relationships among individuals of the two species from both endemic and non-endemic regions. Results obtained suggested that A. suum and A. lumbricoides may be variants of the same species, with the lack of fixed genetic differences and considerable phylogeographic admixture confirming an extremely close evolutionary relationship among these nematodes. This study highlights the need to further explore the evolutionary affinities of the two taxa to help shed light on the epidemiology of ascariasis.
Introduction
Ascariasis in pigs and in humans is caused by two of the most socio-economically important nematodes: Ascaris suum Goeze, 1782 and Ascaris lumbricoides Linneaus, 1758, respectively. Human ascariasis is a soil-transmitted helminthiasis (STH), included in the WHO list of neglected tropical diseases (NTD), infecting more than one billion people [1]. Even if the majority of infections are asymptomatic, clinical manifestations of human ascariasis typically involve acute and chronic symptoms (lung inflammation and fever due to larval migration; abdominal pain, nausea, retarded growth in children and intestinal obstruction due to the massive presence of adult worms) [1]. Ascariasis in pigs is frequent in both intensive and extensive breeding systems, being a source of substantial economic losses [2].
Due to their morphological and biological similarities, the taxonomic distinctiveness of A. lumbricoides and A. suum still represents a debated scientific issue. Importantly, this issue is of great relevance for both systematists and epidemiologists alike, given its implications on parasite transmission, zoonotic potential, and the establishment of control programs [3], [4], [5]. Several hypotheses have been proposed to explain the origin of the two ascarid taxa in their respective hosts and their taxonomic status [3], namely: a) A. suum and A. lumbricoides are two valid species; b) A. suum is the ancestor of A. lumbricoides, originated by an allopatric event of host-switching; c) A. lumbricoides is the ancestor of A. suum; d) A. suum and A. lumbricoides are conspecific and therefore occur as variants of a single polytypic species.
Previous molecular epidemiological studies have described two different scenarios in transmission patterns that could be explained by two different hypotheses. First, distinct, host-specific transmission cycles have been observed in highly endemic regions as Guatemala and China [4], [5], [6], [7]. Second, a single pool of infection, shared by humans and pigs, has been observed in non-endemic regions, as Denmark and North America [8], [9]. Conversely, recent results strongly suggest that A. suum acts as an important source of human ascariasis in endemic area such as China, where both Ascaris spp. co-occur. Here, the authors observed cross-infections and hybridization of human and pig Ascaris, thus supporting the second hypothesis on transmission cycles [10].
Considering the uncertain epidemiological picture, the main aim of the present study was to investigate genetic variation in two nuclear and mitochondrial target regions (ITS and cox1, respectively) within and among Ascaris populations of human and pig origin, collected from a range of non-endemic regions. These molecular data, along with other published sequences available at both local and global scales, were then used to infer the evolutionary, phylogenetic and phylogeographic relationships among samples. The nuclear ribosomal marker (ITS) was chosen to distinguish A. suum, A. lumbricoides and the hybrid form of the two taxa. Meanwhile, mitochondrial DNA is the most frequently used molecular marker in this kind of studies, due to desirable biological features such as maternal inheritance, high mutation rate, very low recombination rate, haploidy, and putative selective neutrality, making mtDNA markers particularly suitable as barcoding tools to identify sibling and cryptic species [11], [12].
Studies aimed at investigating the molecular epidemiology of ascariasis are important not only to clarify the transmission patterns of the two roundworms, but also to better quantify the level of gene introgression between host-associated populations [10]. Such knowledge is important, given that introgression often results in the selection of novel genes, the promotion of rapid adaptive diversification, and homogenization across the genomes of the interbreeding populations [13], [14]. Additional sources of information are now available from the recently published draft genome of A. suum [15].
Methods
Samples
A total of 151 adult nematodes belonging to Ascaris spp. were collected from pig (n = 143) and human (n = 8) hosts. Nematodes collected were repeatedly washed in saline and stored in 70% ethanol. Collection data including collecting sites, hosts, number of parasites specimens analysed and identification codes are summarised in Table 1.
Table 1. Details of specimens analysed by PCR-RFLP approach on ITS ribosomal nuclear amplicons.
| Geographical Origin | Host | Np | Codes | Ng | As | Al | H |
| Italy | Pig | 70 | ASI1-11_S | 60 | 49 | 2 | 9 |
| ASI14-31_S | |||||||
| ASI33-73_S | |||||||
| Human | 3 | ASI12_U | 2 | 1 | 1 | ||
| ASI13_U | |||||||
| ASI32_U | |||||||
| Slovakia | Pig | 45 | ASS1-45_S | 44 | 36 | 4 | 4 |
| Hungary | Pig | 28 | ASU1-28_S | 27 | 19 | 8 | |
| Syria | Human | 1 | AUS_U | 1 | 1 | ||
| Romania | Human | 2 | ASR1-2_U | 2 | 1 | 1 | |
| Pakistan | Human | 2 | ASP1-2_U | 2 | 2 | ||
| Total | 151 | 137 | 106 | 10 | 22 | ||
| (77%) | (7%) | (16%) |
Geographical origin, host, number of parasites collected (Np), codes, number of parasites successfully genotyped (Ng), number of “suum” genotype (As), number of “lumbricoides” genotype (Al) and number of “heterozygote” genotype (H).
DNA was isolated using the Wizard Genomic DNA purification kit (Promega) according to the manufacturer's protocol.
Ethical statement
All samples, from human and animal origin, were obtained from existing collections. Samples from human origin were obtained from existing collections at Tor Vergata and Sant'Andrea Polyclinics in Rome. Data collection includes only the geographical origin of patients and no reference to personal data was recorded, thus guaranteeing the absolute anonymity of these specimens.
Sample collection at the Polyclinics that provided the nematodes from humans was performed in concordance with the WMA Helsinki Declaration (Edinburgh 2000) and its subsequent modification, as well as with the Italian National Law n. 675/1996 on the protection of personal data.
PCR-RFLP of ITS region
The entire ITS nuclear region (ITS1, 5.8S, ITS2) was amplified using 5.0 µl of template DNA (20–40 ng), 10 mM Tris-HCl (pH 8.3), 1.5 mM MgCl2 (Bioline), 40 mM of a nucleotide mix (Bioline), 50 pmol/µl each of the forward primer NC5 (5′-GTAGGTGAACCTGCGGAAGGATCAT-3′) and the reverse primer NC2 (5′-TTAGTTTCTTCCTCCGCT-3′) described by Zhu et al.[16] and 1.0 U of BIOTAQ DNA Polymerase (Bioline) in a final volume of 50 µl. The PCR was performed in a GenePro Eurocycler Dual Block (Bioer) under the following conditions: 10 min at 95°C (initial denaturation), 30 cycles of 30 sec at 95°C (denaturation), 40 sec at 52°C (annealing) and 75 sec at 72°C (extension), and a final elongation step of 7 min at 72°C. A negative control (without genomic DNA) was included in each set of amplification reactions.
A representative subset of specimens (Table 2) was also analysed by sequencing a portion of the mitochondrial cytochrome oxidase I gene (cox1), after amplification using the forward primer As-Co1F (5′-TTTTTTGGTCATCCTGAGGTTTAT- 3′) and the reverse primer As-Co1R (5′-ACATAATGAAAATGACTAACAAC- 3′), as described by Peng et al. [6], under the following conditions: 5 min at 94°C, followed by 35 cycles of 94°C for 30 s; 45 s at 55°C; 90 s at 72°C, followed by 5 min at 72°C. Aliquots (5 µl) of individual PCR products were separated by electrophoresis using agarose gels (1%), stained with ethidium bromide (0.4 µg/ml) and detected using ultraviolet trans-illumination.
Table 2. Details of haplotypes recovered in the partial cox1 sequence analyses.
| Haplotype | Cluster | GenBank | Codes | ITSg | Host | Region | Haplotype frequency | ||
| Slovakia | Italy | Hungary | |||||||
| Hap1 | C | KC455923 | ASS1,2,4,5,9,15,19 | As | Pig | NE | 0.429 | 0.0769 | |
| C | ASS6 | Pig | NE | ||||||
| C | ASI11 | H | Pig | NE | |||||
| C | ASI14 | As | Pig | NE | |||||
| C | JN575632 | ASS47 | Pig | NE | |||||
| Hap2 | C | KC455924 | ASS3, 8 | As | Pig | NE | 0.0952 | ||
| Hap3 | C | KC455925 | ASS7,11,12,18 | As | Pig | NE | 0.333 | ||
| C | ASS10 | Al | Pig | NE | |||||
| C | ASS16 | H | Pig | NE | |||||
| C | JN575633 | ASS46 | Pig | NE | |||||
| Hap4 | C | KC455926 | ASS14 | As | Pig | NE | 0.0476 | ||
| Hap5 | A1 | KC455927 | ASS20 | As | Pig | NE | 0.0476 | 0.615 | 0.875 |
| A1 | ASU2,4,6,7,10,11,20,21 | As | Pig | NE | |||||
| A1 | ASU5 | Pig | NE | ||||||
| A1 | ASU8,9,12,27,28 | H | Pig | NE | |||||
| A1 | ASI3,4,10,15–17 | As | Pig | NE | |||||
| A1 | ASI12 | As | Human | NE | |||||
| A1 | ASI18–26 | Pig | NE | ||||||
| A1 | ASR1 | As | Human | NE | |||||
| A1 | AJ968334 | ASC18 | Pig | E | |||||
| Hap6 | A1 | KC455928 | ASU1 | As | Pig | NE | 0.0625 | ||
| Hap7 | B | KC455929 | ASI8,9 | As | Pig | NE | 0.0769 | ||
| B | JN575631 | ASS48 | Human | NE | |||||
| B | GU326952 | ASB3 | Human | NE | |||||
| B | AB591804 | ASG1 | Pig | E | |||||
| B | AB591802 | ASG2 | Pig | NE | |||||
| B | AB591805 | ASG6 | Pig | NE | |||||
| B | AB591800 | ASG3 | Human | NE | |||||
| B | AB591798 | ASG4 | Human | NE | |||||
| B | AB591796 | ASG5 | Human | NE | |||||
| B | AB591799 | ASG9 | Human | NE | |||||
| B | AB591797 | ASG10 | Human | NE | |||||
| B | EU582490 | ASZ5 | Human | E | |||||
| B | AJ968342 | ASC11 | Pig | E | |||||
| B | AJ968338 | ASC13 | Pig | E | |||||
| B | AJ968332 | ASC14 | Human | E | |||||
| Hap8 | A1 | KC455930 | ASU3 | As | Pig | NE | 0.0625 | ||
| Hap9 | A1 | KC455931 | ASI1 | As | Pig | NE | 0.0385 | ||
| Hap10 | A1 | KC455932 | ASI2 | As | Pig | NE | 0.0385 | ||
| Hap11 | A1 | KC455933 | ASI5 | As | Pig | NE | 0.115 | ||
| A1 | ASI6,7 | H | Pig | NE | |||||
| Hap12 | A2 | KC455934 | ASI13 | Human | NE | 0.0385 | |||
| A2 | GU326951 | ASB1 | Pig | E | |||||
| A2 | GU326949 | ASB4 | Human | E | |||||
| A2 | GU326948 | ASB7 | Human | E | |||||
| A2 | EU582492 | ASZ4 | Human | E | |||||
| A2 | EU582484 | ASZ8 | Human | E | |||||
| A2 | EU582497 | ASZ10 | Human | E | |||||
| A2 | AJ968336 | ASC17 | Pig | E | |||||
| Hap13 | A2 | GU326954 | ASB2 | Human | E | ||||
| Hap14 | B | GU326953 | ASB5 | Human | E | ||||
| Hap15 | A | GU326955 | ASB6 | Human | E | ||||
| Hap16 | A2 | HM602025 | ASB8 | Pig | E | ||||
| Hap17 | A | AB591803 | ASG7 | Pig | NE | ||||
| Hap18 | A2 | AB591801 | ASG8 | Human | NE | ||||
| Hap19 | B | AB591795 | ASG11 | Human | NE | ||||
| Hap20 | A2 | EU582498 | ASZ1 | Human | E | ||||
| Hap21 | A2 | EU582496 | ASZ2 | Human | E | ||||
| Hap22 | A2 | EU582494 | ASZ3 | Human | E | ||||
| Hap23 | A2 | EU582488 | ASZ6 | Human | E | ||||
| Hap24 | B | EU582486 | ASZ7 | Human | E | ||||
| Hap25 | B | EU582499 | ASZ9 | Human | E | ||||
| Hap26 | B | EU582493 | ASZ11 | Human | E | ||||
| B | AJ968340 | ASC12 | Pig | E | |||||
| Hap27 | A2 | EU582495 | ASZ12 | Human | E | ||||
| Hap28 | A1 | EU582491 | ASZ13 | Human | E | ||||
| Hap29 | A2 | EU582489 | ASZ14 | Human | E | ||||
| Hap30 | A2 | EU582487 | ASZ15 | Human | E | ||||
| Hap31 | A2 | EU582485 | ASZ16 | Human | E | ||||
| Hap32 | B | AJ968343 | ASC1 | Pig | E | ||||
| Hap33 | B | AJ968341 | ASC2 | Pig | E | ||||
| Hap34 | B | AJ968339 | ASC3 | Pig | E | ||||
| Hap35 | B | AJ968337 | ASC4 | Pig | E | ||||
| Hap36 | A1 | AJ968335 | ASC5 | Pig | E | ||||
| Hap37 | A1 | AJ968333 | ASC6 | Human | E | ||||
| Hap38 | B | AJ968331 | ASC7 | Human | E | ||||
| Hap39 | A1 | AJ968329 | ASC8 | Human | E | ||||
| Hap40 | A | AJ968327 | ASC9 | Human | E | ||||
| Hap41 | A2 | AJ968325 | ASC10 | Human | E | ||||
| Hap42 | B | AJ968330 | ASC15 | Human | E | ||||
| Hap43 | A1 | AJ968328 | ASC16 | Human | E | ||||
| Hap44 | A2 | AJ968326 | ASC19 | Human | E | ||||
| Hap45 | A1 | AJ968324 | ASC20 | Human | E | ||||
| Hap46 | B | KC455935 | ASP | Al | Human | E | |||
Haplotypes, affiliation to phylogenetic clusters A(A1, A2)-B-C, GenBank accession numbers, codes, genotypes recovered using RFLP approach on ITS ribosomal nuclear amplicons (“suum” genotype: As, “lumbricoides” genotype: Al and “heterozygote” genotype: H), host, region (NE: non-endemic; E: endemic). Haplotypes relative frequencies are reported only for populations of Dataset1.
Positive ITS amplicons were digested with the restriction endonuclease HaeIII, as the resulting patterns have been previously proved useful for the identification of human and pig Ascaris species [8]. Digests were resolved by electrophoresis in 2% agarose gels, stained with ethidium bromide (0.4 µg/ml), detected under UV trans-illumination, and the fragments sizes determined by comparison with a 100 bp DNA ladder (Promega). Information on geographical origin, hosts, codes, number of parasites successfully genotyped, and genotypes recovered using PCR-RFLP are available in Table 1.
Phylogenetic and network analysis of cox1 region
Positive amplicons were purified by SureClean (Bioline), following the manufacturer's instructions, and then sequenced by MWG Eurofins DNA. Two different datasets were created, each representing different partial cox1 alignments: the first including only samples analysed in the present paper (Dataset1), with the exclusion of two human nematodes due to small sample size (single specimens from Pakistan and Romanian human patients), and the second including all GenBank retrieved sequences of specimens collected from endemic and non-endemic regions (Dataset2). Information about specimens sequenced for cox1, identification codes and accession numbers, also of GenBank retrieved sequences are available in Table 2.
Nucleotide sequences were aligned using Clustal X implemented in MEGA 5 [17] and then analysed using DnaSP v5 [18] to infer haplotype composition. In addition, sequences were analysed using Arlequin 3.11 [19] to estimate several variability indexes: the relative frequencies of haplotypes; population differentiation (FST) among samples for Dataset1; hierarchical analyses of molecular variance (AMOVA) to evaluate the amount of population genetic structure for Dataset2, using information on the allelic content of haplotypes, as well as their frequencies. The significance of the covariance components associated with the different levels of genetic structure (within individuals of populations, among populations and among groups) was tested using non-parametric permutation procedures [20]. The AMOVA was undertaken twice, using two different criteria to define groups and population structure: geographical origin (endemic and non-endemic regions) and host affiliation (pig and human).
Both Dataset1 and 2 were also analysed using a phylogenetic approach based on Bayesian reconstruction method. The program JModeltest [21] was used to compare the fit of nucleotide substitution models using the Akaike Information Criterion (AIC), under a total of 83 models, corresponding to 11 different schemes; the best-fit model and parameters determined for both cox1 datasets were then used for the Bayesian analyses. The Bayesian analyses were performed using the HKY+I model for both datasets (as selected by ModelTest), using BEAST software [22]; datasets were run twice for 106 generations. Posterior probability values (BPP) shown in the Bayesian consensus trees were determined after discarding trees from the burn-in period. For each dataset, burn-in was estimated to include the first 104 generations. A second phylogenetic method was performed only on Dataset 2 using MEGA5 [23]: the evolutionary distances were computed using the Tamura-Nei [24] with Neighbor joining method (NJ) and statistical support at nodes was evaluated using 1000 pseudoreplication bootstrap [25]. Phylogenetic trees included Anisakis Dujardin 1845 as outgroup (GenBank accession number: JN102304).
Moreover, statistic parsimony networks [26] using TCS software [27] were inferred for both datasets in order to determine the phylogeographic distribution and genealogy of the Ascaris specimens analysed, running the network at a 95% connection limit, which is the maximum number of mutational connections between pairs of sequences justified by the parsimony criterion.
Results
PCR-RFLP ITS analysis
A PCR product of around 1000 bp was obtained for 137 of the 151 specimens analysed. Amplicons were subsequently digested using the HaeIII restriction enzyme. This approach yielded the identification of three genetically distinct banding patterns belonging to the genus Ascaris: the “lumbricoides” genotype displays two bands of about 610 bp and 370 bp, the “suum” genotype shows three bands of about 610 bp, 230 bp and 140 bp, and the “hybrid” genotype displays all the four bands mentioned above (Figure 1).
Figure 1. Molecular characterization of Ascaris by PCR-RFLP.
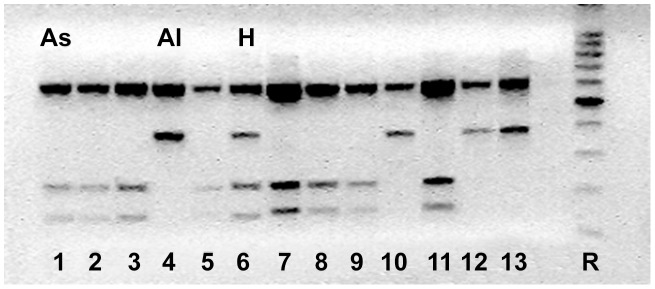
A representative gel displaying the RFLP profiles following the digestion of ITS amplicons with restriction endonuclease HaeIII. Genotype As: Ascaris suum banding pattern (lanes 1–3,5,7–9,11); genotype Al : A. lumbricoides banding pattern (lanes 4,10,12,13); genotype H: hybrid/heterozygote banding pattern (lane 6); R (right-hand lane): 100bp reference ladder.
While the proportion of each genotype varied somewhat across the various localities sampled, all regions revealed instances of discordance between the expected genotype and host of origin (Table 1). For Italy, although 49 of 60 positive samples from pigs displayed the expected “suum” genotype, nine displayed the “hybrid” genotype and two displayed the “lumbricoides” genotype. In contrast, neither of the two positive human isolates displayed the expected “lumbricoides” pattern, instead revealing one “suum” and one “hybrid” genotype. Positive samples obtained from nematodes collected in other countries included four specimens from humans and 71 from pigs. Of the human nematodes, three specimens (Syrian, Pakistan and Romanian patients) showed the typical “lumbricoides” genotype and one (another Romanian patient) displayed the “suum” genotype. Among Slovak pigs (n = 44), 36 showed the “suum” genotype, four the “lumbricoides” genotype, and four the “hybrid” pattern, while Hungarian pigs (n = 27) included 19 specimens and eight specimens displaying the “suum” genotype and “hybrid” genotypes, respectively. Overall, the “hybrid” genotype was encountered in specimens from both pig and human hosts, at a frequency of 16%.
Cox1 phylogenetic and network analyses
A PCR product of around 400 bp was obtained for 62 specimens amplified. The alignments of Dataset1 (62 sequences) and Dataset2 (120 sequences) yielded a usable alignment of 327 bp. Representative sequences for each haplotype recovered in the course of the present study are available in GenBank under the following Accession Numbers: Hap1: KC455923, Hap2: KC455924, Hap3: KC455925, Hap4: KC455926, Hap5: KC455927, Hap6: KC455928, Hap7: KC455929, Hap8: KC455930, Hap9: KC455931, Hap10: KC455932, Hap11: KC455933, Hap12: KC455934, Hap46: KC455935.
Twelve haplotypes were identified in Dataset1 (Hap1-12), with a total haplotype diversity (Hd) of 0.70 (haplotypes recovered were deposited in GenBank, see Table 2 for accession numbers). Five haplotypes were observed in Slovak sample, with Hd = 0.71; three haplotypes were observed in Hungarian sample, with Hd = 0.24 and seven haplotypes were observed in Italian sample, with Hd = 0.62. The most frequent haplotype was Hap5, shared among the Italian (frequency of 61.5%), Hungarian (87.5%) and Slovak samples (5.5%). Hap1 was the most frequent haplotype in the Slovak population (44.4%) and it has been less frequently reported also in Italian specimens (7.7%). Results from FST analysis showed significant differences between Slovak sample and the Italian (0.29) and Hungarian samples (0.49), and little differentiation between Italian and Hungarian samples (0.05). Considering Dataset2, forty-five haplotypes were identified, with Hd = 0.89; Hap5 was observed also in the Chinese pig sample. The Italian and Slovak samples showed haplotype Hap7 in common with endemic (Brazil, Zanzibar and China) and non-endemic regions (Japan); the Italian sample showed also haplotype Hap12 in common with endemic regions. Information about haplotypes recovered in the partial cox1 sequences analyses, haplotype affiliation to phylogenetic clusters A(A1, A2)-B-C, GenBank accession numbers, codes, correspondences to genotypes identified using RFLP approach on ITS, hosts, endemic and non-endemic origin of samples and haplotypes relative frequencies for populations of Dataset1 are available in Table 2.
AMOVA analysis suggested a higher influence of the epidemiological (endemic/non-endemic origin) criterion in modulating the accumulation of variability with respect to host affiliation, even if the percentage of variation at group level was not significant (3.83% and 0.10%; p = 0.38 and 0.61, respectively). Significant values (p≤0.05) were obtained for the variation observed among populations within groups and among individuals within populations in both analyses, but with an opposite trend: percentage of variation within population was higher than among populations of the same group if the endemic/non-endemic criterion is considered as feature to group samples.
Bayesian and NJ phylogenetic analyses, based on Dataset1 and Dataset2, described similar topologies, with three main clusters (Figure 2), analogous to the clusters named A, B and C in Anderson and Jaenike [28] and Snabel et al. [29] studies. Clusters A and B have been recently reported also by Iniguez et al. [30].
Figure 2. Neighbor Joining tree of Ascaris samples.

Evolutionary history of the Ascaris sp. partial cox1 mitochondrial DNA sequences, obtained by Neighbor Joining analysis. The same topology was obtained for Bayesian analyses. Numbers at nodes branches represent posterior probability (BPP) values of Dataset 2, Dataset 1 and bootstrap values (A = Cluster A, including subclusters A1 and A2; B = Cluster B; C = Cluster C). The bar shows the mean number of base substitution per site. H and P in codes represent human and pig hosts, respectively. Colored dots indicate ITS RFLP genotypes (blue: A. lumbricoides, red: A. suum, green: hybrid genotype). Trend for host affiliation is indicated on the right of the tree, as defined by the proportional size of human and pig gray figures.
Cluster A includes samples from both pigs and humans collected from endemic and non-endemic zones; it showed further slight internal subdivision according to host affiliation and epidemiological features, although no statistical support for this partitioning was found. Sub-cluster A1 contains mainly specimens from pigs and few from humans, collected from non-endemic zones. It is important to underline that the specimens of human origin (ASR_H and ASI12_H) included in this group showed the typical “suum” genotype for PCR-RFLP analysis of the ITS region. Sub-cluster A2 includes mainly specimens from humans collected from endemic areas, except for one human sample (ASI13 corresponding to Hap12) collected from non-endemic regions, although the country origin of the patient is unknown. Cluster B is also characterized by the presence of specimens from both pigs and humans collected from endemic (Brazil, China, Zanzibar, Pakistan) and non-endemic zones (Japan, Italy). Cluster C comprises only specimens from pig collected from non-endemic regions (Italy and Slovakia). It appears to be well separated from clusters A and B that are more closely related to each other. The existence of the three clusters is well supported by very high posterior probability values (BPP ranging from 92 to 98 for Dataset1 and from 90 to 100 for Dataset2); NJ tree bootstrap values show high statistical support for cluster C (93) and lower values for cluster A (51) and B (38), nevertheless the value supporting the distinctiveness of cluster C from A and B together is fairly high (77).
Results obtained from parsimony network analysis on Dataset2 (Figure 3) describes a very complex scenario where the three clusters observed in phylogenetic analysis are recognized and the slight subdivision inside cluster A is still evident. The main haplogroup, where Hap5 is the more frequent and typically associated to A. suum, corresponds to cluster A1 with several haplotypes branching around. The star-like distribution of haplotypes is also evident in the other haplogroups, represented by Hap12 for cluster A2 and Hap7 for cluster A. Cluster A2 is mainly represented by haplotypes from endemic regions, typically associated to A. lumbricoides, with the exception of Italian and Japanese human cases; while cluster B includes both pig and human specimens from endemic and non-endemic regions. The Slovak haplogroup appears completely separated from the other haplotypes. These results confirm the relationships observed in the Bayesian phylogenetic trees.
Figure 3. Parsimony network of Ascaris haplotypes.

Parsimony network of the haplotypes observed in the Dataset2, with 95% connection limit. Circles diameter is proportional to haplotypes frequency; circles at branches represent SNPs (A = Cluster A, including subclusters A1 and A2; B = Cluster B; C = Cluster C).
Discussion
Human and pig Ascaris spp. are two of the world's most common soil-transmitted parasites and together cause serious health and socio-economic problems. Ascariasis is considered a NTD as it occurs commonly in rural and poor urban areas and promotes poverty due to its high impact on child health and development, pregnancy and worker productivity. Similarities in the morphology and biology of these two nematodes entail ongoing ambiguity concerning their taxonomic status and argue for the need to delve deeper into their comparative molecular epidemiology.
The present paper provides additional information on the molecular epidemiology of ascariasis in non-endemic regions, such as Italy and Eastern Europe. Molecular characterization using a PCR-RFLP approach on a nuclear marker has confirmed that most pig nematodes sampled herein displayed the typical A. suum pattern, corresponding to the genotype G3, while the two human nematodes from endemic regions such as Pakistan and Syria showed the typical A. lumbricoides pattern, corresponding to the genotype G1 [31]. Cross-infection is confirmed in both hosts by instances of A. suum genotypes in human nematodes and A. lumbricoides in pigs. Moreover, a significant percentage of nematodes displaying the “hybrid” pattern, corresponding to the G2 genotype [31], has been observed in both human and pig nematodes, strongly inferring the presence of gene flow between the two taxa. This combined evidence suggests that Ascaris suum can function as a relevant agent of human infection in non-endemic areas. These data are in agreement with recent results described firstly by Betson et al. in Zanzibar [32] and then by Zhou et al. in China [10], where zoonotic transmission of A. suum is suggested to occur also in these endemic areas. The zoonotic potential of A. suum therefore needs to be reevaluated in order to plan more efficient control programs.
Phylogenetic analyses revealed the homology to the clusters previously observed in Anderson and Jaenike [28] and in Snabel et al. [29], confirming that geographical origin plays an important role in structure of cluster A, where endemic and non-endemic samples split in two sub-clades, but not in cluster B, which contains specimens from both epidemiologically classified regions. Finally, significant values on population differentiation analysis and high haplotype diversity confirm the genuine separation of cluster C. As these parameters are important indexes for evaluating genetic diversity and differentiation, further analysis will be required to understand the significance of this pronounced genetic dissimilarity.
Phylogeographic analyses are helpful in understanding population differentiation, species formation and ecological adaptation [33]. Results obtained from the haplotype network analysis have revealed a very complex scenario: the typical A. suum haplotype is the most frequent among samples from non-endemic regions plus is observed also in human patients (circle A1); moreover, this haplogroup is closely related to the haplogroup including the distinctive A. lumbricoides haplotypes found in endemic regions (circle A2), which is related in turn to a mixed group homologous to cluster B obtained in phylogenetic inferences (circle B). The picture described a cross-linked relationships among haplotypes, where no clear geographical or host-affiliation criteria seem to be relevant in shaping haplogroups. Shared haplotypes between pig and human Ascaris spp. could be explained by evolutionary processes such as introgression and/or retention of ancestral polymorphisms, as suggested previously [9], [34]. In addition, molecular variance analysis underlined that accumulation of genetic variability is observed at the individual and population level rather than at the level of groups defined on geography or host-affiliation.
The overall results showed no fixed differences between human and pig Ascaris, describing two taxonomic entities intimately interconnected and therefore likely to experience gene flow. These data strongly infer the absence of a major genetic barrier between the two taxa and therefore suggest that A. suum and A. lumbricoides may be variants of the same species, as suggested by Leles et al. [3] and Liu et al. [35], and more recently by Iniguez et al. [30]. Together all four studies have found no evidence of diagnostic genetic heterogeneity between human and pig Ascaris, plus an absence of genetic clusters discriminating each host.
Supporting Information
Haplotype relative frequencies.
(DOC)
Acknowledgments
We are very grateful to Prof. Domenico Otranto and Dr. Stefania Latrofa (University of Bari, Italy), Dr. Federica Berrilli (University of Tor Vergata, Italy) and Dr. Pamela Avellino (Sant'Andrea Polyclinic) for providing part of the Italian sample. We thank Carlo Taccari for graphic assistance.
Funding Statement
This work was partially supported in the framework of the Executive Programme of Scientific and Technological co-operation between Italy and Slovakia for the years 2008–2010 (http://www.esteri.it/MAE/doc_politica_estera/Cultura/CooperScientificaTecnologica/Programmi%20esecutivi/82_Slovacchia_PE_ST.pdf). The funders had no role in study design, data collection and analysis, decision to publish, or preparation of the manuscript.
References
- 1. Dold C, Holland CV (2011) Ascaris and ascariasis. Microbes Infect 13: 632–637. [DOI] [PubMed] [Google Scholar]
- 2. Skallerup P, Nejsum P, Jørgensen CB, Göring HH, Karlskov-Mortensen P, et al. (2012) Detection of a quantitative trait locus associated with resistance to Ascaris suum infection in pigs. Int J Parasitol 42: 383–391. [DOI] [PubMed] [Google Scholar]
- 3. Leles D, Gardner SL, Reinhard K, Iñiguez A, Araujo A (2012) Are Ascaris lumbricoides and Ascaris suum a single species?. Parasit Vectors 5: 42. [DOI] [PMC free article] [PubMed] [Google Scholar]
- 4. Anderson TJ, Romero-Abal ME, Jaenike J (1993) Genetic structure and epidemiology of Ascaris populations: patterns of host affiliation in Guatemala. Parasitology 107: 319–334. [DOI] [PubMed] [Google Scholar]
- 5. Peng W, Anderson TJC, Zhou X, Kennedy MW (1998) Genetic variation in sympatric Ascaris populations from humans and pigs in China. Parasitology 17: 355–361. [DOI] [PubMed] [Google Scholar]
- 6. Peng W, Yuan K, Hu M, Gasser RB (2005) Mutation scanning-coupled analysis of haplotypic variability in mitochondrial DNA regions reveals low gene flow between human and porcine Ascaris in endemic regions of China. Electrophoresis 26: 4317–4326. [DOI] [PubMed] [Google Scholar]
- 7. Criscione CD, Anderson JD, Sudimack D, Peng W, Jha B, et al. (2007) Disentangling hybridization and host colonization in parasitic roundworms of humans and pigs. Proc R Soc B 274: 2669–2677. [DOI] [PMC free article] [PubMed] [Google Scholar]
- 8. Anderson TJC (1995) Ascaris infections in humans from North America: molecular evidence for cross-infection. Parasitology 110: 215–219. [DOI] [PubMed] [Google Scholar]
- 9. Anderson TJC (2001) The dangers of using single locus markers in parasite epidemiology: Ascaris as a case study. Trends Parasitol 17: 183–188. [DOI] [PubMed] [Google Scholar]
- 10. Zhou C, Li M, Yuan K, Deng S, Peng W (2012) Pig Ascaris: An important source of human ascariasis in China. Infect Genet Evol 12: 1172–1177. [DOI] [PubMed] [Google Scholar]
- 11. Blouin MS (2002) Molecular prospecting for cryptic species of nematodes: mitochondrial DNA versus internal transcribed spacer. Int J Parasitol 32: 527–531. [DOI] [PubMed] [Google Scholar]
- 12. Nieberding C, Morand S, Libois R, Michaux JR (2004) A parasite reveals cryptic phylogeographic history of its host. Proc Biol Sci 271: 2559–2568. [DOI] [PMC free article] [PubMed] [Google Scholar]
- 13. Barton NH (2001) The role of hybridization in evolution. Mol Ecol 10: 551–568. [DOI] [PubMed] [Google Scholar]
- 14. Seehausen O (2004) Hybridization and adaptive radiation. Trends Ecol Evol 19: 198–207. [DOI] [PubMed] [Google Scholar]
- 15. Jex AR, Liu S, Li B, Young ND, Hall RS, et al. (2011) Ascaris suum draft genome. Nature 479: 529–533. [DOI] [PubMed] [Google Scholar]
- 16. Zhu XQ, Chilton NB, Jacobs DE, Boes J, Gasser RB (1999) Characterisation of Ascaris from human and pig hosts by nuclear ribosomal DNA sequences. Int J Parasitol 29: 469–478. [DOI] [PubMed] [Google Scholar]
- 17. Tamura K, Peterson D, Petersen N, Stecher G, Nei, et al (2011) MEGA5: molecular evolutionary genetics analysis using maximum likelihood, evolutionary distance, and maximum parsimony methods. Mol Bio Evol 28: 2731–2739. [DOI] [PMC free article] [PubMed] [Google Scholar]
- 18. Librado P, Rozas J (2009) DnaSP v5: A software for comprehensive analysis of DNA polymorphism data. Bioinformatics 25: 1451–1452. [DOI] [PubMed] [Google Scholar]
- 19. Excoffier L, Laval G, Schneider S (2005) Arlequin ver. 3.0: An integrated software package for population genetics data analysis. Evol Bioinform Online 1: 47–50. [PMC free article] [PubMed] [Google Scholar]
- 20. Excoffier L, Smouse P, Quattro J (1992) Analysis of molecular variance inferred from metric distances among DNA haplotypes. Application to human mitochondrial DNA restriction data. Genetics 131: 479–491. [DOI] [PMC free article] [PubMed] [Google Scholar]
- 21. Posada D (2009) Selection of models of DNA evolution with jModelTest. Meth Mol Biol 537: 93–112. [DOI] [PubMed] [Google Scholar]
- 22. Drummond AJ, Rambaut A (2007) BEAST: Bayesian evolutionary analysis by sampling trees. BMC Evol Biol 7: 214. [DOI] [PMC free article] [PubMed] [Google Scholar]
- 23. Templeton AR, Crandall KA, Sing CF (1992) A cladistic analysis of phenotypic associations with haplotypes inferred from restriction endonuclease mapping and DNA sequence data. III. Cladogram estimation. Genetics 132: 619–633. [DOI] [PMC free article] [PubMed] [Google Scholar]
- 24. Clement M, Posada D, Crandall KA (2000) TCS: a computer program to estimate gene genealogies. Mol Ecol 9: 1657–1659. [DOI] [PubMed] [Google Scholar]
- 25. Tamura K, Peterson D, Peterson N, Stecher G, Nei M, Kumar S (2011) MEGA5: Molecular Evolutionary Genetics Analysis using Maximum Likelihood, Evolutionary Distance, and Maximum Parsimony Methods. Mol Biol Evol 28: 2731–2719. [DOI] [PMC free article] [PubMed] [Google Scholar]
- 26. Tamura K, Nei M (1993) Estimation of the number of nucleotide substitutions in the control region of mitochondrial DNA in humans and chimpanzees. Mol Biol Evol 10: 512–526. [DOI] [PubMed] [Google Scholar]
- 27. Felsenstein J (1985) Confidence limits on phylogenies: An approach using the bootstrap. Evolution 39: 783–791. [DOI] [PubMed] [Google Scholar]
- 28. Anderson TJC, Jaenike J (1997) Host specificity, evolutionary relationships and macrogeographic differentiation among Ascaris populations from human and pigs. Parasitology 115: 325–342. [DOI] [PubMed] [Google Scholar]
- 29. Snabel V, Taira K, Cavallero S, D'Amelio S, Rudohradska P, et al. (2012) Genetic structure of Ascaris roundworm in Japan and patterns of its geographical variation. Jpn J Infect Dis 65: 179–183. [PubMed] [Google Scholar]
- 30. Iñiguez AM, Leles D, Jaeger LH, Carvalho-Costa FA (2012) Araújo A; Amazonas Research Group (2012) Genetic characterisation and molecular epidemiology of Ascaris spp. from humans and pigs in Brazil. Trans R Soc Trop Med Hyg 106: 604–612. [DOI] [PubMed] [Google Scholar]
- 31. Peng W, Yuan K, Zhou X, Hu M, El-Osta, et al. (2003) Molecular epidemiological investigation of Ascaris genotypes in China based on single-strand conformation polymorphism analysis of ribosomal DNA. Electrophoresis 24: 2308–2315. [DOI] [PubMed] [Google Scholar]
- 32. Betson M, Halstead F, Nejsum P, Imison E, Khamis, et al. (2011) A molecular epidemiological investigation of Ascaris on Unguja, Zanzibar using isoenzyme analysis, DNA barcoding and microsatellite DNA profiling. Trans R Soc Trop Med Hyg 105: 370–379. [DOI] [PubMed] [Google Scholar]
- 33.Avise JC (2000). Phylogeography, the history and formation of species. Cambridge, Massachusetts: Harvard University Press.
- 34. Betson M, Nejsum P, Llewellyn-Hughes J, Griffin C, Atuhaire A, et al. (2012) Genetic diversity of Ascaris in southwestern Uganda. Trans R Soc Med Hyg 106: 75–83. [DOI] [PubMed] [Google Scholar]
- 35. Liu GH, Wu CY, Song HQ, Wei SJ, Xu MJ, et al. (2012) Comparative analyses of the complete mitochondrial genomes of Ascaris lumbricoides and Ascaris suum from humans and pigs. Gene 492: 110–116. [DOI] [PubMed] [Google Scholar]
Associated Data
This section collects any data citations, data availability statements, or supplementary materials included in this article.
Supplementary Materials
Haplotype relative frequencies.
(DOC)