

Abstract
Increased GGT activity is associated with liver injury and with mortality in the general population. Less is known about its association with HCV outcomes. We examined the GGT as a predictor of both virological response to treatment and long-term clinical outcomes in the Hepatitis C Anti-viral Treatment Against Cirrhosis Trial (HALT-C). Methods: HALT-C enrolled patients with advanced liver disease (Ishak fibrosis score >=3) in 2 phases: a lead-in to establish lack of sustained viral response with full dose pegylated interferon (IFN) and ribavirin followed by a 3.5 year randomized trial with low-dose IFN. Low-dose IFN did not prevent liver disease progression, and patients were then followed for up to an additional 5 years off therapy. Analyses were performed for 1319 patients who had GGT measured prior to initiation of treatment. Increases in risk with each increase in quintile of GGT (10–57, 58–89, 90–139, 140–230, 231–2000 IU/L) were determined by logistic regression for treatment response or Cox regression for clinical outcomes. Results: Baseline GGT was associated with male sex, non-white ethnicity, diabetes and insulin resistance, IL28B rs12979860 CT and TT genotypes, and numerous markers of liver disease injury and severity. In the lead-in phase, increasing GGT was strongly associated with diminished week 20 response, end of treatment response and sustained virological response in both univariate and multivariate analyses controlling for factors known to be associated with treatment response (p<0.0001). GGT was also associated with all clinical outcomes in univariate and multivariate analysis (p<0.05) except for hepatocellular carcinoma (p=0.46 in multivariate analysis). Conclusion: GGT is an independent predictor of both virological response and clinical outcomes among patients with advanced liver disease due to HCV.
Keywords: liver injury, mortality, liver decompensation, HALT-C, IL28B
The enzyme γ-glutamyl transferase (GGT) catalyzes the transfer of a γ-glutamyl group from glutathione (GSH) and other γ-glutamyl compounds to amino acids or dipeptides. It also catalyzes hydrolysis of the γ-glutamyl bond. The enzyme is present in several organs, most notably the liver.1 GGT activity is elevated in cholestatic liver disease, alcoholic and other fatty liver disease, and can be induced by a number of drugs, including barbituates and phenytoin. GGT activity is not necessarily considered a routine test in the evaluation of liver disease because it is believed to contribute little diagnostic information. As a result, GGT is often not part of standard panels that include other liver enzymes (personal communication from 7 hepatologists at academic sites). Perhaps because of its limited utility in diagnosis of liver disease, the prognostic significance of GGT may have been undervalued. For example, increased GGT activity been associated with increased mortality in the general population.2–4. We examined the value of GGT activity as a predictor of treatment response and of liver disease outcomes among a large cohort of patients with chronic, hepatitis C who participated in the Hepatitis C Anti-viral Treatment Against Liver Disease Trial (HALT-C).
Methods
Study design
HALT-C had two major treatment phases (clinical trials.gov identifier NCT00006164) and an observational phase.5–7 A lead-in phase used full dose pegylated interferon alpha 2a (Pegasys, Roche) and ribavirin to attempt to achieve sustained virological response (SVR) among patients with advanced liver disease (Ishak fibrosis score of 3 or greater on liver biopsy) who had previously been treated with standard IFN with or without ribavirin. Patients who did not achieve SVR were eligible for the randomized phase, a controlled clinical trial of pegylated interferon alfa-2a at a dosage of 90μg per week for 3.5 years, as compared with no treatment. The primary end point was progression of liver disease, as indicated by death, hepatocellular carcinoma (HCC), hepatic decompensation, or, for those with bridging fibrosis at baseline, an increase in the Ishak fibrosis score of 2 or more points. Most patients entered the randomized trial through the lead-in phase as non-responders after 20 weeks of therapy (based on detectable HCV RNA by Roche Cobas Amplicor assay) or after subsequent breakthrough or relapse. Other patients entered the randomized phase as “express” patients by having failed to clear virus outside of the HALT-C lead-in. All patients also had liver biopsies scheduled at 18 months after randomization and at the end of treatment 42 months after randomization. Patients continued to be followed in the observational phase for clinical outcomes off therapy for as long as 5 additional years. The median duration of participation in the trial (time from randomization to first outcome or last time known to be outcome-free) was 6.0 years (range, 0–8.7 years). Informed consent in writing was obtained from each patient, and the study protocol was approved by the institutional review committee of each of the participating centers.
GGT activity was measured under code on stored frozen samples (−80 degrees C) by Wako pharmaceuticals (Richmond VA) under a clinical trial agreement with NIDDK. The normal range was reported as 12–64 IU/L for men and 9–36 IU/L for women.
Patient Population
Of the 1319 patients with GGT measurements, 770 participated in both the lead-in and randomized phases of the trial (blood sample drawn shortly before lead-in), 320 only in the lead-in phase (blood sample drawn shortly before lead-in), and 229 only in the randomized phase (blood sample drawn shortly randomization). GGT results were available on 95.2% of lead-in patients and 95.1% of randomized patients. Values for the 1319 patients were divided into quintiles and used throughout the analyses. The minimum was 10 IU/L, 20th percentile 58 IU/L, 40th percentile 90 IU/L, 60th percentile 140 IU/L, 80th percentile 231 IU/L, and maximum was 2000 IU/L.
Statistical Analysis
Baseline associations with GGT quintiles were evaluated by assigning scores of 1 to 5 to the 5 quintiles and then using the Mantel-Haenszel chi-square test or an analysis of variance to test for trends with increasing GGT. Multivariate linear regression with backward selection was used to determine predictors of GGT quintile. Logistic regression with backwards selection was used to assess the association of GGT quintile and other variables with treatment response. Survival curves for clinical outcomes were estimated using the Kaplan-Meier method and the log-rank test for trends was used to test significance. Cox regression with backward selection was used to evaluate predictors of clinical outcomes. The analysis of change in GGT was based on the change from baseline to the time of the last biopsy, either 18 or 42 months after randomization. Analysis of variance was used to evaluate predictors of this change. For all analyses, the measurement closest to the baseline biopsy was considered the baseline GGT. All analyses were performed using SAS® version 9.3.
Results
Baseline Associations
Of the 1090 patients who entered the lead-in phase and had GGT measured, enzyme activity was positively associated in univariate analysis with numerous other variables, including male sex, non-white ethnicity, diabetes, insulin resistance, history of smoking or drinking, current coffee consumption, IL28B rs12979860 T allele, numerous laboratory tests, low HCV RNA level, and several histological features (Table 1). Although PNPLA3 GG rs738409 genotype was strongly associated with hepatic steatosis (p<0.0001, not shown), and steatosis was strongly associated with GGT (p<0.0001), there was no association of PNPLA3 genotype and GGT (p=0.31). In multivariate linear regression with quintile of GGT activity as the dependent variable, the strongest associations with GGT activity were with male sex, IL28B rs12979860 CC allele, histologic hepatic steatosis, alanine aminotransferase (ALT) and alkaline phosphatase activities and serum ferritin concentration (Table 2).
Table 1.
Association of quintiles of GGT activity (IU/L)with patient features expressed as means (SD) or percent at time of entry to lead-in phase or randomized phase (for express patients). N=1090 unless otherwise noted.
| Variable | 1st Quintile 10–57 | 2nd Quintile 58–89 | 3rd Quintile 90–139 | 4th Quintile 140–230 | 5th Quintile 231–2000 | p value for trend |
|---|---|---|---|---|---|---|
| N patients | 228 | 216 | 219 | 208 | 219 | |
| Patient characteristics | ||||||
| Age years | 50.4 (7.3) | 50.3 (7.9) | 50.1 (7.3) | 50.0 (7.4) | 49.0 (6.7) | 0.059 |
| Male (%) | 57.9% | 70.4% | 73.5% | 75.5% | 83.1% | <0.0001 |
| Race (%) | <0.0001 | |||||
| White | 82.5% | 78.7% | 74.4% | 72.6% | 62.1% | |
| Black | 9.7% | 10.7% | 11.9% | 19.7% | 25.1% | |
| Hispanic | 4.4% | 7.9% | 10.1% | 5.8% | 11.4% | |
| Other | 3.5% | 2.8% | 3.7% | 1.9% | 1.4% | |
| BMI (kg/m2) | 29.3 (5.8) | 29.6 (5.0) | 29.9 (5.4) | 30.2 (5.8) | 29.8 (5.0) | 0.14 |
| Diabetes (%) | 17.1% | 21.8% | 23.7% | 25.5% | 32.0% | 0.0002 |
| Previous ribavirin treatment (%) | 70.6% | 65.7% | 68.5% | 76.0% | 77.6% | 0.013 |
| Esophageal varices (N=743) | 22.6% | 23.9% | 23.2% | 25.0% | 28.7% | 0.22 |
| Prescription medication use (N=1045) | ||||||
| Any, % | 72.4% | 72.2% | 80.8% | 78.9% | 79.5% | 0.021 |
| Anti-epileptic, % | 3.1% | 4.2% | 4.1% | 3.9% | 2.7% | 0.81 |
| Ever smoked, % (N=1066) | 78.9% | 71.4% | 71.0% | 78.5% | 81.6% | 0.19 |
| Ever drank, % (N=1085) | 78.0% | 80.9% | 83.4% | 88.0% | 89.5% | 0.0001 |
| Drinking at baseline, % | 14.9% | 15.7% | 20.1% | 20.2% | 22.8% | 0.015 |
| Lifetime drinks (N=1085) | 18,451 (35,392) | 16,056 (22,619) | 18,728 (31,667) | 20,013 (36,342) | 19,817 (27,330) | 0.32 |
| Coffee cups per day (%)(N=848) | 0.0011 | |||||
| Non-drinkers | 15.7% | 14.6% | 13.5% | 13.0% | 18.1% | |
| <1, | 20.2% | 30.4% | 31.0% | 27.8% | 33.7% | |
| 1-<3 | 42.7% | 38.0% | 41.5% | 46.3% | 40.4% | |
| ≥ 3 cups/day | 21.4% | 17.0% | 14.0% | 13.0% | 7.8% | |
| Laboratory values | ||||||
| IL28B rs12979860 (N=983) | <0.0001 | |||||
| CC, % | 45.4% | 34.3% | 22.7% | 13.1% | 10.1% | |
| CT, % | 41.0% | 49.0% | 54.0% | 57.4% | 61.8% | |
| TT, % | 13.7% | 16.7% | 23.2% | 29.5% | 28.1% | |
| PNPLA3 rs738409 (N=989 | 0.31 | |||||
| CC, % | 54.9% | 53.5% | 54.0% | 51.6% | 53.2% | |
| CG, % | 39.8% | 36.4% | 37.0% | 41.3% | 35.3% | |
| GG, % | 5.3% | 10.1% | 9.0% | 7.1% | 11.4% | |
| Hemoglobin (g/dL) | 14.6 (1.4) | 15.0 (1.4) | 15.0 (1.4) | 15.2 (1.4) | 15.4 (1.2) | <0.0001 |
| Neutrophils (X103/mm3) | 3.3 (1.4) | 3.3 (1.4) | 3.2 (1.3) | 3.1 (1.3) | 2.9 (1.2) | 0.0013 |
| Platelets (X103/mm3) | 181 (65) | 167 (60) | 169 (66) | 170 (70) | 155 (61) | 0.0002 |
| AST (IU/L) | 63.1 (45) | 74.7 (42) | 90.6 (51) | 97.6 (63) | 126.7 (84) | <0.0001 |
| ALT (IU/L) | 85.2 (66) | 101.9 (61) | 113.3 (76) | 126.0 (88) | 154.6 (102) | <0.0001 |
| Alkaline phosphatase (IU/L) | 79.5 (28) | 86.2 (33) | 100.0 (41) | 104.4 (42) | 118.3 (52) | <0.0001 |
| APRI | 1.04 (1.12) | 1.37 (1.26) | 1.61 (1.49) | 1.75 (1.70) | 2.39 (2.23) | <0.0001 |
| AST/ALT | 0.80 (0.26) | 0.80 (0.28) | 0.87 (0.30) | 0.85 (0.30) | 0.88 (0.29) | 0.0006 |
| AFP (ng/mL) | 6.0 (8.4) | 12.9 (26.4) | 16.5 (26.1) | 16.3 (25.7) | 24.9 (32.0) | <0.0001 |
| Total bilirubin, mg/dL | 0.68 (0.33) | 0.81 (0.44) | 0.79 (0.41) | 0.80 (0.42) | 0.87 (0.42) | <0.0001 |
| Albumin (g/L) | 3.95 (0.38) | 3.96 (0.39) | 3.84 (0.38) | 3.87 (0.38) | 3.82 (0.42) | <0.0001 |
| Prothrombin time (INR) | 1.02 (0.09) | 1.04 (0.13) | 1.04 (0.11) | 1.03 (0.09) | 1.04 (0.11) | 0.23 |
| Ferritin (ng/mL) | 172 (139) | 266 (254) | 294 (261) | 421 (394) | 571 (554) | <0.0001 |
| Serum bile acids (μmol/L) | 11.1 15.3) | 12.3 (13.4) | 19.0 (23.3) | 19.2 (23.3) | 21.5 (22.5) | <0.0001 |
| HOMA IR (N=1087) | 12.5 (21) | 14.1 (22) | 14.7 (18) | 17.0 (30) | 20.0 (26) | 0.0004 |
| HCV genotype | 0.18* | |||||
| Genotype 1, % | 84.7% | 89.8% | 89.5% | 90.9% | 88.6% | |
| Genotype 2, % | 9.7% | 3.7% | 2.3% | 4.3% | 4.1% | |
| Genotype 3, % | 4.8% | 5.6% | 6.9% | 2.9% | 4.6% | |
| Other genotype, % | 0.9% | 0.9% | 1.4% | 1.9% | 2.7% | |
| HCV RNA (Log10 IU/mL) | 6.49 (0.62) | 6.45 (0.56) | 6.37 (0.51) | 6.41 (0.45) | 6.39 (0.47) | 0.023 |
| Histologic Findings (N=1088) | ||||||
| Hepatic Steatosis (%) | <0.0001 | |||||
| <1 | 39.9% | 20.5% | 13.7% | 9.6% | 10.1% | |
| 1–5 | 40.8% | 48.4% | 48.0% | 36.1% | 34.9% | |
| 6–33 | 17.1% | 23.7% | 31.5% | 40.4% | 42.2 | |
| >=34 | 2.2% | 7.4% | 6.9% | 13.9% | 12.8% | |
| Cirrhosis (%) | 25.4% | 35.2% | 43.8% | 42.8% | 42.9% | <0.0001 |
| Ishak fibrosis score | 3.6 (1.2) | 4.0 (1.2) | 4.2 (1.3) | 4.1 (1.3) | 4.3 (1.2) | <0.0001 |
| Ishak inflammation score | 7.0 (2.2) | 7.4 (2.0) | 7.7 (2.0) | 7.6 (2.0) | 7.9 (2.1) | <0.0001 |
| Periportal injury | 2.5 (1.0) | 2.7 (0.9) | 2.8 (1.0) | 2.7 (0.9) | 2.9 (0.9) | <0.0001 |
| Parenchymal injury | 2.7 (0.9) | 2.5 (0.8) | 2.6 (0.9) | 2.7 (0.8) | 2.8 (0.9) | <0.0001 |
| Portal inflammation | 2.2 (0.7) | 2.2 (0.8) | 2.2 (0.8) | 2.2 (0.7) | 2.2 (0.7) | 0.96 |
| Mallory bodies (%) | 6.1% | 7.0% | 13.2% | 16.8% | 25.7% | <0.0001 |
| Hepatocellular iron grade >1 (%) | 7.0% | 8.4% | 8.2% | 10.1% | 11.0% | 0.11 |
| Adherence during lead-in | ||||||
| Pegylated IFN > 80% of prescribed dose | 71.1% | 74.5% | 67.1% | 63.5% | 65.3% | 0.025 |
| Ribavirin > 80% of prescribed dose | 65.4% | 69.9% | 63.5% | 68.8% | 68.0% | 0.67 |
| Pegylated IFN and ribavirin > 80% of prescribed dose | 50.4% | 58.8% | 50.7% | 51.9% | 49.3% | 0.41 |
APRI AST/Platelet ratio index;
Genotype 1 versus others
Table 2.
Cross-sectional associations with GGT quintile (1–5) at initial examination. Multivariate linear regression with backwards selection based on p<0.05 (n=981)
| Variable | Parameter Estimate | SE | F-statistic | Pr>F |
|---|---|---|---|---|
| Intercept | −0.673 | 0.281 | 5.77 | 0.017 |
| Male | 0.612 | 0.087 | 49.00 | <0.0001 |
| Non-Hispanic black | 0.214 | 0.104 | 4.21 | 0.040 |
| IL28B rs12979860 CC | −0.804 | 0.084 | 91.26 | <0.0001 |
| Genotype 1 | 0.261 | 0.110 | 5.60 | 0.018 |
| ALT per 100 IU | 0.477 | 0.070 | 47.16 | <0.0001 |
| Alkaline phosphatase per 100 IU | 0.715 | 0.092 | 73.04 | <0.0001 |
| AST/ALT | 0.878 | 0.171 | 26.3 | <0.0001 |
| AFP per 10 ng/ml | 0.048 | 0.016 | 9.53 | 0.002 |
| APRI | −0.083 | 0.035 | 5.63 | 0.018 |
| Log10 Ferritin | 0.600 | 0.086 | 48.46 | <0.0001 |
| Hepatic steatosis (4 levels) | 0.343 | 0.042 | 80.68 | <0.0001 |
APRI AST/Platelet ratio index
An independent association of GGT activity with cirrhosis as the dependent variable was found in an analysis that added GGT quintile to a model with 3 variables (platelet count, aspartate aminotransferase (AST)/ALT ratio, and INR) that had previously been shown to be associated with cirrhosis.8 For each quintile increase in GGT activity, there was a corresponding 1.13 increase in the odds of cirrhosis (95% CI 1.03–1.25, p=0.012).
Treatment Response in the Lead-in Phase
In univariate analysis, GGT activity quintile was strongly associated with lower week 12 early virological response, week 20 response, and with diminished SVR (p<0.0001 for all) (Figure 1). For example, 25.4% of patients in the lowest quintile of GGT had SVR, compared with only 6.9% in the highest quintile. In multivariate analysis increased GGT activity remained strongly associated with poorer treatment response when controlling for other independent predictors of response. For example, at week 20 of therapy, the odds ratio for virological response per quintile increase in GGT activity was 0.63 (95% CI = 0.55–0.72, p<0.0001) when controlling for cirrhosis, previous ribavirin use, AST/ALT, AST, albumin, platelet count, IL28B genotype rs12979860, HCV genotype 1, and log HCV RNA level of ≥6.
Figure 1.
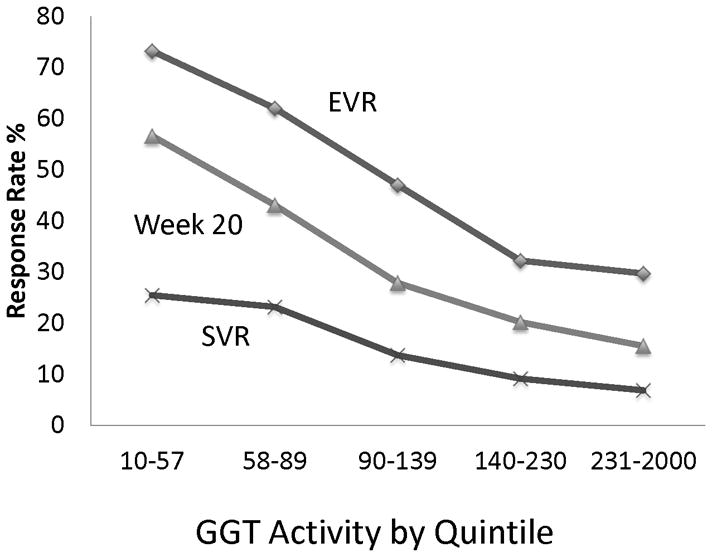
Association of quintile of GGT activity (IU/L) with probability of virological response during the lead-in phase of HALT-C. EVR early virological response. SVR sustained virological response.
Among the co-variates associated with treatment response, only IL28B genotype rs12979860 demonstrated a statistically significant interaction with GGT activity at all time points (p<0.05). Therefore, the combined effect of GGT and IL28B genotype rs12979860 with treatment outcome was further examined (Figure 2). As expected, CC homozygote patients had high rates of virological response. However, in this group, there was not a statistically significant association of GGT activity with virological response. In contrast, CT heterozygote and TT homozygote patients had lower rates of virological response with increasing quintile of GGT. At the extremes, SVR occurred among 30% (74 of 250) of CC homozygote patients and in just 1 of 56 TT homozygote patients in the highest quintile of GGT activity.
Figure 2.
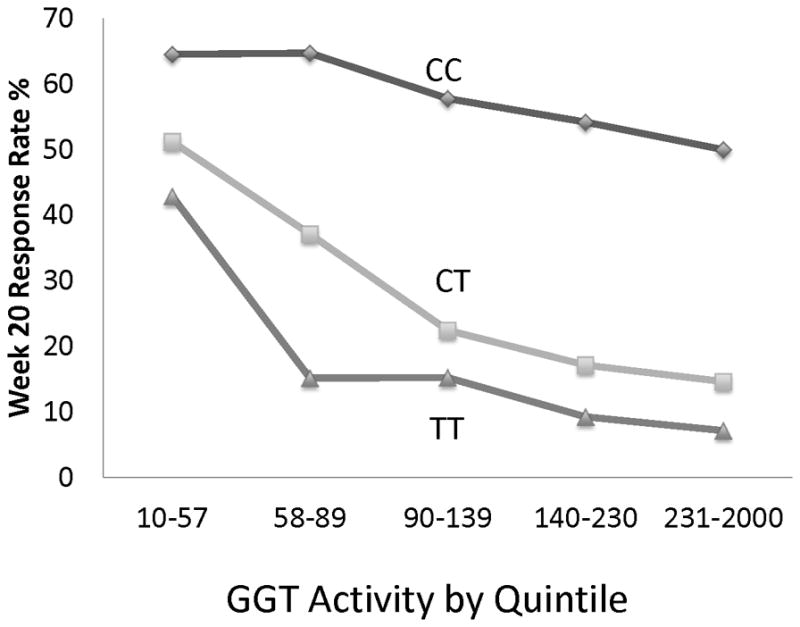
Joint association of quintile of GGT activity (IU/L) and IL28B rs12979860 allele with week 20 virological response during the lead-in phase of HALT-C.
Disease Outcomes
Of the 999 patients who entered the randomized phase and had GGT measured, enzyme activity was associated with the same variables as the patients who entered the lead-in (data not shown). In univariate Cox regression analyses, GGT quintile was associated with any clinical end point (hepatic decompensation, HCC, or death; p<0.0001) as well as with death or liver transplantation (p=0.0003) and with HCC (p=0.027). Cumulative incidence for each clinical outcome after 7 years of observation is shown in Figure 3. There were 518 patients in the randomized phase with GGT measured who were eligible to have a two point increase Ishak fibrosis score (baseline score of <5 and at least one follow-up biopsy). Among these patients, GGT activity was associated with a two point increase in Ishak fibrosis score on paired biopsies (P<0.0001)(Figure 3).
Figure 3.
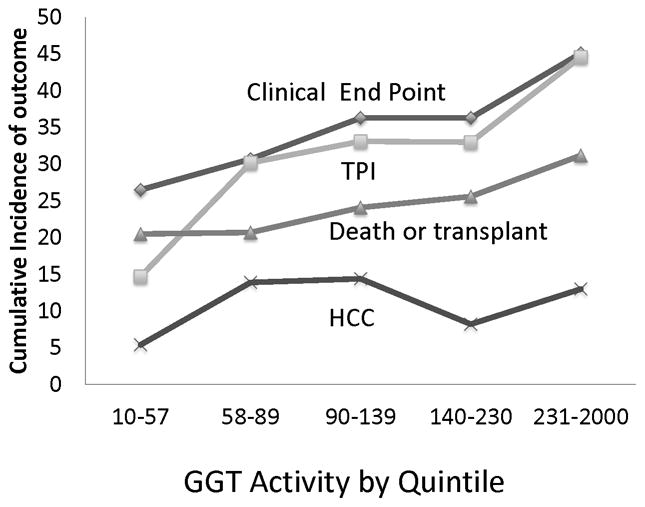
Cumulative incidence of outcomes according to quintile of GGT activity (IU/L): increase of at least two points (TPI) in Ishak fibrosis score on paired biopsies and of any clinical end point (hepatic decompensation, hepatocellular carcinoma, or death), death or transplantation, and HCC (hepatocellular carcinoma) within 7 years.
In multivariate Cox regression analyses, increasing GGT quintile was associated with increased risk of any clinical end point, death or transplantation, two point increase in Ishak fibrosis score (Table 3) and death alone (not shown) when controlling for features previously found to be associated with any end point (platelet count, AST/ALT, albumin, total bilirubin, and fibrosis stage) or with fibrosis progression (body mass index (BMI), platelet count, and hepatic steatosis). Association with HCC was not statistically significant (p=0.46). There were no statistically significant interactions of GGT and other co-variates with any clinical end point, but there was a small positive interaction of GGT and platelet count for increase in fibrosis (p=0.036).
Table 3.
Association of GGT with outcomes
| Univariate Analsis** | Multivariate Analysis | ||||||
|---|---|---|---|---|---|---|---|
| Number of outcomes/ Number at risk | Hazard ratio | 95% CI | p-value | Hazard ratio | 95% CI | p-value | |
| Any end point* | 299/999 | 1.21 | 1.11–1.31 | 0.0001 | 1.14*** | 1.05–1.24 | 0.0024 |
| Death | 133/999 | 1.21 | 1.07–1.38 | 0.0023 | 1.15*** | 1.01–1.30 | 0.035 |
| Death or liver transplant | 202/999 | 1.19 | 1.08–1.32 | 0.0006 | 1.13*** | 1.02–1.25 | 0.019 |
| Hepatocellular carcinoma (HCC) | 83/997 | 1.17 | 1.00–1.37 | 0.053 | 1.07**** | 0.89–1.28 | 0.46 |
| 2 point fibrosis score increase | 146/518 | 1.24 | 1.11–1.39 | 0.0002 | 1.15***** | 1.02–1.30 | 0.023 |
Death, decompensated liver disease, or HCC
Adjusted for treatment group
Adjusted for treatment group, baseline platelet count, AST/ALT ratio, albumin, total bilirubin Ishak fibrosis score
Adjusted for treatment group, cirrhosis, BMI, baseline platelet count, AST, smoking history
Adjusted for BMI, platelet count, and hepatic steatosis
Among the four liver enzymes measured at baseline (GGT, ALT, AST, and alkaline phosphatase), GGT had the most robust association with response to therapy and with disease outcomes. Among the other enzymes, lower AST was an independent predictor of week 20 virological response and alkaline phosphatase was an independent predictor of predictor of HCC. ALT was neither an independent predictor of treatment response or of disease outcome.
Change in GGT activity
We examined change in mean GGT activity with other variables for 809 patients who had GGT measured at baseline and at last biopsy (mean of 3.9 years). Mean GGT changed minimally during this period (−2.1 IU/L, p=0.72), and was unaffected by treatment assignment (p=0.47). Change in GGT activity was positively correlated with changes in histological steatosis (r=0.21, p<0.0001), alkaline phosphatase activity (r=0.24, p<0.0001), ALT activity (r=0.31, p<0.0001), serum ferritin concentration (r=0.25, p<0.0001), and modestly with Ishak inflammation score (r=0.078; p=0.026), but not with change in fibrosis score (r= −004., p=0.25), change in BMI (r=0.03, p=0.39), AST/ALT ratio (r=0.05; p=0.15), or platelet count (r=−0.04; p=0.26). Results were similar irrespective of treatment assignment. Particularly striking was the association with change in steatosis and with alcohol drinking, which were independently associated with change in GGT (p<0.01). The mean change in GGT activity was −42 IU/L for the 274 patients who had a decrease in steatosis, −3 IU/L for the 430 patients with no change, and 44 IU/L for the 189 patients with an increase in steatosis (p<0.0001). The mean change in GGT was −54 IU/L for the 44 patients who reported stopping drinking, −3 IU/L for the 737 patients whose drinking status did not change, and 37 IU/L for the 89 patients who reported that they had started drinking (p=0.019). The association with change in GGT was accentuated when both variables were considered together. The mean change in GGT was −112 IU/L for the 14 patients who stopped drinking and steatosis decreased, 4 IU/L for the 332 patients with no change in drinking or steatosis, and 191 IU/L for the 16 patients who started to drink and steatosis increased (p<0.001).
Discussion
The current report includes several new and confirmatory findings regarding the prognostic significance of GGT activity in chronic HCV. These findings pertain both to treatment response and to disease outcome.
Treatment Response
We confirmed that higher GGT activity is associated with lower probability of virological response to interferon based treatment for HCV. 9–14 Compared with previous studies, HALT-C was unique in its size, prospective patient characterization, and in the homogeneity of the patient population, all of whom had advanced fibrotic liver disease and previous treatment with interferon. All patients underwent a uniform treatment protocol and careful measurement of adherence, neither of which had a meaningful effect on the association of virological response with GGT. A new finding concerned the associations with IL28B rs12979860 genotype and GGT activity with treatment outcome. IL28B rs12979860 is a non-coding single nucleotide polymorphism (SNP) residing 3 kb upstream of the IL28B gene, which encodes IFN-λ.15 GGT was strongly associated with the T allele, whose presence reduces the likelihood of response to therapy. While this finding confirms that of another study,16 it must be noted that previous non-response to prior treatment could have biased the distribution of patients towards an overrepresentation of patients with TT genotype and high GGT. Of greater significance, patients with at least one copy of the T allele had poorer virological response with increasing GGT. In fact, patients homozygous for the T allele and in the highest quintile of GGT had very low on treatment response rate (Figure 2) and almost no chance of sustained virological response. In contrast, CC homozygotes had a favorable response rate that was relatively unaffected by GGT activity. It is not clear why GGT activity appears to potentiate the effect of the rs12979860 genotype.
Disease Outcomes
Among patients with chronic HCV, higher GGT activity has been associated with more severe liver disease in a number of cross-sectional studies.17–23 GGT is also a component of two scores that were constructed for non-invasive evaluation of fibrosis stage.24, 25 However, cross-sectional studies provide inconclusive evidence that GGT is associated with liver disease progression. There are far fewer studies that have evaluated GGT in disease progression, and they were conducted among smaller or more heterogeneous patient populations than HALT-C.26, 27 A common problem with studies of disease progression is that few included GGT in the evaluation of risk factors, perhaps because it was not measured routinely. Therefore, it is significant that the current study demonstrated a robust, increased rate of fibrosis progression and of clinical outcomes among patients with higher GGT. In particular, GGT activity was independent of previously established predictors, including histological features, for fibrosis progression and liver disease outcomes in the HALT-C cohort. 28 GGT activity was also associated with increased risk of death and of liver transplantation. The association was not seen for HCC, perhaps because of different pathways to development of HCC than for other outcomes. However, other studies found an independent association of GGT activity and HCC in the general population and among patients with HCV.27, 29, 30
It is uncertain why GGT is associated with poorer prognosis with chronic hepatitis C, as well as greater severity of other liver diseases and with a number of diverse conditions, such as cardiovascular disease, type 2 diabetes, various malignancies, and overall mortality.2–4, 30–37 One likely reason is that GGT is a marker of oxidative stress, especially in its relationship to glutathione (GSH) metabolism. GSH is a major antioxidant, for which the liver is a net synthesizer.38 Maintenance of a pool of reduced GSH is especially important during periods of oxidative stress. Extracellular GSH and its oxidized form, GSH disulfide, are broken down to their constituent amino acids by GGT and then transported back into cells for re-synthesis of GSH. As the only enzyme of the γ-glutamyl cycle located on the outer surface of plasma membrane, GGT plays a key role in GSH homeostasis by providing cysteine, the rate-limiting substrate, for intracellular synthesis of GSH.39 It has been suggested that catabolism of GSH by GGT results in prooxidant metabolites.40 As an adaptive response to exposure to oxidants, the expression of GGT increases, although the mechanisms for induction are uncertain.41, 42. At the population level, GGT activity has been positively associated with C-reactive protein, a general marker for increased oxidative stress.43
Other Associations
It is interesting that GGT activity was associated with fibrosis stage and cirrhosis at baseline and predicted fibrosis progression, but change in fibrosis score was not associated with change in GGT. Nor was change in GGT activity correlated with changes in platelet count or AST/ALT, which are markers of development of cirrhosis. These findings suggest that GGT is a marker of disease activity, and not merely a reflection of disease severity, such as platelet count, which declines as cirrhosis and portal hypertension develop. This finding provides additional, albeit indirect evidence that GGT reflects a state of oxidative stress in chronic HCV. It is also interesting that ALT was not independently associated with treatment response or with disease progression and that AST was associated with week 20 virological response but not disease progression. Thus, in the setting of HCV associated advanced liver disease, GGT has greater prognostic significance than ALT or AST.
Given the prognostic significance of GGT, we examined other patient characteristics with which GGT was associated, a few of which are stressed here. The mechanisms whereby hepatic steatosis and elevated GGT are associated are not entirely clear, but several have been proposed.44 For example, fatty liver could cause hepatocellular damage that would simulate the synthesis of GGT. Alternatively, excess fat in the liver could enhance oxidative stress, leading to overconsumption of GSH with a compensatory increase in GGT synthesis. Finally, a higher GGT production could be secondary to a low grade hepatic inflammation induced by hepatic steatosis. PNPLA3 genotype was strongly related to steatosis and steatosis strongly related to GGT, but there was not an association of PNLP3 with GGT activity, which was also the case in at least one other study.22 Thus it appears that the mechanism for the relationship of PNPLA3 with steatosis is likely different from that of steatosis with GGT activity. Change in GGT activity was also correlated with change in alcohol consumption, which was expected, given our previous report that demonstrated a change in hepatic steatosis with change in drinking.45 It is interesting that change in alcohol was associated with GGT change independent of change in steatosis. GGT change was inversely associated with coffee consumption, as found in other studies that were not restricted to patients with HCV.46–48 Furthermore, coffee consumption has previously been found to be associated with improved treatment response and slower disease progression in HALT-C. This association deserves greater scrutiny. Ferritin concentration was strongly associated with both baseline GGT and with change in GGT activity. Ferritin is a marker of oxidative stress, which may explain the strong correlation with GGT activity.49
HALT-C provided a strong platform for evaluation of prognostic factors in chronic HCV. Advantages included a large sample size, relatively homogeneous population, careful attention to uniform data collection on a wide variety of variables, and a high patient retention rate. Although GGT activity was strongly associated with treatment response and with disease progression, these results are not necessarily generalizable to all patients with HCV. HALT-C was restricted to patients with advanced liver disease who had not cleared virus with interferon treatment and were motivated to participate in a clinical trial. Furthermore, as new treatments are introduced, GGT may not be as strong a predictor of treatment response. However, given the results of this and other studies, it is likely, that GGT will be associated with poorer response at least as long as interferon based therapy is used.
In conclusion, GGT activity was found to predict treatment response and liver disease outcomes in a large cohort of patients infected with chronic HCV and advanced fibrotic disease. Although confirmation from other studies is needed regarding the prognostic significance of GGT, results of the current study suggest that greater attention should be given to GGT activity.
Acknowledgments
Financial Support
This study was supported by National Institute of Diabetes & Digestive & Kidney Diseases contracts N01-DK-9-2326, N01-DK-9-2324, Contract N01-DK-9-2319, N01-DK-9-2327, N01-DK-9-2320, N01-DK-9-2321, N01-DK-9-2325, N01-DK-9-2323, N01-DK-9-2322, N01-DK-9-2318, and N01-DK-9-2328. Additional financial support was provided by Hoffmann-La Roche, Inc., through a Cooperative Research and Development Agreement (CRADA) with the National Institutes of Health.
Abbreviations
- GGT
γ-glutamyl transferase
- HCV
hepatitis C
- HALT-C
Hepatitis C Anti-viral Treatment Against Cirrhosis Trial
- GSH
glutathione
- SVR
sustained virological response
- AST
aspartate aminotransferase
- HCC
hepatocellular carcinoma
- BMI
body mass index
Footnotes
The content is solely the responsibility of the authors and does not necessarily represent the official views of the National Institutes of Health.
Contributor Information
James E. Everhart, Email: JE17G@NIH.GOV, National Institute of Diabetes and Digestive and Kidney Diseases
Elizabeth C. Wright, Email: wrightel@niddk.nih.gov, National Institute of Diabetes and Digestive and Kidney Diseases
Reference List
- 1.Goldberg DM. Structural, functional, and clinical aspects of gamma-glutamyltransferase. CRC Crit Rev Clin Lab Sci. 1980;12:1–58. doi: 10.3109/10408368009108725. [DOI] [PubMed] [Google Scholar]
- 2.Targher G. Elevated serum gamma-glutamyltransferase activity is associated with increased risk of mortality, incident type 2 diabetes, cardiovascular events, chronic kidney disease and cancer - a narrative review. Clin Chem Lab Med. 2010;48:147–157. doi: 10.1515/CCLM.2010.031. [DOI] [PubMed] [Google Scholar]
- 3.Haring R, Wallaschofski H, Nauck M, Dorr M, Baumeister SE, Volzke H. Ultrasonographic hepatic steatosis increases prediction of mortality risk from elevated serum gamma-glutamyl transpeptidase levels. Hepatology. 2009;50:1403–1411. doi: 10.1002/hep.23135. [DOI] [PubMed] [Google Scholar]
- 4.Ruhl CE, Everhart JE. Elevated serum alanine aminotransferase and gamma-glutamyltransferase and mortality in the United States population. Gastroenterology. 2009;136:477–485. doi: 10.1053/j.gastro.2008.10.052. [DOI] [PubMed] [Google Scholar]
- 5.Di Bisceglie AM, Shiffman ML, Everson GT, Lindsay KL, Everhart JE, Wright EC, Lee WM, et al. Prolonged therapy of advanced chronic hepatitis C with low-dose peginterferon. N Engl J Med. 2008;359:2429–2441. doi: 10.1056/NEJMoa0707615. [DOI] [PMC free article] [PubMed] [Google Scholar]
- 6.Dienstag JL, Ghany MG, Morgan TR, Di Bisceglie AM, Bonkovsky HL, Kim HY, Seeff LB, et al. A prospective study of the rate of progression in compensated, histologically advanced chronic hepatitis C. Hepatology. 2011;54:396–405. doi: 10.1002/hep.24370. [DOI] [PMC free article] [PubMed] [Google Scholar]
- 7.Lee WM, Dienstag JL, Lindsay KL, Lok AS, Bonkovsky HL, Shiffman ML, Everson GT, et al. Evolution of the HALT-C Trial: pegylated interferon as maintenance therapy for chronic hepatitis C in previous interferon nonresponders. Control Clin Trials. 2004;25:472–492. doi: 10.1016/j.cct.2004.08.003. [DOI] [PubMed] [Google Scholar]
- 8.Lok AS, Ghany MG, Goodman ZD, Wright EC, Everson GT, Sterling RK, Everhart JE, et al. Predicting cirrhosis in patients with hepatitis C based on standard laboratory tests: results of the HALT-C cohort. Hepatology. 2005;42:282–292. doi: 10.1002/hep.20772. [DOI] [PubMed] [Google Scholar]
- 9.Weich V, Herrmann E, Chung TL, Sarrazin C, Hinrichsen H, Buggisch P, Gerlach T, et al. The determination of GGT is the most reliable predictor of nonresponsiveness to interferon-alpha based therapy in HCV type-1 infection. J Gastroenterol. 2011;46:1427–1436. doi: 10.1007/s00535-011-0458-y. [DOI] [PubMed] [Google Scholar]
- 10.Coban S, Idilman R, Erden E, Tuzun A. Gamma-glutamyltranspeptidase in predicting sustained virological response in individuals with chronic hepatitis C. Hepatogastroenterology. 2011;58:1301–1306. doi: 10.5754/hge10625. [DOI] [PubMed] [Google Scholar]
- 11.Moraes Coelho HS, Villela-Nogueira CA. Predictors of response to chronic hepatitis C treatment. Ann Hepatol. 2010;9 (Suppl):54–60. [PubMed] [Google Scholar]
- 12.Villela-Nogueira CA, Perez RM, de Segadas Soares JA, Coelho HS. Gamma-glutamyl transferase (GGT) as an independent predictive factor of sustained virologic response in patients with hepatitis C treated with interferon-alpha and ribavirin. J Clin Gastroenterol. 2005;39:728–730. doi: 10.1097/01.mcg.0000174025.19214.32. [DOI] [PubMed] [Google Scholar]
- 13.Bergmann JF, Vrolijk JM, van der Schaar P, Vroom B, van Hoek B, van der Sluys V, de Vries RA, et al. Gamma-glutamyltransferase and rapid virological response as predictors of successful treatment with experimental or standard peginterferon-alpha-2b in chronic hepatitis C non-responders. Liver Int. 2007;27:1217–1225. doi: 10.1111/j.1478-3231.2007.01540.x. [DOI] [PubMed] [Google Scholar]
- 14.Kurosaki M, Matsunaga K, Hirayama I, Tanaka T, Sato M, Yasui Y, Tamaki N, et al. A predictive model of response to peginterferon ribavirin in chronic hepatitis C using classification and regression tree analysis. Hepatol Res. 2010;40:251–260. doi: 10.1111/j.1872-034X.2009.00607.x. [DOI] [PubMed] [Google Scholar]
- 15.Ge D, Fellay J, Thompson AJ, Simon JS, Shianna KV, Urban TJ, Heinzen EL, et al. Genetic variation in IL28B predicts hepatitis C treatment-induced viral clearance. Nature. 2009;461:399–401. doi: 10.1038/nature08309. [DOI] [PubMed] [Google Scholar]
- 16.Agundez JA, Garcia-Martin E, Maestro ML, Cuenca F, Martinez C, Ortega L, Carballo M, et al. Relation of IL28B Gene Polymorphism with Biochemical and Histological Features in Hepatitis C Virus-Induced Liver Disease. PLoS One. 2012;7:e37998. doi: 10.1371/journal.pone.0037998. [DOI] [PMC free article] [PubMed] [Google Scholar]
- 17.Hwang SJ, Luo JC, Lai CR, Chu CW, Tsay SH, Lu CL, Wu JC, et al. Clinical, virologic and pathologic significance of elevated serum gamma-glutamyl transpeptidase in patients with chronic hepatitis C. Chung Hua I Hsueh Tsa Chih (Taipei) 2000;63:527–535. [PubMed] [Google Scholar]
- 18.Paolicchi A, Marchi S, Petruccelli S, Ciancia E, Malvaldi G, Pompella A. Gamma-glutamyltransferase in fine-needle liver biopsies of subjects with chronic hepatitis C. J Viral Hepat. 2005;12:269–273. doi: 10.1111/j.1365-2893.2005.00579.x. [DOI] [PubMed] [Google Scholar]
- 19.Papatheodoridis GV, Chrysanthos N, Savvas S, Sevastianos V, Kafiri G, Petraki K, Manesis EK. Diabetes mellitus in chronic hepatitis B and C: prevalence and potential association with the extent of liver fibrosis. J Viral Hepat. 2006;13:303–310. doi: 10.1111/j.1365-2893.2005.00677.x. [DOI] [PubMed] [Google Scholar]
- 20.Silva IS, Ferraz ML, Perez RM, Lanzoni VP, Figueiredo VM, Silva AE. Role of gamma-glutamyl transferase activity in patients with chronic hepatitis C virus infection. J Gastroenterol Hepatol. 2004;19:314–318. doi: 10.1111/j.1440-1746.2003.03256.x. [DOI] [PubMed] [Google Scholar]
- 21.Uchimura Y, Sata M, Kage M, Abe H, Tanikawa K. A histopathological study of alcoholics with chronic HCV infection: comparison with chronic hepatitis C and alcoholic liver disease. Liver. 1995;15:300–306. doi: 10.1111/j.1600-0676.1995.tb00689.x. [DOI] [PubMed] [Google Scholar]
- 22.Valenti L, Rumi M, Galmozzi E, Aghemo A, Del MB, De NS, Dongiovanni P, et al. Patatin-like phospholipase domain-containing 3 I148M polymorphism, steatosis, and liver damage in chronic hepatitis C. Hepatology. 2011;53:791–799. doi: 10.1002/hep.24123. [DOI] [PubMed] [Google Scholar]
- 23.Vardar R, Vardar E, Demiri S, Sayhan SE, Bayol U, Yildiz C, Postaci H. Is there any non-invasive marker replace the needle liver biopsy predictive for liver fibrosis, in patients with chronic hepatitis? Hepatogastroenterology. 2009;56:1459–1465. [PubMed] [Google Scholar]
- 24.Poynard T, Morra R, Halfon P, Castera L, Ratziu V, Imbert-Bismut F, Naveau S, et al. Meta-analyses of FibroTest diagnostic value in chronic liver disease. BMC Gastroenterol. 2007;7:40. doi: 10.1186/1471-230X-7-40. [DOI] [PMC free article] [PubMed] [Google Scholar]
- 25.Forns X, Ampurdanes S, Llovet JM, Aponte J, Quinto L, Martinez-Bauer E, Bruguera M, et al. Identification of chronic hepatitis C patients without hepatic fibrosis by a simple predictive model. Hepatology. 2002;36:986–992. doi: 10.1053/jhep.2002.36128. [DOI] [PubMed] [Google Scholar]
- 26.Forns X, Ampurdanes S, Sanchez-Tapias JM, Guilera M, Sans M, Sanchez-Fueyo A, Quinto L, et al. Long-term follow-up of chronic hepatitis C in patients diagnosed at a tertiary-care center. J Hepatol. 2001;35:265–271. doi: 10.1016/s0168-8278(01)00088-5. [DOI] [PubMed] [Google Scholar]
- 27.Ikeda K, Saitoh S, Suzuki Y, Kobayashi M, Tsubota A, Koida I, Arase Y, et al. Disease progression and hepatocellular carcinogenesis in patients with chronic viral hepatitis: a prospective observation of 2215 patients. J Hepatol. 1998;28:930–938. doi: 10.1016/s0168-8278(98)80339-5. [DOI] [PubMed] [Google Scholar]
- 28.Ghany MG, Lok AS, Everhart JE, Everson GT, Lee WM, Curto TM, Wright EC, et al. Predicting clinical and histologic outcomes based on standard laboratory tests in advanced chronic hepatitis C. Gastroenterology. 2010;138:136–146. doi: 10.1053/j.gastro.2009.09.007. [DOI] [PMC free article] [PubMed] [Google Scholar]
- 29.Hu G, Tuomilehto J, Pukkala E, Hakulinen T, Antikainen R, Vartiainen E, Jousilahti P. Joint effects of coffee consumption and serum gamma-glutamyltransferase on the risk of liver cancer. Hepatology. 2008;48:129–136. doi: 10.1002/hep.22320. [DOI] [PubMed] [Google Scholar]
- 30.Van HM, Jassem W, Walldius G, Fentiman IS, Hammar N, Lambe M, Garmo H, et al. Gamma-glutamyltransferase and risk of cancer in a cohort of 545,460 persons - the Swedish AMORIS study. Eur J Cancer. 2011;47:2033–2041. doi: 10.1016/j.ejca.2011.03.010. [DOI] [PubMed] [Google Scholar]
- 31.Rauchenzauner M, Kountchev J, Ulmer H, Pechlaner C, Bellmann R, Wiedermann CJ, Joannidis M. Disturbances of electrolytes and blood chemistry in acute alcohol intoxication. Wien Klin Wochenschr. 2005;117:83–91. doi: 10.1007/s00508-004-0280-0. [DOI] [PubMed] [Google Scholar]
- 32.Holme J, Dawkins PA, Stockley EK, Parr DG, Stockley RA. Studies of gamma-glutamyl transferase in alpha-1 antitrypsin deficiency. COPD. 2010;7:126–132. doi: 10.3109/15412551003631733. [DOI] [PubMed] [Google Scholar]
- 33.Fraser A, Harris R, Sattar N, Ebrahim S, Davey SG, Lawlor DA. Alanine aminotransferase, gamma-glutamyltransferase, and incident diabetes: the British Women’s Heart and Health Study and meta-analysis. Diabetes Care. 2009;32:741–750. doi: 10.2337/dc08-1870. [DOI] [PMC free article] [PubMed] [Google Scholar]
- 34.Fraser A, Harris R, Sattar N, Ebrahim S, Smith GD, Lawlor DA. Gamma-glutamyltransferase is associated with incident vascular events independently of alcohol intake: analysis of the British Women’s Heart and Health Study and Meta-Analysis. Arterioscler Thromb Vasc Biol. 2007;27:2729–2735. doi: 10.1161/ATVBAHA.107.152298. [DOI] [PubMed] [Google Scholar]
- 35.Perry IJ, Wannamethee SG, Shaper AG. Prospective study of serum gamma-glutamyltransferase and risk of NIDDM. Diabetes Care. 1998;21:732–737. doi: 10.2337/diacare.21.5.732. [DOI] [PubMed] [Google Scholar]
- 36.Breitling LP, Claessen H, Drath C, Arndt V, Brenner H. Gamma-glutamyltransferase, general and cause-specific mortality in 19,000 construction workers followed over 20 years. J Hepatol. 2011;55:594–601. doi: 10.1016/j.jhep.2010.12.029. [DOI] [PubMed] [Google Scholar]
- 37.Kazemi-Shirazi L, Endler G, Winkler S, Schickbauer T, Wagner O, Marsik C. Gamma glutamyltransferase and long-term survival: is it just the liver? Clin Chem. 2007;53:940–946. doi: 10.1373/clinchem.2006.081620. [DOI] [PubMed] [Google Scholar]
- 38.Deneke SM, Fanburg BL. Regulation of cellular glutathione. Am J Physiol. 1989;257:L163–L173. doi: 10.1152/ajplung.1989.257.4.L163. [DOI] [PubMed] [Google Scholar]
- 39.Zhang H, Forman HJ, Choi J. Gamma-glutamyl transpeptidase in glutathione biosynthesis. Methods Enzymol. 2005;401:468–483. doi: 10.1016/S0076-6879(05)01028-1. [DOI] [PubMed] [Google Scholar]
- 40.Dominici S, Paolicchi A, Corti A, Maellaro E, Pompella A. Prooxidant reactions promoted by soluble and cell-bound gamma-glutamyltransferase activity. Methods Enzymol. 2005;401:484–501. doi: 10.1016/S0076-6879(05)01029-3. [DOI] [PubMed] [Google Scholar]
- 41.Zhang H, Forman HJ. Redox regulation of gamma-glutamyl transpeptidase. Am J Respir Cell Mol Biol. 2009;41:509–515. doi: 10.1165/rcmb.2009-0169TR. [DOI] [PMC free article] [PubMed] [Google Scholar]
- 42.Liu RM, Hu H, Robison TW, Forman HJ. Differential enhancement of gamma-glutamyl transpeptidase and gamma-glutamylcysteine synthetase by tert-butylhydroquinone in rat lung epithelial L2 cells. Am J Respir Cell Mol Biol. 1996;14:186–191. doi: 10.1165/ajrcmb.14.2.8630269. [DOI] [PubMed] [Google Scholar]
- 43.Lee DH, Jacobs DR., Jr Association between serum gamma-glutamyltransferase and C-reactive protein. Atherosclerosis. 2005;178:327–330. doi: 10.1016/j.atherosclerosis.2004.08.027. [DOI] [PubMed] [Google Scholar]
- 44.Ortega E, Koska J, Salbe AD, Tataranni PA, Bunt JC. Serum gamma-glutamyl transpeptidase is a determinant of insulin resistance independently of adiposity in Pima Indian children. J Clin Endocrinol Metab. 2006;91:1419–1422. doi: 10.1210/jc.2005-1783. [DOI] [PubMed] [Google Scholar]
- 45.Lok AS, Everhart JE, Chung RT, Kim H-Y, Everson GT, Hoefs J, Greenson JK, et al. Evolution of hepatic steatosis in patients with advanced hepatitiis C: findings from the hepatitis C antiviral long-term treatment against cirrhosis trial (HALT-C) Hepatology. 2009;49:1828–1837. doi: 10.1002/hep.22865. [DOI] [PMC free article] [PubMed] [Google Scholar]
- 46.Tanaka K, Tokunaga S, Kono S, Tokudome S, Akamatsu T, Moriyama T, Zakouji H. Coffee consumption and decreased serum gamma-glutamyltransferase and aminotransferase activities among male alcohol drinkers. Int J Epidemiol. 1998;27:438–443. doi: 10.1093/ije/27.3.438. [DOI] [PubMed] [Google Scholar]
- 47.Casiglia E, Spolaore P, Ginocchio G, Ambrosio GB. Unexpected effects of coffee consumption on liver enzymes. Eur J Epidemiol. 1993;9:293–297. doi: 10.1007/BF00146266. [DOI] [PubMed] [Google Scholar]
- 48.Poikolainen K, Vartiainen E. Determinants of gamma-glutamyltransferase: positive interaction with alcohol and body mass index, negative association with coffee. Am J Epidemiol. 1997;146:1019–1024. doi: 10.1093/oxfordjournals.aje.a009230. [DOI] [PubMed] [Google Scholar]
- 49.Lee DH, Zacharski LR, Jacobs DR., Jr Comparison of the serum ferritin and percentage of transferrin saturation as exposure markers of iron-driven oxidative stress-related disease outcomes. Am Heart J. 2006;151:1247. doi: 10.1016/j.ahj.2006.03.009. [DOI] [PubMed] [Google Scholar]