Abstract
Targeted multiplex Imaging Mass Spectrometry utilizes several different antigen-specific primary antibodies, each directly labeled with a unique photocleavable mass tag, to detect multiple antigens in a single tissue section. Each photocleavable mass tag bound to an antibody has a unique molecular weight and can be readily ionized by laser desorption ionization mass spectrometry. This manuscript describes a mass spectrometry method that allows imaging of targeted single cells within tissue using transmission geometry laser desorption ionization mass spectrometry. Transmission geometry focuses the laser beam on the back side of the tissue placed on a glass slide, providing a 2 μm diameter laser spot irradiating the biological specimen. This matrix-free method enables simultaneous localization at the sub-cellular level of multiple antigens using specific tagged antibodies. We have used this technology to visualize the co-expression of synaptophysin and two major hormones peptides, insulin and somatostatin, in duplex assays in beta and delta cells contained in a human pancreatic islet.
Keywords: Targeted multiplex mass spectrometry imaging, laser desorption ionization mass spectrometry, transmission geometry, photocleavable mass tag, antibodies, immunohistochemistry, sub-cellular spatial resolution
Introduction
Laser-based desorption ionization techniques are employed for Imaging Mass Spectrometry (IMS) to provide spatial localization and relative abundance of multiple biomolecules directly from tissue sections1. For MALDI, several thousand mass spectra are acquired directly from a tissue sample and the spatial distribution of each signal can be plotted to produce hundreds of ion images in a single experiment. This type of specific molecular imaging does not require antibodies or other target specific reagents but is some cases these agents can be used to gain new information in IMS studies. Although MALDI IMS has proved to be a very powerful technology, it requires a matrix to effect ablation and shows reduced sensitivity for large proteins (>30 kDa). Targeted multiplex mass spectrometry imaging, using antibodies and having a spatial resolution of approximately 50 μm, has been reported as a complementary method for both MALDI IMS and other imaging technologies2. In this report, specific primary antibodies were conjugated to small reporter mass tags (~m/z 500) that were used to localize neuroendocrine markers in human pancreatic islet. However, the intracellular expression of these markers could not be achieved3. Indeed, the typical size of human pancreatic islets ranges from 25 μm to 400 μm and the diameter of a single endocrine cell is approximately 10 μm.
Current commercial MALDI instruments employ a reflection geometry mode where the laser beam is focused by a lens on the front surface of the sample. To achieve a high spatial resolution, suitable for a subcellular imaging, the laser beam must be focused to a 1–2 μm spot, placing strict limitations on the working focal length of the lens. In reflection geometry the short working distance of a standard objective lens, typically 10–15 mm or less that is required to achieve sub-cellular spatial resolution would interfere with the ion optics in the source. In previous studies, transmission geometry was used to pass the laser beam through a transparent substrate to focus on the back side of the analyte layer4–11. The working distance of the focusing lens is limited only by a transparent substrate thickness, with no significant interference of the ion optics, such as plume obstruction and electric field disturbances. We believe transmission geometry laser ablation for IMS represents a most favorable approach to achieve sub-cellular spatial resolution12.
Islets of Langerhans play a key role in maintaining the appropriate level of glucose in blood; dysfunction or destruction of the some specific cells of the islets is one of the many causes of diabetes. Islets are embedded in the exocrine acinar cells of pancreas, and are composed of several different endocrine cells specialized to produce different hormones. Beta cells represent 82% of the total islet cells and produce insulin, alpha cells (15–20%) produce glucagon, delta cells (3–10%) produce somatostatin, and a few cells (1%) produce pancreatic polypeptide. In tissue, these cell types are difficult to recognize without special staining or immunoassay techniques. Within the cell, hormones are stored in vesicular structures surrounded by a membrane, termed secretory granules13, 14. Some proteins, e.g. chromogranin A (49 kDa) and synaptophysin (34 kDa), are synthesized in islet cells and these can be used as specific functional neuroendocrine cell markers. The functional role of synaptophysin (a glycoprotein) is postulated to be involved in the intracellular transport and release of hormones. This glycoprotein was initially found in small-vesicle membranes of neurons and has also been demonstrated in microvesicles that have been shown to be widely distributed among various endocrine cells15, 16. Synaptophysin is usually imaged in NE cells using immunofluorescence and immunoelectron microscopy. Antibodies against these protein and hormones are commercially available, and immunohistochemical investigation of their expression is routinely done in histopathological laboratories, especially for the functional diagnosis of islet cell tumors of the pancreas17–19. However, both immunofluorescence and immunohistochemistry/electron microscopy have limited multiplexing capacity.
In this study, we have used mass tags with laser based mass spectrometry because of the potential of mass spectrometry to image two tagged antibodies bound to the same tissue section. Mass tags can be released and desorbed by the same laser source in a single experiment where each tag has a different mass that is detected with high sensitivity and specificity20. The use of mass tags with mass spectrometry avoids some of the complications of fluorescence measurements such as overlapping of emission spectra, quenching, and tissue autofluorescence. We have investigated the expression of synaptophysin and its co-localization with peptide hormones such as insulin and somatostatin in human pancreatic endocrine cells at the sub-cellular level. The aim of this work is to demonstrate that targeted IMS in transmission geometry can be used to image a single mammalian cell and study the immunoreactivity of different neuroendocrine marker antigens in a multiplex assay format to simultaneously detect more than one antigen in a specific single cell type.
Materials and methods
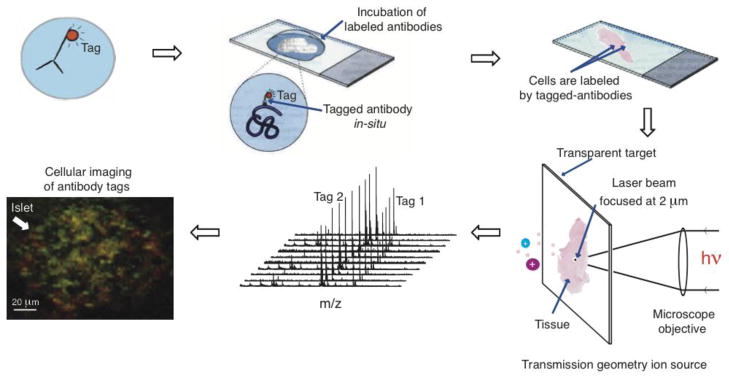
Antibodies against insulin, somatostatin, synaptophysin have been well established and are commercially available from Lab Vision (Thermo Fisher Scientific, MI, USA). Immunohistochemical studies are routinely performed in histopathological laboratory. Antibodies were used as a model system to develop and optimize targeted IMS experiments. Each antibody, specific for a different antigen, was coupled directly with photocleavable mass tags or indirectly with an enzyme-conjugated streptavidin to form an immune complex (IC). In the ‘direct’ assay, the primary antibody carries the photocleavable mass tag and on laser irradiation, this tag is desorbed and ionized and is mapped directly in one process. In the more classical ‘indirect’ assay, a secondary antibody that is biotinylated and coupled through streptavidin to alkaline phosphatase. When a dye is applied to the tissue, a red colored precipitate is formed as a result of the enzyme activity and this precipitate can be directly desorbed and ionized, measured at m/z 323. Since these indirect antibody assays exist in immunohistochemistry, we wanted to employ one together with the direct mass tag assay to evaluate the compatibility of these two assay approaches. A cocktail of ICs specific for different antigens was applied to tissue in a multiplex assay format to detect in a specific single cell different antigens in the same sample. Figure 1 depicts the work flow of the assay illustrating the direct mass tag approach.
Fig. 1.

Concept of direct targeted IMS by LDI in transmission geometry. Antibodies containing laser cleavable mass tags bound to specific antigens in a tissue section and these tags released and measured by LDI MS. In this workflow, a tissue section is fixed onto a glass slide and treated with one or more mass tag antibody reagents and subsequently introduced into the source of the mass spectrometer for laser desorption image analysis. Acquisition of mass spectra in the scanning mode is used to reconstitute images at a specific molecular weight values, illustrated in this scheme for two mass tags shown in red and green in the final image, corresponding to the localization of specific antigens. The yellow color is the result of overlapping of green and red and shows the co-localization of the two proteins.
Photocleavable mass tag synthesis
The synthesis of the photocleavable mass tags, 2,5-dioxopyrrolidin-1-yl-3-{[3-(6-(isopentylamino)-6-oxohexanoyl)-4-methoxyphenyl)bis(4-methoxyphenyl)]methylthio}propanoate (S532) and 2,5-dioxopyrrolidin-1-yl-3-{[tris(4-methoxyphenyl)]methylthio}propanoate (S333), were carried out using the method described by Shchepinov et al21.
Immunohistochemistry enzyme precipitable substrate or indirect approach
Human pancreatic tissues were taken from adult human pancreas specimens undergoing pancreaticoduodenectomy because of carcinoma. Our experiments utilized the non-affected part of pancreas that was normal in histology. We chose antigens known to have dense and weak distribution in endocrine pancreas: anti-insulin (clone INS04) (cat#MS-P1ABX), anti-synaptophysin (clone SP11) (cat#RM-9111-R7), and anti-somatostatin (cat# RB-038-R7), from Lab Vision (Thermo Fisher Scientific, MI, USA).
Frozen sections 8 μm thick, were cut, mounted on glass slides and treated with acetone to immobilize antigens. Nonfat milk at 5% in PBS was used as a blocking reagent. Sections were incubated with a specific primary antibody. After 30 min of incubation at room temperature with the primary antibody, binding was visualized by light microscope using a biotinylated secondary antibody, alkaline phosphatase-conjugated streptavidin and fast red as a chromogen. The colorimetric detection of phosphatase activity was visualized by an inverted microscope CCD camera on the mass spectrometer and then specific cell types were identified.
Immunoassay with photocleavable mass tags
Antibodies were diluted 1:50 in PBS (pH = 7.6) and the pH was adjusted to approximately 8.5 by addition of a mix of triethylamine in carbon dioxide. The mass tag N-hydroxysuccinimide (NHS) esters were dissolved in anhydrous dimethylsulfoxide at a concentration of 10 mM. Two different photocleavable mass tags were used: S532 (Mw = 732), corresponding to a cleaved mass tag of m/z 532, and S333 (Mw = 535), corresponding to a cleaved mass tag of m/z 333. Three μL of mass tag NHS ester (10 mM) was added to the antibody solution (50 μL) at pH ~ 8.5 and the reaction mixture was incubated for 2 hours on ice. Non-reacted mass tags were removed with Micro Bio-Spin Chromatography Columns containing tris buffer (cat#732-6222, Bio-Rad, CA, USA) according to manufacturers’ instructions. After incubation at room temperature for one hour with mass tag-conjugated primary antibodies, slides were washed three times with PBS for five minutes and rinsed once with distilled water. The slides were then mounted directly into an open frame metal MALDI target plate and introduced into the source of the mass spectrometer. Each photocleavable mass tags were released by LDI in transmission geometry from specific antibodies and analyzed, by mass spectrometry. Both IHC enzyme precipitable substrate (indirect approach) and immunoassays with photocleavable mass tags (direct approach) were performed on the same tissue section. In the experiments that follow, the specific mass tags and antibodies used for each assay are noted.
Mass spectrometry analysis
A transmission geometry TOF instrumental setup, similar to that reported11, 12 was employed for these studies. The modified AB SCIEX 4700 MALDI instrument was equipped with a vacuum compatible inverted optical microscope with the z-axis parallel to the central axis of a flight tube to focus a laser beam in the tissue and to ablate/ionize material into the TOF analyzer. A viewport was installed on the back wall of the sample chamber and an opening made in the original translation stage and sample holder to provide delivery of the laser beam and inverted microscope function. The Olympus UPlan 10x microscope objective lens inside the source allowed focusing the laser to 2 μm diameter spot and was mounted on the z-axis translation stage to position the objective focal plane. All residual optics was located outside of the vacuum chamber. The instrument was equipped with a frequency-tripled Nd:YAG laser with a wavelength 355 nm and a repetition rate of 200 Hz.. The target was moved in a 2 μm step raster to generate a mass spectral image data. Biomap version (3.7.5.5) was used to create MS images.
Results and Discussion
We have employed both the direct and indirect antibody assay approaches in this work to evaluate the effectiveness of mixing these approaches, opening the way for use of either or both where antibody reagents are already available.
Single immunolabeling
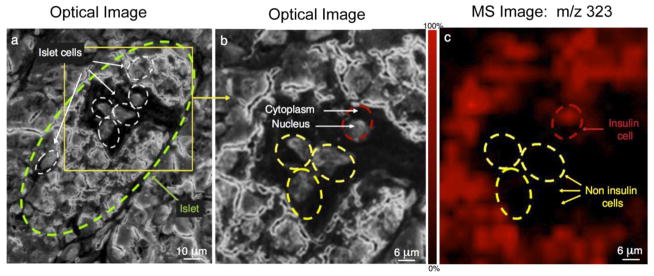
Figure 2 shows the single immunolabeling of insulin using IMS at sub-cellular spatial resolution. In order to visualize pancreatic cells, the tissue was stained with Cresyl Violet and targeted IMS was performed on the same section. Optical images (Figures 2a and 2b) show islet cells in the islet of Langerhans (circled in green in the Figure 2a) and IMS image of m/z 323 (Figure 2c). The ion at m/z 323 is arbitrarily shown in red in Figure 2c and mapped the actual red precipitate from the enzyme coupled antibody complex, revealing the spatial distribution of insulin. The precipitate can be directly desorbed and ionized, measured at m/z 323 and used as a mass tag22. In this experiment insulin positive cells (beta cell) were differentiated from non-insulin cells based on the assay of cytoplasmic insulin using targeted IMS, correlating well with existing knowledge of pancreatic endocrine cell types18.
Fig. 2.

Single labeling by IMS of insulin immunoreactive cells and differentiation of specific cells producing insulin. (a) Optical image of pancreatic cells stained with cresyl violet. Islet cells are circled in green. (b) Detailed optical image of insulin containing cells (red dotted outline) and non-insulin containing cells (yellow dotted outline). (c) Targeted IMS of m/z 323 for insulin immunoreactive cells is arbitrarily shown in red color.
Double immunolabeling
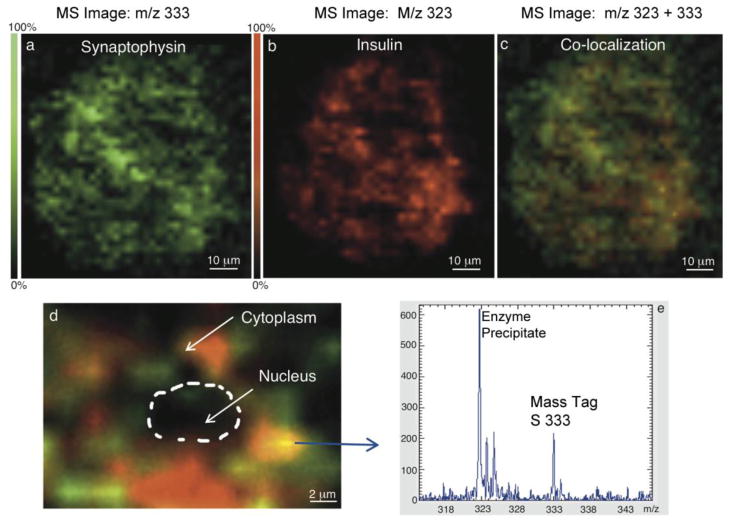
Anti-insulin and anti-synaptophysin antibodies were used to simultaneously detect insulin and synaptophysin, respectively, on the same tissue section. The anti-synaptophysin antibody was conjugated to the mass tag S333. This tagged antibody was applied to tissue section to detect synaptophysin, and binding was detected at m/z 333 (Figure 3a). An alkaline phosphatase precipitable color developer (m/z 323) was used to visualize anti-insulin binding activity as previously described (Figures 3b). Co-localization of these two proteins (insulin and synaptophysin) in the beta cell is shown by the yellow color (red + green) in Figure 3c. Since these experiments were done with high spatial resolution (2 μm), we were able to image the intracellular distribution of these two proteins as shown in Figure 3d.
Fig. 3.
Double labeling by targeted IMS of snaptophysin and insulin in pancreatic cells. (a) snaptophysin immunoreactive cells (m/z 333). (b) Insulin immunoreactive cells (m/z 323). (c) Co-localization (yellow) of synaptophysin (green) and insulin (red). (d) IMS image of the localization of synaptophysin and insulin with 2 μm spatial resolution with the yellow color the result of overlapping of green and red due to co-localization. (e) Mass spectra of the two reporters groups (m/z 323 for the phosphatase precipitable substrate and m/z 333 for the mass tag S333) used to simultaneously image insulin and synaptophysin.
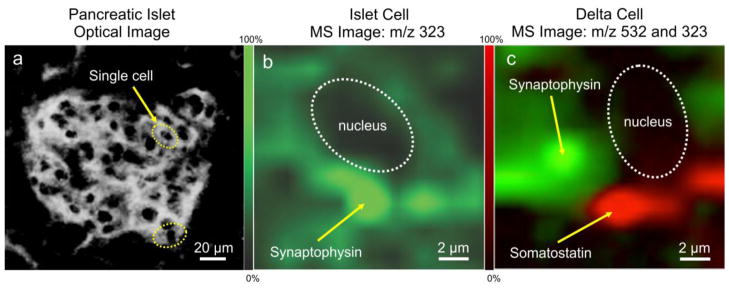
Figure 4 shows the double labeling of somatostatin and synatophysin with mass tag S532 (m/z 532) and with the precipitate (m/z 323), respectively, using targeted IMS at sub-cellular resolution in an islet. This experiment demonstrated that just a few endocrine cells are immunoreactive toward somatostatin. The synaptophysin positive reaction was observed in somatostatin cells (delta cells) and as well in others islet cells. A single cell showing high synaptophysin expression by targeted IMS is shown in Figure 4b. A specific single cell was then imaged to show somatostatin (red) and synaptophysin (green) demonstrating different known cytoplasmic distributions (Figure 4c) with synaptophysin found in microvesicles and somatostatin in secretory granules. Figures 3 and 4 illustrate that synaptophysin was detected in the insulin positive beta cell and also in the somatostatin positive delta cell.
Fig. 4.

Double labeling by targeted IMS of synaptophysin (m/z 323) and somatostatin (m/z 532) in single cells. (a) Optical image of islet cells. (b) Targeted IMS of an immunoreactive islet cell for synaptophysin. (c) Targeted IMS of a delta cell for synaptophysin (green) and somatostatin (red), showing them located in different cellular structures.
Conclusion
We report a matrix-free method for targeted imaging in transmission geometry laser desorption ionization mass spectrometry of human pancreatic islet at sub-cellular spatial resolution for insulin, synaptophysin, and the less abundant protein somastostatin in pancreatic islets cells. Insulin, synaptophysin and somatostatin-14 have MW of 5808, 33800, and 1638 Da, respectively. Targeted IMS allows specific analysis of low abundance species and proteins of both high or low molecular weight in tissue sections. Any antigen, for which a suitable antibody exists, can potentially be studied and multiple antigens can be localized simultaneously. The intracellular co-expression of synaptophysin with two hormone peptides (insulin, somatostatin) has been previously reported and our results correspond well with data obtained by confocal microscopy, reflection fluorescence microscopy, and electron microscopy. Furthermore, the intracellular expression using targeted IMS in transmission geometry of neuroendocrine markers shows that synaptophysin immunoreactivity appears in somatostatin positive cells but on different vesicular structure. This result corresponds to previous studies where synaptophysin was found in microvesicles and somatostatin in secretory granules13, 14, 23–25. Targeted IMS by laser desorption ionization in transmission geometry introduces the possibility of identifying cell types by visualizing several specific proteins and peptide products in a single sample. Moreover, using IHC enzyme precipitable substrates and targeted IMS with photocleavable mass tags, we were able to select a specific single cell in tissue and study the immonureactivities of this cell.
Another advantage of this technology is the combination of classical IHC enzyme precipitable substrates protocols with targeted IMS. The colorimetric detection of enzyme activity facilitates the visualization of specific cell of interest. The coupling of IHC and IMS on the same tissue section is an advantage for studying the immunoreactivity of one specific single cell toward other antigens. This provides a unique opportunity to use enzyme or fluorescent labeled immuno-complexes to select a specific group of cells on tissue by mass spectrometry or/and optical or fluorescent microscopy, respectively, and then study the immunoreactivities of these cells on the same section using mass-tagged antibodies to detect antigens of interest.
Acknowledgments
The authors thank Dr Ray Mernaugh for helpful discussions, Dr Mohamed Abarbri and Dr Junhai Yang for the mass tag synthesis and Anthony L. Frazier for providing the tissue samples. This project was supported by grants from the National Institute of General Medical Sciences (8 P41 GM103391-02 (formerly NCRR 5P41RR031461-02) and 5R01 GM058008-13) from the National Institutes of Health and grant # W81XWH-05-1-0179 from the Department of Defense.
Abbreviations
- MALDI
Matrix Assisted Laser Desorption Ionization
- LDI
Laser Desorption Ionization
- TOF
Time of Flight
- MS
Mass Spectrometry
- IMS
Imaging Mass Spectrometry
- IHC
Immunohistochemistry
- NE
Neuroendocrine
- IC
Immune Complex
References
- 1.Caprioli RM, Farmer TB, Gile J. Molecular imaging of biological samples: localization of peptides and proteins using MALDI-TOF MS. Anal Chem. 1997;69(23):4751–60. doi: 10.1021/ac970888i. [DOI] [PubMed] [Google Scholar]
- 2.Thiery G, Shchepinov MS, Southern EM, Audebourg A, Audard V, Terris B, Gut IG. Multiplex target protein imaging in tissue sections by mass spectrometry - TAMSIM. Rapid Commun Mass Spectrom. 2007;21(6):823–9. doi: 10.1002/rcm.2895. [DOI] [PubMed] [Google Scholar]
- 3.Thiery G, Anselmi E, Audebourg A, Darii E, Abarbri M, Terris B, Tabet JC, Gut IG. Improvements of TArgeted multiplex mass spectrometry IMaging. Proteomics. 2008;8(18):3725–34. doi: 10.1002/pmic.200701150. [DOI] [PubMed] [Google Scholar]
- 4.Bian N, Wang P, Wang Z, Xu L, Church G, Giese RW. Detection via laser desorption and mass spectrometry of multiplex electrophore-labeled albumin. Rapid Communications in Mass Spectrometry. 1997;11(16):1781–1784. doi: 10.1002/(SICI)1097-0231(19971030)11:16<1781::AID-RCM90>3.0.CO;2-F. [DOI] [PubMed] [Google Scholar]
- 5.Galicia MC, Vertes A, Callahan JH. Atmospheric pressure matrix-assisted laser desorption/ionization in transmission geometry. Anal Chem. 2002;74(8):1891–5. doi: 10.1021/ac011098i. [DOI] [PubMed] [Google Scholar]
- 6.Richards AL, Lietz CB, Wager-Miller JB, Mackie K, Trimpin S. Imaging mass spectrometry in transmission geometry. Rapid Commun Mass Spectrom. 2011;25(6):815–20. doi: 10.1002/rcm.4927. [DOI] [PMC free article] [PubMed] [Google Scholar]
- 7.Schurenberg M, Schulz TDK, Hillenkamp F. Matrix-assisted Laser Desorption/Ionization in Transmission Geometry: Instrumental Implementation Mechanistic Implications. Rapid Communications in Mass Spectrometry. 1996;10(15):1873–1880. [Google Scholar]
- 8.Vaeck LV, Struyf H, Roy WV, Adams F. Organic and inorganic analysis with laser microprobe mass spectrometry. Part I: Instrumentation and methodology. Mass Spectrometry Reviews. 1994;13(3):189–208. [Google Scholar]
- 9.Vertes A, Balazs L, Gijbels R. Matrix-assisted Laser Desorption of Peptides in Transmission Geometry. Rapid Commun Mass Spectrom. 1990;4(7):263–266. [Google Scholar]
- 10.Vogt H, Heinen HJ, Meier S, Wechsung R. LAMMA 500 principle and technical description of the instrument. Fresenius Z Journal of Analytical Chemistry. 1981;308(3):195–200. [Google Scholar]
- 11.Zavalin AI, Yang J, Caprioli RM. Tissue Imaging at Submicron Spatial Resolution Using Direct Transmission Geometry MALDI MS. 60th ASMS conference on Mass Spectrometry and Allied Topic; Vancouver, BC, Canada. 2012. [Google Scholar]
- 12.Zavalin A, Todd E, Rawhouser P, Yang J, Caprioli R. Direct Imaging of Single Cells and Tissue at Subcellular Spatial Resolution Using Transmission Geometry MALDI MS. Journal of Mass Spectrometry. 2012 doi: 10.1002/jms.3108. [DOI] [PubMed] [Google Scholar]
- 13.Dannies PS. Protein hormone storage in secretory granules: mechanisms for concentration and sorting. Endocr Rev. 1999;20(1):3–21. doi: 10.1210/edrv.20.1.0354. [DOI] [PubMed] [Google Scholar]
- 14.Portela-Gomes GM, Lukinius A, Grimelius L. Synaptic vesicle protein 2, A new neuroendocrine cell marker. Am J Pathol. 2000;157(4):1299–309. doi: 10.1016/S0002-9440(10)64645-7. [DOI] [PMC free article] [PubMed] [Google Scholar]
- 15.Moriyama Y, Hayashi M, Yamada H, Yatsushiro S, Ishio S, Yamamoto A. Synaptic-like microvesicles, synaptic vesicle counterparts in endocrine cells, are involved in a novel regulatory mechanism for the synthesis and secretion of hormones. J Exp Biol. 2000;203(Pt 1):117–25. doi: 10.1242/jeb.203.1.117. [DOI] [PubMed] [Google Scholar]
- 16.Reetz A, Solimena M, Matteoli M, Folli F, Takei K, De Camilli P. GABA and pancreatic beta-cells: colocalization of glutamic acid decarboxylase (GAD) and GABA with synaptic-like microvesicles suggests their role in GABA storage and secretion. EMBO J. 1991;10(5):1275–84. doi: 10.1002/j.1460-2075.1991.tb08069.x. [DOI] [PMC free article] [PubMed] [Google Scholar]
- 17.Lukinius A, Stridsberg M, Wilander E. Cellular expression and specific intragranular localization of chromogranin A, chromogranin B, and synaptophysin during ontogeny of pancreatic islet cells: an ultrastructural study. Pancreas. 2003;27(1):38–46. doi: 10.1097/00006676-200307000-00006. [DOI] [PubMed] [Google Scholar]
- 18.Portela-Gomes GM, Gayen JR, Grimelius L, Stridsberg M, Mahata SK. The importance of chromogranin A in the development and function of endocrine pancreas. Regulatory Peptides. 2008;151:19–25. doi: 10.1016/j.regpep.2008.07.005. [DOI] [PubMed] [Google Scholar]
- 19.Portela-Gomes GM, Hacker GW, Weitgasser R. Neuroendocrine cell markers for pancreatic islets and tumors. Appl Immunohistochem Mol Morphol. 2004;12(3):183–92. doi: 10.1097/00129039-200409000-00001. [DOI] [PubMed] [Google Scholar]
- 20.Thiery G, Mernaugh RL, Yan H, Spraggins JM, Yang J, Parl FF, Caprioli RM. Targeted Multiplex Imaging Mass Spectrometry with Single Chain Fragment Variable (scfv) Recombinant Antibodies. J Am Soc Mass Spectrom. 2012 doi: 10.1007/s13361-012-0423-x. [DOI] [PMC free article] [PubMed] [Google Scholar]
- 21.Shchepinov MS, Chalk R, Southern EM. Trityl mass-tags for encoding in combinatorial oligonucleotide synthesis. Nucleic Acids Symp Ser. 1999;(42):107–8. doi: 10.1093/nass/42.1.107. [DOI] [PubMed] [Google Scholar]
- 22.Thiery G, Zavalin AI, Caprioli RM. Targeted Multiplex Mass Spectrometry Imaging in Transmission Geometry LDI for a Sub-Cellular Resolution. 58th Annual Conference on Mass Spectrometry; Salt Lake City, Utah. 2010. p. 55. [Google Scholar]
- 23.Leclerc R, Pelletier G, Puviani R, Arimura A, Schally AV. Immunohistochemical localization of somatostatin in endocrine cells of the rat stomach. Mol Cell Endocrinol. 1976;4(4):257–61. doi: 10.1016/0303-7207(76)90059-9. [DOI] [PubMed] [Google Scholar]
- 24.Portela-Gomes GM, Stridsberg M, Johansson H, Grimelius L. Co-localization of synaptophysin with different neuroendocrine hormones in the human gastrointestinal tract. Histochem Cell Biol. 1999;111(1):49–54. doi: 10.1007/s004180050332. [DOI] [PubMed] [Google Scholar]
- 25.Redecker P, Jorns A, Jahn R, Grube D. Synaptophysin immunoreactivity in the mammalian endocrine pancreas. Cell Tissue Res. 1991;264(3):461–7. doi: 10.1007/BF00319036. [DOI] [PubMed] [Google Scholar]


