Background: Metabolites may activate signal transduction pathways that regulate cell metabolism.
Results: Amino acids activate Fru-2,6-P2 synthesis through Akt-dependent phosphorylation of a specific PFKFB2 isoform.
Conclusion: Amino acids regulate Fru-2,6-P2 metabolism via Akt signaling.
Significance: This study shows how signaling and metabolism are inextricably linked.
Keywords: Akt PKB; Amino Acid; Fructose-2,6-bisphosphate; Glycolysis; Phosphofructokinase
Abstract
Reciprocal regulation of metabolism and signaling allows cells to modulate their activity in accordance with their metabolic resources. Thus, amino acids could activate signal transduction pathways that control cell metabolism. To test this hypothesis, we analyzed the effect of amino acids on fructose-2,6-bisphosphate (Fru-2,6-P2) metabolism. We demonstrate that amino acids increase Fru-2,6-P2 concentration in HeLa and in MCF7 human cells. In conjunction with this, 6-phosphofructo-2-kinase activity, glucose uptake, and lactate concentration were increased. These data correlate with the specific phosphorylation of heart 6-phosphofructo-2-kinase/fructose-2,6-biphosphatase (PFKFB2) isoenzyme at Ser-483. This activation was mediated by the PI3K and p38 signaling pathways. Furthermore, Akt inactivation blocked PFKFB2 phosphorylation and Fru-2,6-P2 production, thereby suggesting that the above signaling pathways converge at Akt kinase. In accordance with these results, kinase assays showed that amino acid-activated Akt phosphorylated PFKFB2 at Ser-483 and that knockdown experiments confirmed that the increase in Fru-2,6-P2 concentration induced by amino acids was due to PFKFB2. In addition, similar effects on Fru-2,6-P2 metabolism were observed in freshly isolated rat cardiomyocytes treated with amino acids, which indicates that these effects are not restricted to human cancer cells. In these cardiomyocytes, the glucose consumption and the production of lactate and ATP suggest an increase of glycolytic flux. Taken together, these results demonstrate that amino acids stimulate Fru-2,6-P2 synthesis by Akt-dependent PFKFB2 phosphorylation and activation and show how signaling and metabolism are inextricably linked.
Introduction
Fructose 2,6-bisphosphate (Fru-2,6-P2)4 is a signal metabolite that controls glycolysis. In liver, Fru-2,6-P2 is an activator of 6-phosphofructo-1-kinase (PFK-1) and an inhibitor of fructose-1,6-bisphosphatase (FBPase-1). Therefore, Fru-2,6-P2 plays a unique role in the control of glucose homeostasis by allowing the liver to switch from glycolysis to gluconeogenesis. Most mammalian tissues show low FBPase-1 activity, and Fru-2,6-P2 acts as a signal metabolite that stimulates PFK-1 and, hence, glycolysis when glucose is available (1). The synthesis and degradation of Fru-2,6-P2 are catalyzed by the bifunctional enzyme 6-phosphofructo-2-kinase/fructose-2,6-bisphosphatase (PFKFB). In mammals, the isoforms of this bifunctional enzyme are encoded by four genes (PFKFB1–4) that are characterized by different tissue expression patterns, their kinase to phosphatase activity ratios, and their responses to protein kinases. In cancer cells, the concentration of Fru-2,6-P2 is generally elevated because of overexpression and activation of PFKFB3 and PFKFB4 (2). In prostate cancer cells, androgens also elevate Fru-2,6-P2 concentration by increasing the kinase activity of PFKFB2 (3). This isoform is essential in the regulation of glycolysis in the heart. Thus, adrenaline, insulin, anoxia, and workload stimulate heart glycolysis by activating PFKFB2, thus producing a subsequent rise in Fru-2,6-P2 concentration (1). PFKFB2 activity is regulated by phosphorylation of its C-terminal domain by protein kinases such as 3-phosphoinositide-dependent kinase-1 (PDK-1), cAMP-dependent protein kinase (protein kinase A), protein kinase B (also known as Akt), p70 ribosomal S6 kinase (S6K1), and mitogen-activated protein kinase 1 (MAPK-1). Insulin-induced PFKFB2 activation requires the protein kinase Akt (4).
Fru-2,6-P2 plays an essential role in cell metabolism because it adapts this process to energy demands and nutrient availability. Nutrients such as amino acids stimulate growth/proliferation/survival pathways in a manner dependent on the mammalian target of rapamycin (mTOR). The serine-threonine kinase mTOR interacts with other proteins to form two main functional complexes named mTORC1 and mTORC2. These complexes are regulated by various classes of PI3Ks. Thus, although mTORC1 is regulated by class III, mTORC2 is regulated by class I (5). Both complexes can be activated by amino acids, and starvation conditions allow independent analysis of their activation (6). Given that insulin also activates these two mTOR complexes and that cell metabolism adapts by increasing the Fru-2,6-P2 concentration and, hence, by inducing glycolysis, here we study whether amino acids regulate glycolysis in a similar manner.
To this end, we analyze the effect of amino acids on Fru-2,6-P2 metabolism. We show that these nutrients increase Fru-2,6-P2 synthesis in human cancer cells. This increase correlates with the phosphorylation of PFKFB2 at Ser-483 and requires activation of the PI3K and p38 signaling pathways. Amino acid-activated Akt specifically phosphorylated PFKFB2 at Ser-483, whereas inactivation of Akt blocked PFKFB2 phosphorylation and Fru-2,6-P2 synthesis stimulated by amino acids. siRNA experiments confirmed that the increase in Fru-2,6-P2 concentration induced by amino acids was due to PFKFB2. Similar effects on Fru-2,6-P2 metabolism were observed in freshly isolated rat cardiomyocytes. Taken together, these results show that amino acids increase Fru-2,6-P2 concentration by Akt-mediated PFKFB2 activation.
EXPERIMENTAL PROCEDURES
Reagents
The following reagents were used: insulin, wortmannin, rapamycin, betaine, γ-amino-n-butyric acid, aldolase, α-glycerophosphate dehydrogenase-triosephosphate isomerase, D-fructose-6-phosphate disodium salt, D-glucose-6-phosphate disodium salt, pyrophosphate tetrasodium salt, phorbol 12-myristate-13-acetate (PMA), protein A-peroxidase secondary antibody, ATP, anti-FLAG M2, anti-polyHis and anti-P-ERK1/2 antibodies, culture medium M-199, and HEPES sodium salt (Sigma-Aldrich); 50× minimum essential medium essential amino acids (EAA) and 100× minimum essential medium non-essential amino acid solutions (Invitrogen); 100× l-glutamine solution (Biological Industries); U0126 and SB203580 (Calbiochem); PMA (Biomol); anti-mTOR, anti-p-Thr-308-Akt, anti-p-Ser-473-Akt, anti-Akt, anti-p-Thr-37/46–4E-BP1, anti-p-Thr-24-FOXO1/T32-FOXO3a, anti-p-Thr-389-S6K1 (1A5), anti-p-Thr-334-MAPKAPK-2, and anti-p-Tyr-180/Tyr-182-p38 antibodies (Cell Signaling Technology, Inc.); anti-TSC2 (C-20) and anti-P-S483-PFKFB2 antibodies (Santa Cruz Biotechnology, Inc.); anti-PFKFB2 (C-Term) (Abgent); anti-P-S461-PFKFB3, anti-P-S478-PFKFB3 (7), anti-P-S86-HSP25, and horseradish peroxidase-conjugated secondary antibodies (Invitrogen); protein A-Sepharose and protein G-Sepharose (GE Healthcare); Talon metal affinity resin (BD Biosciences); and Immobilon-P PVDF transfer membrane (Millipore Corp.). Class I PI3K isoform-specific inhibitors (PI3Kβ-selective inhibitor TGX-155 (8) and the PI3Kα-selective inhibitor AS702630 (9)) were provided by Dr. M. Camps (Merck Serono). Akt inhibitor VIII, isozyme-selective and Akti-1/2 were from Calbiochem). 3-O-[14C]methyl-D-glucose was from PerkinElmer Life Sciences. [5-3H]-D-glucose and 3H2O were from American Radiolabeled Chemicals. His-PFKFB2 was a gift from Dr. M. H. Rider (10). The FLAG-PFKFB3 plasmid expression vector was generated using Gateway technology following the protocol of the manufacturer (Invitrogen).
Cell Culture and Transfection
HeLa, MCF-7, and HEK293 cells were cultured at 37 °C in DMEM (Invitrogen) with 10% fetal bovine serum. HEK293 cells were transfected using the calcium phosphate transfection system. Cell treatments such as serum starvation, amino acid deprivation, and insulin or amino acid stimulation were performed as reported previously (6, 11). For experiments with insulin or the phorbol ester PMA, cells were deprived of serum overnight and then incubated with 200 nm insulin or 10 nm PMA for 30 min. For experiments with amino acids, after overnight serum deprivation, cells were incubated for an additional 2 h with Dulbecco's phosphate-buffered saline (DPBS) (Invitrogen) or, when noted, after overnight serum deprivation, cells were incubated for an additional 2 h with DMEM without amino acids (DMEM(-AA)) (6, 11). Cells were then stimulated with an amino acid solution for 30 min (we added a mix of commercial solutions of EAA, non-essential amino acids, and l-glutamine (Gln) diluted to 1× final concentration from their stock solutions (50×, 100×, and 100×, respectively). The final concentration of amino acids in the cells (1×)) is identical to that found in the standard minimum essential medium. Before stimulation with amino acids or insulin, the specific inhibitors were added for 60 min at a final concentration of 20 nm rapamycin, 100 nm wortmannin, 5 μm U0126, 10 μm SB 203580, 10 μm Akti-1/2, and 1 μm for specific inhibitors of the PI3K isoform.
Cardiomyocyte Isolation
Adult cardiomyocytes were isolated from Sprague-Dawley male rats (300 g) that were handled following the European Directive on the Welfare of Research Animals (2010/63/EU). After deep anesthesia (150 mg/kg sodium pentobarbital, intraperitoneally), hearts were rapidly excised and retrogradely perfused via the aorta for 20 min with a modified Krebs buffer (110 mmol/liter NaCl, 2.6 mmol/liter KCl, 1,2 mmol/liter KH2PO4, 1.2 mmol/liter MgSO4, 25 mmol/liter NaHCO3, 11 mmol/liter glucose) containing 25 μmol/liter CaCl2 and 0.03% type II collagenase. Dissociated tissue was subjected to several centrifugation steps to remove endothelial cells and fibroblasts, and extracellular Ca2+ was progressively normalized up to 1 mmol/liter. Rod-shaped cardiac myocytes were selected in a 4% BSA gradient and plated on plastic-bottomed culture dishes with 199/HEPES medium. After seeding, cells were incubated for 2 h with DPBS before amino acids were added as above.
Cell Lysate and Immunoblotting
For Western blot assays, treated cells were lysed and processed as described previously (11). To simultaneously analyze large (e.g. mTOR) and small (e.g. HSP25) proteins in the same SDS/PAGE gel, we used Tris-Acetate PAGE systems (12, 13). Band intensities were analyzed with a gel documentation system (LAS-3000, Fujifilm). Protein levels were normalized with respect to mTOR, TSC2, PFKFB2, or Akt levels and expressed as a percentage of controls.
Immunoprecipitations and Kinase Assay
Lysates from HeLa cells were immunoprecipitated with anti-Akt antibody. Washed immunoprecipitates were used for in vitro kinase assays using previously purified His-PFKFB2 and FLAG-PFKFB3 as substrates. All kinase assays were performed as described by Garcia-Martinez and Alessi (14) with the following modifications. Akt immunoprecipitation was performed for 2 h, and the kinase assay for 30 min at 37 °C. His-PFKFB2 and FLAG-PFKFB3 proteins were purified from transfected HEK293 cells previously starved of serum and amino acids by pull-down with Talon metal affinity resin and by immunoprecipitation with anti-FLAG antibody, respectively. Band intensities were quantified with a gel documentation system (LAS-3000, Fujifilm).
Glucose Uptake
Cells were treated as described previously (15). One minute before the end of the treatment, 2.5 μl of radioactive 3-O-[14C]methyl-D-glucose was added to the medium, and the reaction was stopped by four washes with PBS. Then 300 μl of 0.05 m NaOH was added to each well, and the plates were mixed gently. The plates were incubated for 2 h at 37 °C to lyse the cells. Cell lysates were transferred into a scintillation vial containing 5 ml of liquid scintillation, and the radioactivity was quantified using a scintillation counter. 20 μl of cell lysate was kept to quantify protein concentration. 2.5 μl of radioactive 3-O-[14C]methyl-D-glucose was also counted as a control.
Fructose-2,6-bisphosphate Measurement Assay
Treated cells were lysed with 100 mm NaOH/0.1% Triton X-100. Fru-2,6-P2 was determined as described previously (16, 17).
Lactate Determination
Extracellular lactate was measured spectrophotometrically from 0.5 ml of supernatant from cells treated with amino acids, as indicated above, using standard enzymatic methods (18).
ATP Measurement
Cells were treated as described previously and then centrifuged at 25 × g for 2 min. The pellet was resuspended in somatic cell ATP-releasing reagent (Sigma). ATP was determined in the pellet and supernatant as described in Atlante et al. (19) with some modifications. The composition of the assay buffer used was 10 mm phosphate buffer (pH 8), 2.5 mm glucose, hexokinase-glucose-6-phosphate dehydrogenase (0.5 specific units) and 0.2 mm NADP. Changes in fluorescence at 450 nm were monitored, indicating the NADPH production, which is proportional to the ATP content of the sample. We used a calibration curve with known concentrations of ATP to determine the concentration of ATP of the samples.
Measurement of Glycolysis
The glycolytic rate was determined by measuring the conversion of [5-3H]D-glucose to 3H2O (20, 21). Briefly, cells were incubated with 5 μCi of [5-3H]D-glucose at 37 °C for 30 min. Following incubation, triplicate 50-μl aliquots were transferred to uncapped PCR tubes containing 50 μl of 0.2 N HCl, and each tube was transferred to a scintillation vial containing 0.5 ml of H2O so that the water in the vial and the contents of PCR tube were not allowed to mix. The vials were sealed, and the diffusion took place for 24 h at 50 °C. The amount of diffused and undiffused 3H2O was determined by scintillation counting and compared with controls of [5-3H]D-glucose and 3H2O alone.
Statistical Analysis
Results are expressed as mean ± S.E. Data for multiple variable comparisons were analyzed by one-way analysis of variance. For comparison of significance, Dunn's test was used as a post hoc test in accordance with the statistical program GraphPad Prism.
RESULTS
Amino Acids Increase Fru-2,6-P2 Content
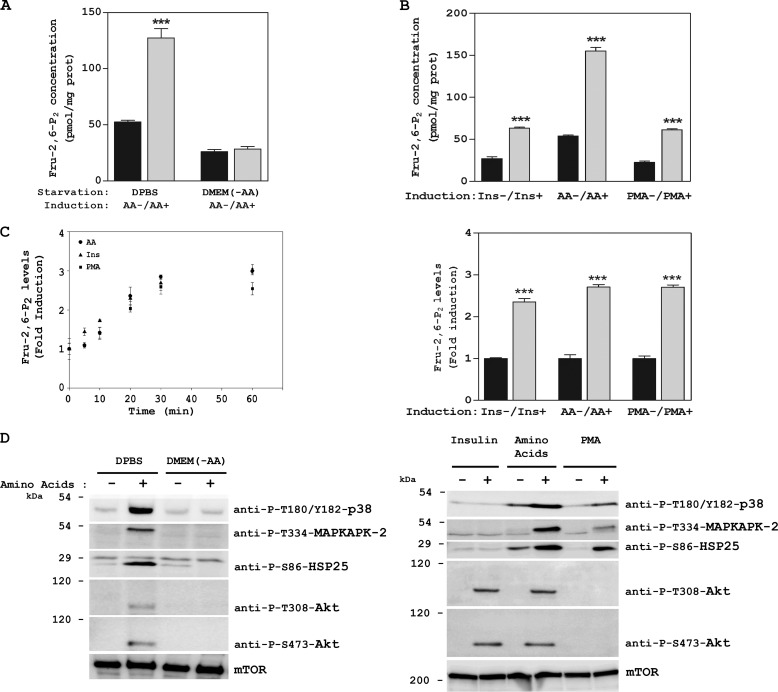
We have reported that amino acid signaling mechanisms depend on starvation conditions. Starvation with DPBS involves mTORC2, whereas starvation with DMEM without amino acids (DMEM (-AA)) involves mTORC1 (6). Here we used these two starvation conditions to deprive cells of amino acids. Thus, after overnight serum deprivation, HeLa cells were incubated for 2 h with DPBS or with DMEM (-AA). Next they were stimulated with amino acids (AA) for 30 min and Fru-2,6-P2 concentrations were analyzed as described in the experimental procedures. The concentrations of this signal metabolite increased in the presence of amino acids only when the cells had been starved with DPBS (Fig. 1A). No changes were observed with DMEM (-AA). Other stimuli, such as insulin or the phorbol ester PMA, also raised Fru-2,6-P2 concentrations (1). We compared the increase in Fru-2,6-P2 induced by amino acids and by those stimuli. Although the basal Fru-2,6-P2 concentration was higher after amino acid depletion, a similar induction of Fru-2,6-P2 (fold induction) was observed with the addition of amino acids, insulin, or PMA for 30 min (Fig. 1B). The time course of the Fru-2,6-P2 increase was also similar, being rapid (5–10 min) and reaching maximum levels at 30 min (Fig. 1C).
FIGURE 1.
Fru-2,6-P2 concentration is increased by amino acids. A–D, after overnight serum deprivation, HeLa cells were depleted of amino acids (starvation) by incubation with DPBS or DMEM (-AA) for 2 h. They were then stimulated with AAs 1× for 30 min (A, B, and D) or for the indicated times (C), and Fru-2,6-P2 concentration was measured. Stimulation with insulin (Ins) or the phorbol ester PMA was performed after overnight serum deprivation for 30 min. Cellular lysates were analyzed by Western blot analysis with the indicated antibodies. Molecular weight markers are indicated on the left. Values are the means ± S.E. for at least three independent experiments. ***, p < 0.001.
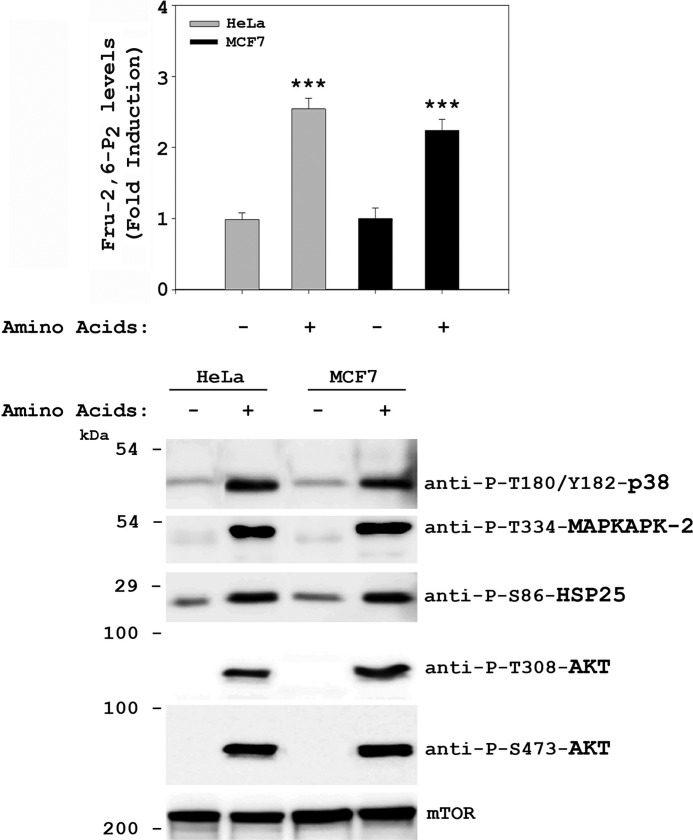
To analyze the signaling pathways involved in the Fru-2,6-P2 increase after amino acid addition, we checked the activation of two well known kinases involved in the regulation of Fru-2,6-P2, namely MAPKAPK-2 and Akt (10, 22). This activation was analyzed through immunoblotting using specific antibodies against the phosphorylated forms of these kinases. Thirty minutes after amino acid addition, we observed the activation of Akt via PI3K (Akt phosphorylation at Thr-308 by PDK1) and mTORC2 (Akt phosphorylation at Ser-473) and the activation of MAPKAPK-2 (phosphorylation at Thr-334) (Fig. 1D, left panel). Given that the kinase p38 has been reported to mediate the activation of MAPKAPK-2 (23), we also analyzed its activation. An increase in p38 activity was detected (phosphorylations at Thr-180 and Tyr-182) (Fig. 1D, left panel). Activation of MAPKAPK-2 was also confirmed by phosphorylation of its known-substrate HSP25 at Ser-86 (24) (Fig. 1D, left panel). These phosphorylations mediated by amino acids were observed only when the cells had been starved previously with DPBS. No changes were observed with DMEM (-AA) (Fig. 1D, left panel). We also analyzed the stimulation of these proteins by insulin and by PMA (Fig. 1D, right panel). Interestingly, insulin activated only Akt, via PI3K/mTORC2, and PMA activated only MAPKAPK-2, via p38. In contrast, amino acids activated both signaling pathways. Similar results (increase in Fru-2,6-P2 concentration and activation of the PI3K/mTORC2 and p38/MAPKAPK-2 pathways) were obtained in MCF7 cells (Fig. 2). These observations, therefore, indicate that these results were not specific to HeLa cells.
FIGURE 2.
Various human cell lines show a similar increase in Fru-2,6-P2 concentration in response to amino acids. After overnight serum deprivation, HeLa and MCF7 cells were deprived of amino acids with DPBS medium for 2 h and then stimulated with amino acids 1× for 30 min. Fru-2,6-P2 concentration was measured as described under “Experimental Procedures,” where a fold induction of 1 corresponds to 54 ± 8 pmol/mg of protein in HeLa cells and 65 ± 2 pmol/mg of protein in MCF7 cells (upper panel). Cellular lysates were also analyzed by Western blot analysis with the indicated antibodies (lower panel). Molecular weight markers are indicated on the left. Values are the means ± S.E. for at least three independent experiments. ***, p < 0.001.
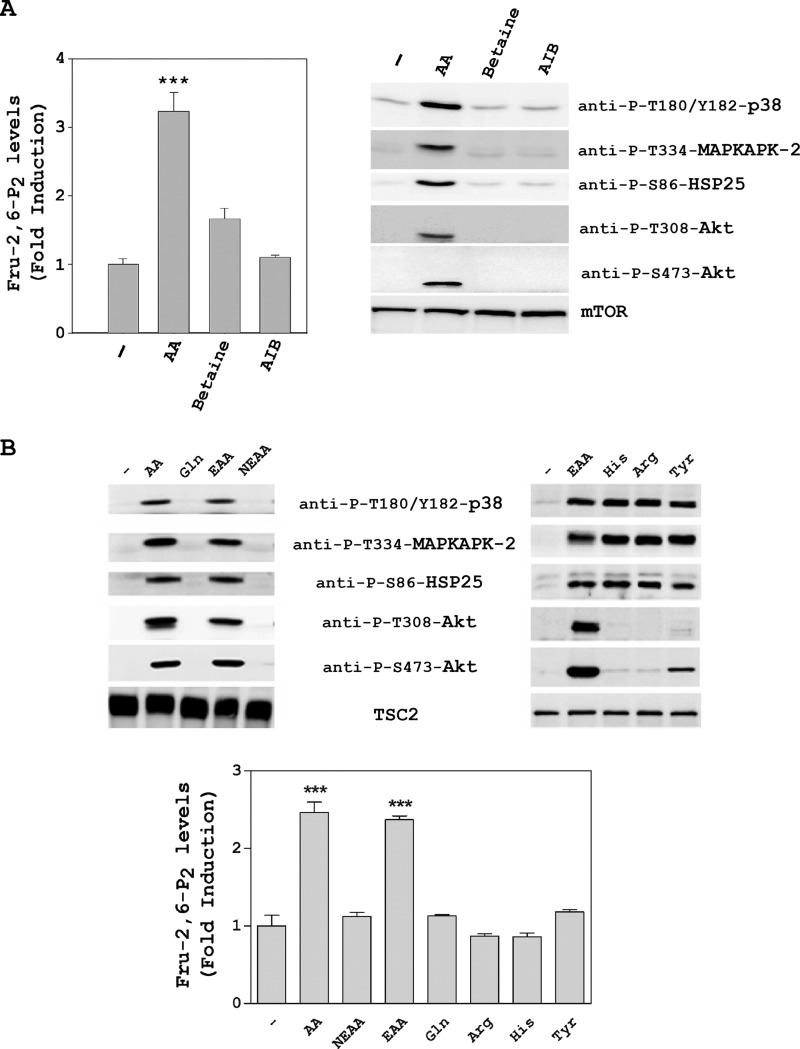
To ascertain whether these results were a specific response to amino acid addition and not due to an osmotic effect, we tested the effects of two non-nutrient osmolytes, namely betaine and γ-amino-n-butyric acid. The increase in Fru-2,6-P2 concentration and the activation of the PI3K/mTORC2 and p38/MAPKAPK-2 pathways occurred only in the presence of amino acids (Fig. 3A).
FIGURE 3.
Fru-2,6-P2 concentration is increased by essential amino acids. HeLa cells were deprived of amino acids as in Fig. 2. They were then stimulated for 30 min with amino acids (AA, 1×) and the non-nutrient osmolytes betaine (10 mm) and γ-amino-n-butyric acid (AIB, 10 mm) (A) or with (1×) and essential amino acids (except l-glutamine) (EAA, 1×), non-essential amino acids (NEAA, 1×), l-glutamine (Gln, 10 mm), l-histidine (His, 10 mm), l-arginine (Arg, 10 mm), and l-tyrosine (Tyr, 10 mm) (B). Fru-2,6-P2 concentration was measured as described under “Experimental Procedures.” A fold induction of 1 corresponds to 45 ± 4 pmol/mg of protein. Cellular lysates were analyzed by Western blot analysis with the indicated antibodies. Values are the means ± S.E. for at least three independent experiments. ***, p < 0.001.
The use of an amino acid solution (mix of EAA, non-essential amino acids, and l-glutamine (Gln)) to increase Fru-2,6-P2 concentration and activate the PI3K/mTORC2 and p38/MAPKAPK-2 pathways led us to ask which amino acids are really important. To try to answer this question, we first analyzed the effect of each commercial component. Thus, we observed that only essential amino acids without glutamine (EAA) were required to activate the PI3K/mTORC2 and p38/MAPKAPK-2 pathways and to increase the Fru-2,6-P2 concentration (Fig. 3B). Next, the effect of each essential amino acid was analyzed individually. We observed that the p38/MAPKAPK-2 pathway was only activated by l-histidine (His), l-arginine (Arg), or l-tyrosine (Tyr) and that the PI3K/mTORC2 pathway was only slightly stimulated by tyrosine (Fig. 3B and data not shown). In all cases, the Fru-2,6-P2 concentration was not modified significantly (Fig. 3B). These data suggest that the observed effects in signaling and metabolism are produced by a mixture of essential amino acids.
The Increase in Fru-2,6-P2 Concentration Induced by Amino Acids Requires the Activation of the PI3K and p38 Pathways
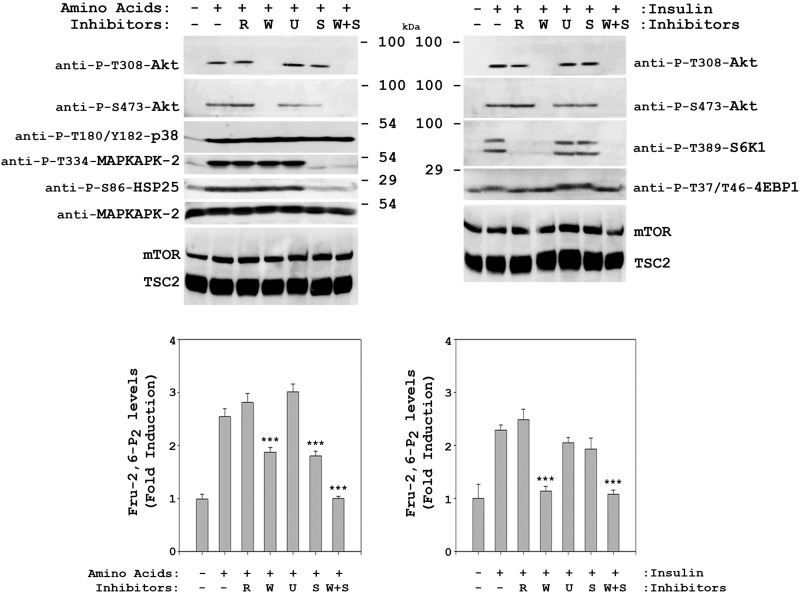
To determine whether signaling pathways activated by amino acids are also involved in the increase in Fru-2,6-P2 concentration, we analyzed the effect of specific inhibitors of the MAPK and PI3K pathways. Similarly to the results for insulin, Akt phosphorylation by amino acids was shown to be wortmannin-dependent (W, inhibitor of PI3K activity) and independent of rapamycin (R, inhibitor of mTORC1 activity) under these conditions (Fig. 4, upper panels). A slight inhibition of Akt phosphorylation at Ser-473 was also observed with SB 203580 (S, inhibitor of p38 activity). As a positive control of inhibitor action, rapamycin blocked the activation of mTORC1 (phosphorylation of its substrates 4E-BP1 (Thr-37/Thr-46) and S6K1 (Thr-389)) by insulin (Fig. 4, right upper panel). In contrast, the phosphorylation of MAPKAPK-2 (Thr-334) and HSP25 (Ser-86) by amino acids was SB 203580-dependent (S, inhibitor of p38 activity) and independent of U0126 (U, inhibitor of MEK activity), rapamycin, and wortmannin (Fig. 4, left upper panel). In these cells, we analyzed whether Fru-2,6-P2 concentration was regulated by these inhibitors. The increase in Fru-2,6-P2 induced by amino acids was partially blocked by wortmannin and by SB 203580. The combination of these two inhibitors completely blocked the increase in Fru-2,6-P2 (Fig. 4, left lower panel). In cells stimulated with insulin, the increase in Fru-2,6-P2 was blocked only by wortmannin (Fig. 4, upper right panel). As a negative control, the effect of inhibitors in the absence of amino acids was also analyzed. In these conditions, the content of Fru-2,6-P2 was not significantly modified by the presence of inhibitors (data not shown). Taken together, these results show that the increase in Fru-2,6-P2 concentration induced by amino acids requires activation of the PI3K and p38 pathways and that the molecular mechanisms involved differ from those observed with insulin.
FIGURE 4.
Amino acids induce an increase in Fru-2,6-P2 concentration via the PI3K and p38 pathways. Deprivation and stimulation with insulin or amino acids were performed as in Fig. 1. Where indicated, HeLa cells were pretreated with 20 nm rapamycin (R), 100 nm wortmannin (W), 5 μm U0126 (U), or 10 μm SB 203580 (S) for 60 min before insulin or amino acid stimulation. Cellular lysates were analyzed by Western blot analysis (upper panels) with the antibodies indicated. Fru-2,6-P2 concentration was also measured (lower panels) as described under “Experimental Procedures.” A fold induction of 1 corresponds to 41 ± 3 pmol/mg of protein in the left panel and 26 ± 2 pmol/mg of protein in the right panel. Values are the means ± S.E. for at least three independent experiments. ***, p < 0.001.
PFKFB2 Is Required for the Increase in Fru-2,6-P2 Concentration Induced by Amino Acids
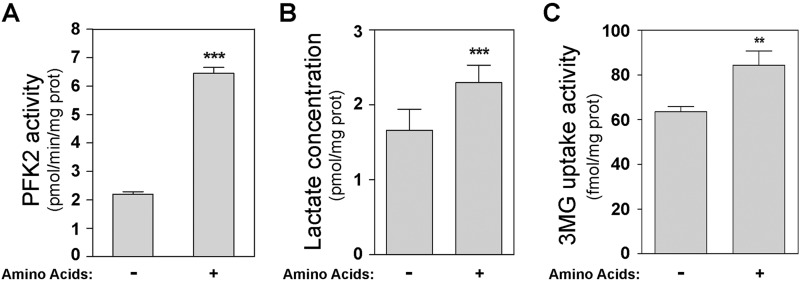
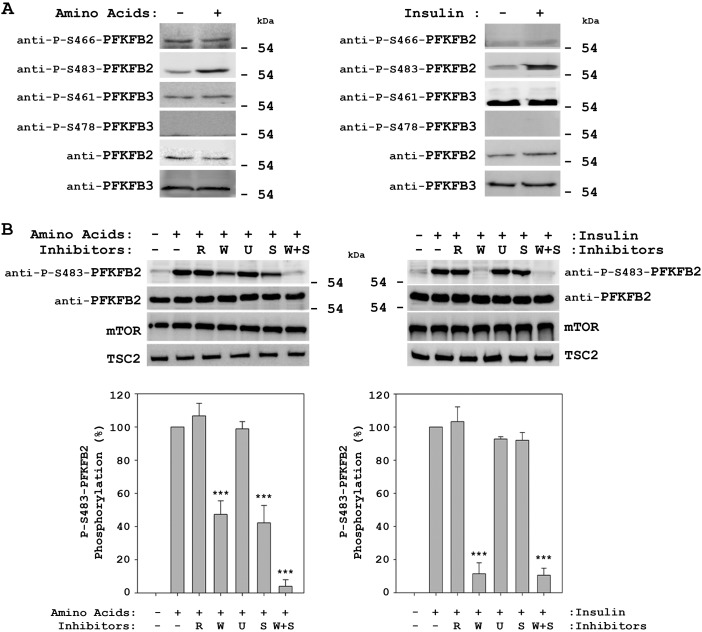
The enzyme PFKFB is responsible for the synthesis and degradation of Fru-2,6-P2. There are four independent genes (PFKFB1–4) that encode the isoenzymes of the PFKFB family. PFKFB1 and PFKFB4 are specific isoenzymes of liver/kidney and testis tissues, respectively (1, 25). In HeLa cells, predominant expression of PFKFB2 and PFKFB3 has been reported (22, 26, 27). To analyze whether the increase in Fru-2,6-P2 concentrations caused by amino acids correlated with an increase in 6-phosphofructo-2-kinase (PFK-2) activity, we measured the activity of this enzyme. A significant increase in PFK-2 activity was detected in the presence of amino acids (Fig. 5A). In agreement with these data, lactate production and glucose uptake were increased by amino acids (Fig. 5, B and C). The increase in PFK-2 activity could be due to an increase in the amount of the enzyme. We checked this by analyzing the expression of PFKFB isoenzymes in HeLa cells. Thus, PFKFB2 and PFKFB3 proteins were analyzed by immunoblot analysis using specific antibodies. PFKFB expression did not change during the amino acid or insulin treatments or in the presence of inhibitors (Fig. 6). These findings thus indicate that the increases in Fru-2,6-P2 concentrations and PFK-2 activity were not due to an increase in the amount of PFKFB enzyme.
FIGURE 5.
Amino acids increase 6-phosphofructo-2-kinase activity. After amino acid deprivation, HeLa cells were stimulated with amino acids (1×) for 30 min. 6-phosphofructo-2-kinase (PFK2) activity (A), lactate concentration (B), and 3-O-[14C]methyl-D-glucose (3MG) uptake (C) were measured in cellular lysates as described under “Experimental Procedures.” Values are the means ± S.E. for at least three independent experiments. **, p < 0.01; ***, p < 0.001.
FIGURE 6.
Amino acids increase PFKFB2 phosphorylation at Ser-483. Deprivation and stimulation with insulin or amino acids were performed as in Fig. 1. Where indicated, HeLa cells were pretreated with 20 nm rapamycin (R), 100 nm wortmannin (W), 5 μm U0126 (U), or 10 μm SB 203580 (S) for 60 min before insulin or amino acid stimulation. Cellular lysates were analyzed by Western blot analysis with the indicated antibodies. Quantification and statistical analysis of PFKFB2 phosphorylation at Ser-483 (lower panels) were performed as described under “Experimental Procedures.” Values are the means ± S.E. for at least three independent experiments. ***, p < 0.001.
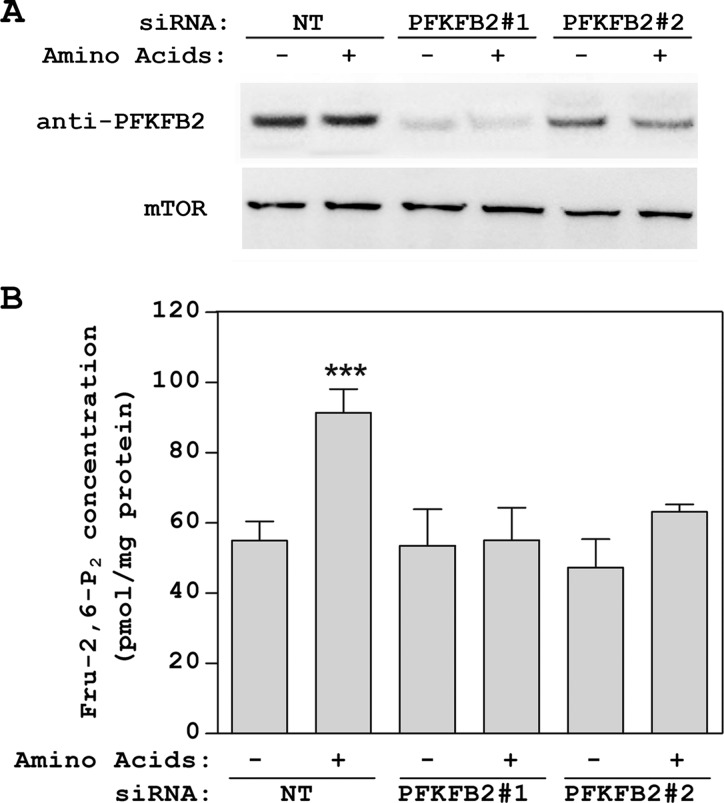
The phosphorylation of PFKFB at specific residues has been associated with an increase in its kinase activity and Fru-2,6-P2 synthesis (1, 25). Thus, phosphorylation of PFKFB2 at Ser-466 and Ser-483 and of PFKFB3 at Ser-461 and Ser-478 has been reported (4, 7, 10, 28–30). We analyzed these phosphorylations of PFKFB2 and PFKFB3 by immunoblot analysis using phosphospecific antibodies. We only observed an increase in the phosphorylation of PFKFB2 at Ser-483 (Fig. 6A, left panel). This increase was similar to that detected after stimulation with insulin (Fig. 6A, right panel). Interestingly, the phosphorylation of PFKFB2 at Ser-483 by amino acids was partially blocked by wortmannin and SB 203580 and was completely blocked by the combination of these two inhibitors (Fig. 6B, left panel). In cells stimulated with insulin, the phosphorylation of PFKFB2 at Ser-483 was completely blocked only by wortmannin (Fig. 6B, right panel). In all these conditions, a correlation between phosphorylation of PFKFB2 at Ser-483 (Fig. 6B) and Fru-2,6-P2 concentrations was detected (Fig. 4). These data suggest that PFKFB2 is required for the increase in Fru-2,6-P2 concentration induced by amino acids. To show this, we used PFKFB2 siRNA to knockdown PFKFB2 protein levels. HeLa cells were transfected with two PFKFB2-specific siRNAs and stimulated with amino acids. Knockdown of PFKFB2 clearly inhibited the amino acid-induced increase in Fru-2,6-P2 (Fig. 7).
FIGURE 7.
PFKFB2 is required for the increase in Fru-2,6-P2 concentration induced by amino acids. HeLa cells were transfected with either two PFKFB2 siRNAs (#1 and #2) or non-targeting (NT) control siRNA 48 h before serum deprivation. Deprivation and stimulation with amino acids were performed as in Fig. 2. A, cellular lysates were analyzed by Western blot analysis with the indicated antibodies. B, Fru-2,6-P2 concentration was also measured as described under “Experimental Procedures.” Values are the means ± S.E. for at least three independent experiments. ***, p < 0.001.
Akt Activity Is Required for PFKFB2 Phosphorylation and the Increase in Fru-2,6-P2 Concentration Induced by Amino Acids
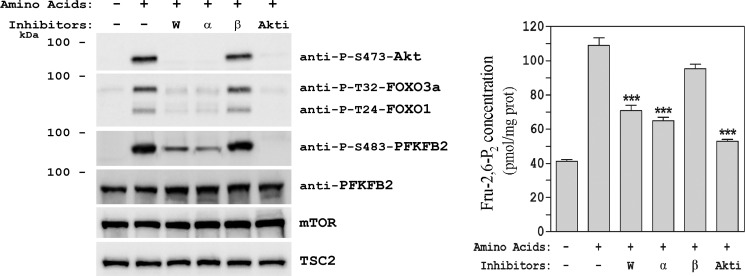
To further assess the role of the PI3K pathway in the increase in Fru-2,6-P2 concentration, specific inhibitors for class I PI3K isoforms and Akt were analyzed. The class I PI3K specific inhibitors were PI3Kα-selective inhibitor AS702630 (9) and PI3Kβ-selective inhibitor TGX-155 (8). The Akt-specific inhibitor was Akti-1/2 (31, 31). Akt phosphorylation at Ser-473 after amino acid addition was inhibited by wortmannin, the PI3Kα inhibitor, and Akti-1/2 (Fig. 8). Under these conditions, the kinase activity of Akt was inhibited, as reflected by the phosphorylation of the Akt substrates FOXO3a and FOXO1 (Fig. 8). Similar to the results obtained with wortmannin, the PI3Kα inhibitor partially inhibited the phosphorylation of PFKFB2 at Ser-483 (Fig. 8). Interestingly, the Akti-1/2 inhibitor completely inhibited PFKFB2 phosphorylation. In all these conditions, the Fru-2,6-P2 concentrations correlated with PFKFB2 phosphorylation (Fig. 8, right panel). These data indicate a key role for Akt in the regulation of Fru-2,6-P2 concentration by amino acids through PFKFB2 phosphorylation. The similar effects observed with wortmannin and the PI3Kα inhibitor on the regulation of PFKFB2 and Fru-2,6-P2 concentrations indicate that this regulation is mediated by the PI3Kα isoform. The inhibition of PFKFB2 phosphorylation by amino acids in the presence of Akti-1/2 also suggests that the PI3K and p38 pathways converge at Akt activation.
FIGURE 8.
Akt activity is required for PFKFB2 phosphorylation and the increase in Fru-2,6-P2 concentration induced by amino acids. HeLa cells were treated as in Fig. 2. Where indicated, cells were pretreated with 100 nm wortmannin (W), 1 μm class I PI3K isoform-specific inhibitors (α, β) or 10 μm Akti-1/2 (Akti) for 60 min before amino acid stimulation. Cellular lysates were analyzed by Western blot analysis (left panel) with the indicated antibodies. Fru-2,6-P2 concentration was also measured (right panel). Values are the means ± S.E. for at least three independent experiments. ***, p < 0.001.
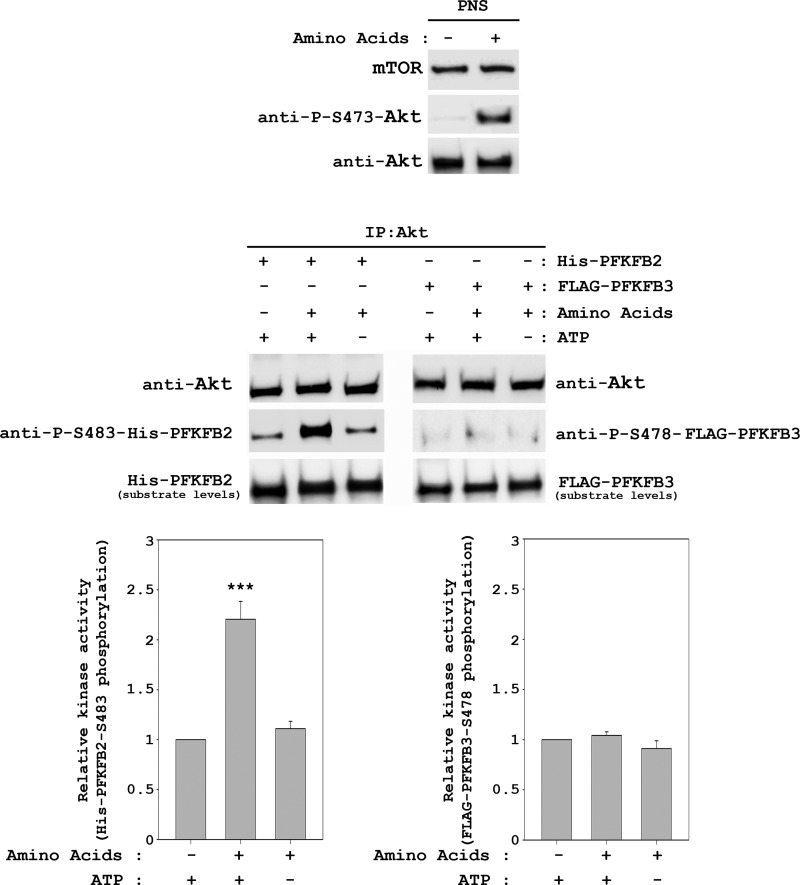
To confirm the role of Akt in amino acid signal transduction to PFKFB2, we performed an in vitro kinase assay using purified His-PFKFB2 as a substrate. Lysates from HeLa cells stimulated with amino acids or unstimulated were immunoprecipitated with anti-Akt antibodies. Purified immunoprecipitates were incubated with previously purified His-PFKFB2 in the presence or absence of ATP. Under these conditions, phosphorylation of PFKFB2 at Ser-483 was increased significantly in Akt immunoprecipitates stimulated by amino acids (Fig. 9). As a negative control, we also performed in vitro kinase assays using the PFKFB3 isoform as the substrate. Thus, we analyzed the Ser-478 phosphorylation (the equivalent residue to Ser-483 in PFKFB2 (1)) in purified FLAG-PFKFB3. Under these conditions and in agreement with the previous results (Fig. 6), no variations in the phosphorylation of this residue by amino acids were detected (Fig. 9). Taken together, these results show that amino acid-stimulated Akt specifically phosphorylates the Ser-483 of the PFKFB2 isoform.
FIGURE 9.
Amino acids induce PFKFB2 phosphorylation at Ser-483 by Akt. HeLa cells were treated as in Fig. 2. Supernatants (PNS) were immunoprecipitated (IP) with anti-Akt antibody. Immunocomplexes were resuspended in kinase buffer and incubated with purified His-PFKFB2 or FLAG-PFKFB3 as substrates in the presence or absence of ATP for 30 min at 37 °C. Reactions were stopped in ice with sample buffer and analyzed by Western blot analysis with the indicated antibodies. Band intensities from three independent experiments were quantified and normalized relative to Akt. Data represent the ratio of PFKFB phosphorylation and are expressed as the mean ± S.E. of the percentage of the respective control. ***, p < 0.001.
Regulation of Fru-2,6-P2 Content in Rat Cardiomyocytes by Amino Acids
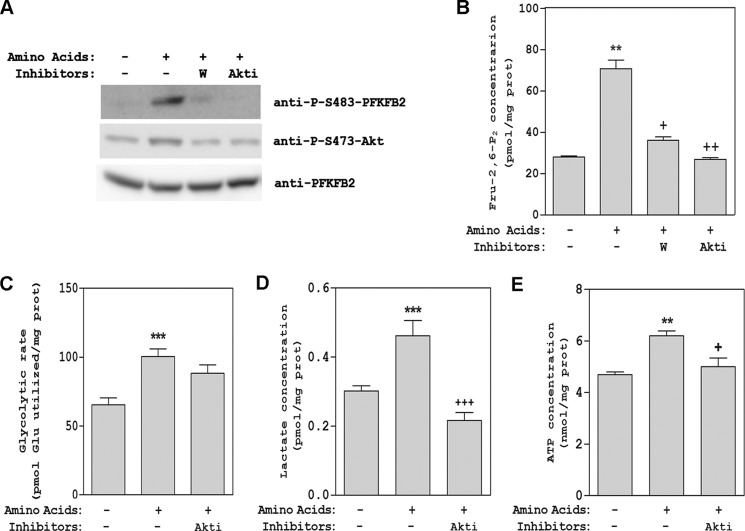
To analyze the regulation of Fru-2,6-P2 content by amino acids in a more physiological context, we took advantage of the specific expression of PFKFB2 in heart, where it is an essential enzyme in the regulation of glycolysis (1). For this purpose, freshly isolated adult rat cardiomyocytes were incubated with or without amino acids, and PFKFB2 activation was measured in lysates of these cells by immunoblotting using a specific anti-Ser-483-PFKFB2 antibody. A high increase in PFKFB2 phosphorylation at Ser-483 was observed after stimulation with amino acids (Fig. 10A). As expected, this increase was inhibited in the presence of wortmannin or Akti-1/2 (Fig. 10A), in agreement with the Akt-dependent phosphorylation of PFKFB2 observed previously in HeLa cells. Akt phosphorylation at Ser-473 was used as a control in these experiments. Fru-2,6-P2 concentrations were also analyzed in these cardiomyocytes. We observed a correlation between Fru-2,6-P2 and PFKFB2 phosphorylation at Ser-483 (Fig. 10, A and B). To show that these changes have biological significance and regulate glycolysis, the glycolytic flux was analyzed in cardiomyocytes. To this end, we measured [5-3H]D-glucose consumption (Fig. 10C) and concentration of lactate (D) and ATP (E) after stimulation by amino acids. We observed an Akt-dependent increase in all of these parameters. Altogether, these data suggest a similar signaling pathway and regulatory mechanism of the Fru-2,6-P2 content by amino acids in tissues and cells regulated by the PFKFB2 isoform (Fig. 11).
FIGURE 10.
Effect of amino acids on PFKFB2 activity, Fru-2,6-P2 2 content, and glycolytic flux in rat cardiomyocytes. Freshly isolated rat cardiomyocytes were pretreated with 100 nm wortmannin (W) or 10 μm Akti-1/2 (Akti) for 60 min prior to stimulation with amino acids for 30 min. Cellular lysates were analyzed by Western blot analysis with the antibodies indicated (A). Fru-2,6-P2 concentration was also measured (B). Glycolytic flux was analyzed measuring [5-3H]D-glucose consumption (C) and concentrations of lactate (D) and ATP (E). Values are the means ± S.E. for at least three independent experiments. **, p < 0.01; ***, p < 0.001; +, p < 0.05; ++, p < 0.01; +++, p < 0.001.
FIGURE 11.
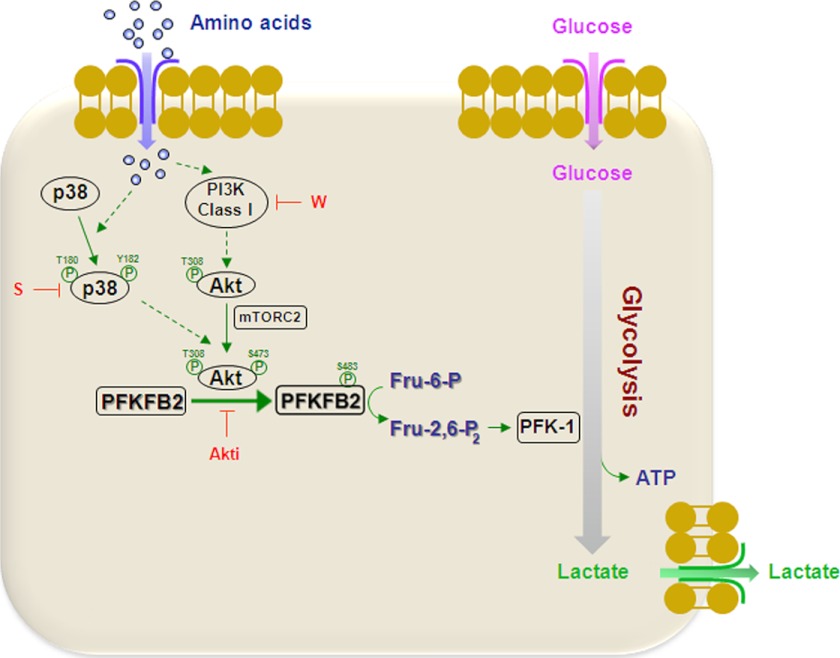
Model the stimulation of PFKFB2 activity by amino acids. In cells where glycolysis is regulated by the enzyme PFKFB2, the addition of amino acids to cells previously starved with DPBS increases Fru-2,6-P2 concentration. This increase correlates with an increase of glycolysis (glucose consumption and production of ATP and lactate). Mechanistically, the addition of amino acids activated the p38 and PI3K signaling pathways that converge at Akt activation. Activated Akt phosphorylates PFKFB2 at Ser-483, thereby stimulating its activity and Fru-2,6-P2 production. The dashed lines indicate that several steps may be involved. Activation is indicated with arrows. Inhibition by wortmannin (W), SB 203580 (S) or Akti-1/2 (Akti) is indicated by a blunt-ended arrow. Glycolysis and fluxes of amino acids, glucose, and lactate are indicated with thick arrows.
DISCUSSION
Metabolic and signal transduction pathways have often been considered separate entities, with signal transduction executing functions within the cell and metabolism maintaining cellular integrity and function (32). However, signal transduction may regulate metabolism in several ways. It is widely accepted that growth factors and hormones stimulate the metabolic activity of cells as part of integrated programs to promote proliferation or differentiation. Reciprocally, metabolism can also regulate signaling pathways and certain molecular complexes, such as mTORC1, mTORC2, and AMP-activated protein kinase, which are nutrient-sensing. Metabolites may serve as indicators of the metabolic status of the cell and, through metabolite-sensitive protein modifications, may modulate the activities of signaling proteins, metabolic enzymes, and transcriptional regulators (32). Here we focused on the activation of glycolytic metabolism by amino acids and the signaling pathways involved. We have reported previously that amino acids have the capacity to activate various signaling pathways, depending on starvation conditions (6). Thus, previous amino acid starvation with DMEM (-AA) or DPBS selects the further activation of mTORC1 or mTORC2 when amino acids are added. This characteristic led us to study the contribution of amino acids to each signaling pathway separately. Interestingly, both mTORC complexes were activated when cells were supplemented with amino acids after 48 h in complete DMEM. This finding, together with the assays with freshly isolated cardiomyocytes, indicates that these two pathways have physiological relevance (6). In this context, we demonstrate that amino acids increase Fru-2,6-P2 concentration in human cancer cells, such as HeLa or MCF7, and in non-transformed cells, such as rat cardiomyocytes, previously starved with DPBS. Further analysis of the signaling pathways involved showed that the increase in Fru-2,6-P2 content required the activation of the PI3K and p38 signaling pathways. These results are an example of how signaling and metabolism are inextricably linked (Fig. 11).
The regulation of mTOR activity directs the cellular response to nutrient status, which is especially sensitive to the availability of amino acids (6, 33). In vivo experiments of fasting and refeeding have recently shown the activation of Akt in the liver of refed mice, and experiments with liver-specific rictor knockout mice demonstrated mTORC2 dependence (34). Interestingly, the addition of l-threonine induced the proliferation of mouse embryonic stem cells through phosphorylation of Akt, p38, c-Jun N-terminal kinase/stress-activated protein kinase, and mTOR proteins (35). In this paper, the use of phospho-specific antibodies against regulatory proteins of the PI3K and p38 signaling pathways, in combination with the use of specific inhibitors, knockdown experiments, and kinase assays, allowed us to show that the increase in glycolytic metabolism after stimulation by amino acids converges with Akt activation. Thus, Akt activation is required for the increase in Fru-2,6-P2 content and the activation of PFKFB2 after amino acid addition. In agreement with these data, the phosphorylation and activation of PFKFB2 by insulin also require Akt (4, 10).
PFKFB2 is expressed in the heart. In this tissue, this isoenzyme plays an important regulatory role in glycolysis. Thus, insulin, adrenaline, and hypoxia stimulate phosphorylation and activation of PFKFB2, resulting in a net increase in Fru-2,6-P2 production (4, 29, 36–38). Protein kinases such as AMP-activated protein kinase or Akt may phosphorylate PFKFB2, thereby increasing its activity (22, 29). Interestingly, amino acids do not activate AMP-activated protein kinase (6). Given that PFKFB2 expression is not restricted to the heart, this regulation is also observed in cell lines where this isoenzyme is also present, for example in HeLa cells (Ref. 22 and our findings). In this context, it has been proposed that Akt-dependent binding of 14-3-3 proteins to phosphorylated PFKFB2 mediates the stimulation of glycolysis by growth factors (22). Alterations in metabolic activity contribute to the proliferation and survival of cancer cells. Recently, a functional metabolic screen has identified the PFKFB4 isoform as an enzyme essential for prostate cancer cell survival by maintaining the balance between the use of glucose for energy generation and the synthesis of antioxidants (39). Under these conditions, PFKFB3 had only minor effects. Interestingly, it has been reported that androgen stimulates glycolysis for de novo lipogenesis by increasing the activity of PFKFB2 in prostate cancer cells (3). In other human cancers, such as leukemia, and in lung, breast, colon, pancreatic, and ovarian adenocarcinomas, PFKFB3 is overexpressed (2, 40, 41). These examples show the functional relevance and complexity of PFKFB regulation. Our data indicate that the regulation of PFKFB activity by amino acids is specific to the PFKFB2 isoform and not restricted to cancer cells. Thus, we would expect a similar regulation of Fru-2,6-P2 content by amino acids in tissues and cells regulated by the PFKFB2 isoform.
In summary, this study demonstrates how amino acids activate signal transduction pathways that may regulate metabolic enzymes such as PFKFB2. This reciprocal regulation of metabolism and signaling allows cells to modulate their survival and proliferation in accordance with their metabolic resources.
Acknowledgments
We thank M. Camps and M. H. Rider for the PI3K inhibitors and His-PFKFB2 plasmid, respectively. We also thank E. Adanero for technical assistance and members of our department for helpful discussions.
This research was supported by Spanish Ministerio de Ciencia e Innovación (MICINN) Grants BFU2011-22498 and BFU2009-07380 and by Instituto de Salud Carlos III (ISCIII) Grant RETIC, RD06/0020, Spain.
- Fru-2,6P2
- fructose 2,6-bisphosphate
- PFKFB
- 6-phosphofructo-2-kinase/fructose-2,6-bisphosphatase
- mTOR
- mammalian target of rapamycin
- PMA
- phorbol-12-myristate-13-acetate
- EAA
- essential amino acid
- DPBS
- Dulbecco's phosphate-buffered saline
- DMEM (-AA)
- DMEM without amino acid(s)
- AA
- amino acid.
REFERENCES
- 1. Rider M. H., Bertrand L., Vertommen D., Michels P. A., Rousseau G. G., Hue L. (2004) 6-Phosphofructo-2-kinase/fructose-2,6-bisphosphatase. Head-to-head with a bifunctional enzyme that controls glycolysis. Biochem. J. 381, 561–579 [DOI] [PMC free article] [PubMed] [Google Scholar]
- 2. Bartrons R., Caro J. (2007) Hypoxia, glucose metabolism and the Warburg's effect. J. Bioenerg. Biomembr. 39, 223–229 [DOI] [PubMed] [Google Scholar]
- 3. Moon J. S., Jin W. J., Kwak J. H., Kim H. J., Yun M. J., Kim J. W., Park S. W., Kim K. S. (2011) Androgen stimulates glycolysis for de novo lipid synthesis by increasing the activities of hexokinase 2 and 6-phosphofructo-2-kinase/fructose-2,6-bisphosphatase 2 in prostate cancer cells. Biochem. J. 433, 225–233 [DOI] [PubMed] [Google Scholar]
- 4. Mouton V., Toussaint L., Vertommen D., Gueuning M. A., Maisin L., Havaux X., Sanchez-Canedo C., Bertrand L., Dequiedt F., Hemmings B. A., Hue L., Rider M. H. (2010) Heart 6-phosphofructo-2-kinase activation by insulin requires PKB (protein kinase B), but not SGK3 (serum- and glucocorticoid-induced protein kinase 3). Biochem. J. 431, 267–275 [DOI] [PubMed] [Google Scholar]
- 5. Laplante M., Sabatini D. M. (2012) mTOR signaling in growth control and disease. Cell 149, 274–293 [DOI] [PMC free article] [PubMed] [Google Scholar]
- 6. Tato I., Bartrons R., Ventura F., Rosa J. L. (2011) Amino acids activate mammalian target of rapamycin complex 2 (mTORC2) via PI3K/Akt signaling. J. Biol. Chem. 286, 6128–6142 [DOI] [PMC free article] [PubMed] [Google Scholar]
- 7. Novellasdemunt L., Obach M., Millán-Ariño L., Manzano A., Ventura F., Rosa J. L., Jordan A., Navarro-Sabate A., Bartrons R. (2012) Progestins activate 6-phosphofructo-2-kinase/fructose-2,6-bisphosphatase 3 (PFKFB3) in breast cancer cells. Biochem. J. 442, 345–356 [DOI] [PubMed] [Google Scholar]
- 8. Jackson S. P., Schoenwaelder S. M., Goncalves I., Nesbitt W. S., Yap C. L., Wright C. E., Kenche V., Anderson K. E., Dopheide S. M., Yuan Y., Sturgeon S. A., Prabaharan H., Thompson P. E., Smith G. D., Shepherd P. R., Daniele N., Kulkarni S., Abbott B., Saylik D., Jones C., Lu L., Giuliano S., Hughan S. C., Angus J. A., Robertson A. D., Salem H. H. (2005) PI 3-kinase p110β. A new target for antithrombotic therapy. Nat. Med. 11, 507–514 [DOI] [PubMed] [Google Scholar]
- 9. Rückle T., Biamonte M., Grippi-Vallotton T., Arkinstall S., Cambet Y., Camps M., Chabert C., Church D. J., Halazy S., Jiang X., Martinou I., Nichols A., Sauer W., Gotteland J. P. (2004) Design, synthesis, and biological activity of novel, potent, and selective (benzoylaminomethyl)thiophene sulfonamide inhibitors of c-Jun-N-terminal kinase. J. Med. Chem. 47, 6921–6934 [DOI] [PubMed] [Google Scholar]
- 10. Deprez J., Vertommen D., Alessi D. R., Hue L., Rider M. H. (1997) Phosphorylation and activation of heart 6-phosphofructo-2-kinase by protein kinase B and other protein kinases of the insulin signaling cascades. J. Biol. Chem. 272, 17269–17275 [DOI] [PubMed] [Google Scholar]
- 11. Casas-Terradellas E., Tato I., Bartrons R., Ventura F., Rosa J. L. (2008) ERK and p38 pathways regulate amino acid signalling. Biochim. Biophys. Acta 1783, 2241–2254 [DOI] [PubMed] [Google Scholar]
- 12. Cubillos-Rojas M., Amair-Pinedo F., Tato I., Bartrons R., Ventura F., Rosa J. L. (2010) Simultaneous electrophoretic analysis of proteins of very high and low molecular mass using Tris-acetate polyacrylamide gels. Electrophoresis 31, 1318–1321 [DOI] [PubMed] [Google Scholar]
- 13. Cubillos-Rojas M., Amair-Pinedo F., Tato I., Bartrons R., Ventura F., Rosa J. L. (2012) Tris-acetate polyacrylamide gradient gels for the simultaneous electrophoretic analysis of proteins of very high and low molecular mass. Methods Mol. Biol. 869, 205–213 [DOI] [PubMed] [Google Scholar]
- 14. García-Martínez J. M., Alessi D. R. (2008) mTOR complex 2 (mTORC2) controls hydrophobic motif phosphorylation and activation of serum- and glucocorticoid-induced protein kinase 1 (SGK1). Biochem. J. 416, 375–385 [DOI] [PubMed] [Google Scholar]
- 15. Yamamoto N., Ueda M., Sato T., Kawasaki K., Sawada K., Kawabata K., Ashida H. (2011) Measurement of glucose uptake in cultured cells. Curr. Protoc. Pharmacol. 12, 12.14.1–12.14.22 [DOI] [PubMed] [Google Scholar]
- 16. Van Schaftingen E., Lederer B., Bartrons R., Hers H. G. (1982) A kinetic study of pyrophosphate. Fructose-6-phosphate phosphotransferase from potato tubers. Application to a microassay of fructose 2,6-bisphosphate. Eur. J. Biochem. 129, 191–195 [DOI] [PubMed] [Google Scholar]
- 17. Van Schaftingen E. (1987) Fructose 2,6-bisphosphate. Adv. Enzymol. Relat. Areas Mol. Biol. 59, 315–395 [DOI] [PubMed] [Google Scholar]
- 18. Gutmann I., Wahlefeld A. W. (1974) Methods of Enzymatic Analysis, 2nd Ed., pp. 1461–1468, Academic Press, New York [Google Scholar]
- 19. Atlante A., de Bari L., Bobba A., Marra E., Calissano P., Passarella S. (2003) Cytochrome c, released from cerebellar granule cells undergoing apoptosis or excytotoxic death, can generate protonmotive force and drive ATP synthesis in isolated mitochondria. J. Neurochem. 86, 591–604 [DOI] [PubMed] [Google Scholar]
- 20. Ashcroft S. J., Weerasinghe L. C., Bassett J. M., Randle P. J. (1972) The pentose cycle and insulin release in mouse pancreatic islets. Biochem. J. 126, 525–532 [DOI] [PMC free article] [PubMed] [Google Scholar]
- 21. Hughes S. D., Quaade C., Johnson J. H., Ferber S., Newgard C. B. (1993) Transfection of AtT-20ins cells with GLUT-2 but not GLUT-1 confers glucose-stimulated insulin secretion. Relationship to glucose metabolism. J. Biol. Chem. 268, 15205–15212 [PubMed] [Google Scholar]
- 22. Pozuelo Rubio M., Peggie M., Wong B. H., Morrice N., MacKintosh C. (2003) 14-3-3s regulate fructose-2,6-bisphosphate levels by binding to PKB-phosphorylated cardiac fructose-2,6-bisphosphate kinase/phosphatase. EMBO J. 22, 3514–3523 [DOI] [PMC free article] [PubMed] [Google Scholar]
- 23. Li Y., Sassano A., Majchrzak B., Deb D. K., Levy D. E., Gaestel M., Nebreda A. R., Fish E. N., Platanias L. C. (2004) Role of p38α Map kinase in type I interferon signaling. J. Biol. Chem. 279, 970–979 [DOI] [PubMed] [Google Scholar]
- 24. Vertii A., Hakim C., Kotlyarov A., Gaestel M. (2006) Analysis of properties of small heat shock protein Hsp25 in MAPK-activated protein kinase 2 (MK2)-deficient cells. MK2-dependent insolubilization of Hsp25 oligomers correlates with susceptibility to stress. J. Biol. Chem. 281, 26966–26975 [DOI] [PubMed] [Google Scholar]
- 25. Okar D. A., Manzano A., Navarro-Sabatè A., Riera L., Bartrons R., Lange A. J. (2001) PFK-2/FBPase-2. Maker and breaker of the essential biofactor fructose-2,6-bisphosphate. Trends Biochem. Sci. 26, 30–35 [DOI] [PubMed] [Google Scholar]
- 26. Yalcin A., Clem B. F., Simmons A., Lane A., Nelson K., Clem A. L., Brock E., Siow D., Wattenberg B., Telang S., Chesney J. (2009) Nuclear targeting of 6-phosphofructo-2-kinase (PFKFB3) increases proliferation via cyclin-dependent kinases. J. Biol. Chem. 284, 24223–24232 [DOI] [PMC free article] [PubMed] [Google Scholar]
- 27. Tudzarova S., Colombo S. L., Stoeber K., Carcamo S., Williams G. H., Moncada S. (2011) Two ubiquitin ligases, APC/C-Cdh1 and SKP1-CUL1-F (SCF)-β-TrCP, sequentially regulate glycolysis during the cell cycle. Proc. Natl. Acad. Sci. U.S.A. 108, 5278–5283 [DOI] [PMC free article] [PubMed] [Google Scholar]
- 28. Bando H., Atsumi T., Nishio T., Niwa H., Mishima S., Shimizu C., Yoshioka N., Bucala R., Koike T. (2005) Phosphorylation of the 6-phosphofructo-2-kinase/fructose 2,6-bisphosphatase/PFKFB3 family of glycolytic regulators in human cancer. Clin. Cancer Res. 11, 5784–5792 [DOI] [PubMed] [Google Scholar]
- 29. Marsin A. S., Bertrand L., Rider M. H., Deprez J., Beauloye C., Vincent M. F., Van den Berghe G., Carling D., Hue L. (2000) Phosphorylation and activation of heart PFK-2 by AMPK has a role in the stimulation of glycolysis during ischaemia. Curr. Biol. 10, 1247–1255 [DOI] [PubMed] [Google Scholar]
- 30. Marsin A. S., Bouzin C., Bertrand L., Hue L. (2002) The stimulation of glycolysis by hypoxia in activated monocytes is mediated by AMP-activated protein kinase and inducible 6-phosphofructo-2-kinase. J. Biol. Chem. 277, 30778–30783 [DOI] [PubMed] [Google Scholar]
- 31. DeFeo-Jones D., Barnett S. F., Fu S., Hancock P. J., Haskell K. M., Leander K. R., McAvoy E., Robinson R. G., Duggan M. E., Lindsley C.W., Zhao Z., Huber H. E., Jones R. E. (2005) Tumor cell sensitization to apoptotic stimuli by selective inhibition of specific Akt/PKB family members. Mol. Cancer Ther. 4, 271–279 [PubMed] [Google Scholar]
- 32. Wellen K. E., Thompson C. B. (2012) A two-way street. Reciprocal regulation of metabolism and signalling. Nat. Rev. Mol. Cell Biol. 13, 270–276 [DOI] [PubMed] [Google Scholar]
- 33. Dann S. G., Selvaraj A., Thomas G. (2007) mTOR Complex1-S6K1 signaling. At the crossroads of obesity, diabetes and cancer. Trends Mol. Med. 13, 252–259 [DOI] [PubMed] [Google Scholar]
- 34. Hagiwara A., Cornu M., Cybulski N., Polak P., Betz C., Trapani F., Terracciano L., Heim M. H., Rüegg M. A., Hall M. N. (2012) Hepatic mTORC2 activates glycolysis and lipogenesis through Akt, glucokinase, and SREBP1c. Cell Metab. 15, 725–738 [DOI] [PubMed] [Google Scholar]
- 35. Ryu J. M., Han H. J. (2011) L-threonine regulates G1/S phase transition of mouse embryonic stem cells via PI3K/Akt, MAPKs, and mTORC pathways. J. Biol. Chem. 286, 23667–23678 [DOI] [PMC free article] [PubMed] [Google Scholar]
- 36. Hue L., Beauloye C., Marsin A. S., Bertrand L., Horman S., Rider M. H. (2002) Insulin and ischemia stimulate glycolysis by acting on the same targets through different and opposing signaling pathways. J. Mol. Cell Cardiol. 34, 1091–1097 [DOI] [PubMed] [Google Scholar]
- 37. Donthi R. V., Ye G., Wu C., McClain D. A., Lange A. J., Epstein P. N. (2004) Cardiac expression of kinase-deficient 6-phosphofructo-2-kinase/fructose-2,6-bisphosphatase inhibits glycolysis, promotes hypertrophy, impairs myocyte function, and reduces insulin sensitivity. J. Biol. Chem. 279, 48085–48090 [DOI] [PubMed] [Google Scholar]
- 38. Wang Q., Donthi R. V., Wang J., Lange A. J., Watson L. J., Jones S. P., Epstein P.N. (2008) Cardiac phosphatase-deficient 6-phosphofructo-2-kinase/fructose-2,6-bisphosphatase increases glycolysis, hypertrophy, and myocyte resistance to hypoxia. Am. J. Physiol. Heart Circ. Physiol. 294, H2889–97 [DOI] [PMC free article] [PubMed] [Google Scholar]
- 39. Ros S., Santos C.R., Moco S., Baenke F., Kelly G., Howell M., Zamboni N., Schulze A. (2012) Functional metabolic screen identifies 6-phosphofructo-2-kinase/fructose-2,6-biphosphatase 4 as an important regulator of prostate cancer cell survival. Cancer Discov. 2, 328–343 [DOI] [PubMed] [Google Scholar]
- 40. Atsumi T., Chesney J., Metz C., Leng L., Donnelly S., Makita Z., Mitchell R., Bucala R. (2002) High expression of inducible 6-phosphofructo-2-kinase/fructose-2,6-bisphosphatase (iPFK-2; PFKFB3) in human cancers. Cancer Res. 62, 5881–5887 [PubMed] [Google Scholar]
- 41. Yalcin A., Telang S., Clem B., Chesney J. (2009) Regulation of glucose metabolism by 6-phosphofructo-2-kinase/fructose-2,6-bisphosphatases in cancer. Exp. Mol. Pathol. 86, 174–179 [DOI] [PubMed] [Google Scholar]


