

Abstract
Blood platelets are essential in maintaining hemostasis. Various materials can activate platelets and cause them to aggregate. Platelet aggregation in vitro is often used as a marker for materials’ thrombogenic properties and studying nanomaterial interaction with platelets is an important step toward understanding their hematocompatibility. Here we report evaluation of 12 formulations of PAMAM dendrimers varying in size and surface charge. Using a cell counter based method, light transmission aggregometry and scanning electron microscopy, we show that only large cationic dendrimers, but not anionic, neutral or small cationic dendrimers, induce aggregation of human platelets in plasma in vitro. The aggregation caused by large cationic dendrimers was proportional to the number of surface amines. The observed aggregation was not associated with membrane microparticle release, and was insensitive to a variety of chemical and biological inhibitors known to interfere with various pathways of platelet activation. Taken in context with previously reported studies, our data suggest that large cationic PAMAM dendrimers induce platelet aggregation through disruption of membrane integrity.
Keywords: PAMAM dendrimers, platelets, aggregation, activation, nanomaterials, thrombogenicity, coagulation, nanoparticles, thrombocyte, dendrimers, blood, nanomedicine
Nanoparticles are finding growing applications in medicine because they may reduce toxicity and improve the solubility, pharmacokinetics and biodistribution profiles1 of traditional pharmaceuticals. In the bloodstream, nanoparticles encounter a very complex environment of plasma proteins and immune cells 2-4. Some nanoparticles intended for drug delivery applications are intentionally engineered so as to reduce their clearance from the bloodstream to extend systemic circulation times and to increase drug delivery to a target site. When blood clearance is fast, nanoparticle interaction with blood components is minimized, however an increase in the circulation time respectively increases the duration of contact with blood components, including those of the coagulation system. Such extended exposure to coagulation factors and thrombocytes may amplify adverse effects such as activation of the blood clotting and occlusion of blood vessels by thrombi. This is why the initial characterization of nanomaterials often includes evaluation of nanoparticle hematocompatibility.
Platelets represent cellular components of the blood coagulation system. They are small anucleated cells derived from bone marrow megakaryocytes. Under physiological conditions, 150-450 × 109 platelets per liter circulate in the peripheral blood in 10 days 5. There is also a reservoir of platelets in the spleen which can be rapidly distributed into circulation when needed to maintain hemostasis. Platelets are very sensitive to changes in the blood microenvironment; they can be activated by different physiological agonists such as thrombin, collagen, adenosine-diphosphate (ADP), but also by various microorganisms, immunoglobulins, drugs and some nanomaterials 5. Although several studies have shown that certain nanoparticles, such as, iron-oxide nanoparticles 6, and silver nanoparticles 7, can activate platelets and induce platelet aggregation, no comprehensive structure activity relationship study evaluating the effects of nanoparticle size and surface properties on thrombogenic properties has been conducted.
Some trends in particle thrombogenic properties have been described. Interestingly, the reported trends were different for different type of nanoparticles. For example, Koziara et al. have shown anionic cetyl alcohol/polysorbate-based nanoparticles inhibit platelet activation and aggregation, and that this property is decreased when particle surface is modified with polyethylene glycol (PEG), however, the same strongly anionic particles (zeta potential of -40.2mV) neither activated platelets nor induced their aggregation 8. In contrast, Zbiden et al reported that only anionic liposomes activated platelets and induced platelet aggregation 9. In agreement with this, another study reported that platelet activation and aggregation by latex nanoparticles was stronger for most anionic particles and weaker for particles with less negative zeta potentials 10, 11. Both anionic and cationic polystyrene particles activated platelets and induced platelet aggregation, and these effects were stronger with the smaller particles12. These limited and contradictory data do not allow for a clear determination of whether nanoparticle size, surface charge, or composition determines thrombogenic properties. The mechanisms through which nanoparticles induce platelet activation and aggregation are also largely unknown, and the mechanisms may be different for different classes of particles. For example, when various carbon-based particles (fullerene derivatives and nanotubes) and polystyrene nanobeads were studied, only single- walled carbon nanotubes (SWCNT), and multi-walled carbon nanotubes (MWCNT) activated platelets, and this activation could be prevented by inhibitors known to block extracellular calcium influx 13. Another study comparing five different types of carbon-based materials (water soluble fullerene derivative, nanotubes and mixed carbon nanoparticles) reported that all of these particles required activation of glycoprotein integrin receptor GPIIb/IIIa in order to cause platelet aggregation. However, pathways leading to this receptor depended on the size of the particles, with micron-sized particles, but not nanoparticles, requiring protein kinase C (PKC) for the activation of the integrin pathway14. The same study suggested that unlike classical platelet aggregation, carbon-based nanoparticle-induced platelet aggregation did not require thromboxane A2 and ADP release. These data suggest that: 1) nanosized particles may induce platelet aggregation via untraditional pathways, which could render common anti-thrombotic drugs less efficient at reducing aggregation; and 2) platelet activating/aggregating activity and its underlying mechanisms may vary significantly, even within the same class of nanomaterials.
One attractive feature of nanotechnology is that nanoparticles can be engineered to either promote platelet aggregation15-17 or inhibit it 18, 19, which can aid in treatment of various blood coagulation disorders.
Dendrimers are nanomaterials which have been tested in clinical studies for various applications20. These materials became attractive to drug delivery scientists because they are monodisperse, uniform, and hyperbranched materials with a well-defined and reproducible synthesis and modifiable protein-like structures21. In addition to these properties polyamidoamine (PAMAM) dendrimers are also available through several commercial sources to any laboratory without synthetic capabilities, and can be synthesized and purchased in large quantities. We used 12 formulations of PAMAM dendrimers, varying in size and surface charge, and studied their effects on human platelets in vitro. We verified our findings using several different methods including traditional light transmission aggregometry, and scanning electron microscopy (SEM). The results demonstrated that only large (G4-G6) cationic dendrimers, but not their small (G3) cationic couterparts or anionic or neutral dendrimers, were capable of inducing platelet aggregation. We also showed that platelet aggregation caused by large cationic PAMAM dendrimers is not associated with the release of membrane microparticles, and is not sensitive to a variety of inhibitors known to interrupt different pathways established as triggering platelet activation by physiological agonists. Collectively with published studies reporting dendrimer interaction with and disruption of supported lipid bilayers22-26, and computer simulation 27, our data suggest that large cationic PAMAM dendrimers induce platelet aggregation by disturbing the integrity of cell membranes.
Experimental
Reagents
Commercially available
Ca2+/Mg2+ free DPBS, poly-L-lysine hydrobromide, polymyxin B, 2MeSAMP, and 1,10-phenantroline were from Sigma-Aldrich (St.Louis, MO). G3, G4, G5 and G6 PAMAM dendrimers with amine, carboxy and hydroxyl surface were from Dendritic Nanotechnologies Inc. (Mount Pleasant, MI). Collagen was purchased from Helena Laboratories (Beaumont, TX). Endotoxin standard, LAL-grade water and lysate were from Associates of Cape Code Inc. (East Falmouth, MA). NF449, MRS2500 were from Tocris Bioscience (Ellisvilli, MO). DM-BAPTA-AM was from Invitrogen (Carlsbad, CA). TBHQ, and SKF96365 were from Alexis Biochemicals (Plymouth Meeting, PA). 2-APB and Go6976 were EMD/Calbiochem (Gibbstown, NJ). ReoPro was obtained through NIH pharmacy, manufactured by Centocor B.V. (Leiden, Netherland) and distributed by EliLilly and Co (Indianapolis, IN). Aspirin was bought at CVS drug store as over-the-counter medication. Axon 1275 was from Axon Medchem (Groningen, Netherland).
Synthesis of G5-NH2 control dendrimers
The Generation 5 PAMAM dendrimers with various degrees (0, 20, 40, 60, 80, 100%) of surface capping were synthesized using acetic anhydride/triethylamine with previously published procedure28 to render completely neutral (100% acetylation with excess acetic anhydride) dendrimer or leave residual terminal amines based on stoichiometry of acetic anhydride used in the reaction. Careful addition of acetic anhydride in several aliquots at a higher dilution would render a more homogeneous capping. The conjugates were isolated and extensively purified with stirred cell ultrafiltration, lyophilized, and characterized using 1H NMR and Mass spectrometry. The variable degree of capping is confirmed by comparing the integration of terminal acetamido-CH3 protons of the dendrimer at δ 1.85 to the internal methylene proton signals. The electrophoretic mobility (zeta potential) of the functionalized dendrimers gradually became neutral with increased degree of capping
Particle characterization
LAL assay to estimate levels of bacterial endotoxin
Analysis was performed using PyrosKinetix instrument of Associates of Cape Code Inc. (East Falmouth, MA). Assay range for kinetic turbidity LAL was from 0.001 to 1.0 EU/mL. Standard curves (calibration curves) were prepared by spiking known amounts of USP-certified endotoxin standard into endotoxin-free (LAL-grade) water. In addition to the standard curve, each individual run of each LAL assay included a set of quality controls: positive quality controls (QC) for each assay were prepared by spiking endotoxin standard, at the standard curve midpoint concentration, into LAL-grade water. Inhibition/enhancement controls (IEC) were prepared by spiking the same amount of endotoxin standard used in QC into the nanoparticle formulation. Results from each individual assay run were not considered valid unless the precision and accuracy of the standard curve and quality control were within 25% and the inhibition/enhancement control exhibited 50-200% spike recovery. These acceptance criteria are in accordance with those mandated by the FDA guideline and USP standard for the LAL test29, 30. Each nanoparticle sample and IEC was tested in duplicate and repeated three times. For each formulation at least three dilutions of the test sample were tested.
Dynamic Light Scattering (DLS)
A Malvern Zetasizer Nano ZS instrument (Southborough, MA) with back scattering detector (173 °, 633 nm laser wavelength) was used for measuring the hydrodynamic size (diameter) in batch mode at 25° C in a low volume quartz cuvette (pathlength 10 mm). Dendrimer samples were prepared at a concentration of 1 mg/mL in PBS and filtered through a 0.02 μm filter. A minimum of twelve measurements per sample were made. Hydrodynamic size is reported as the intensity-weighted average (Int-Peak).
Zeta Potential
Zeta potential provides a measure of the electrostatic potential at the surface of the electrical double layer and the bulk medium, which is related to the nanoparticle surface charge. A Malvern Zetasizer Nano ZS instrument was used to measure zeta potential at 25° C. PAMAM dendrimer samples were prepared at a concentration of 10, 2, and 1 mg/mL, respectively, in 10 mM NaCl. An applied voltage of 100 V was used. Samples were loaded into pre-rinsed folded capillary cells and a minimum of three measurements were made per sample.
Platelet aggregation and activation tests
Research Donor Blood
If not specified otherwise, healthy volunteer blood specimens were drawn under NCI-Frederick Protocol OH99-C-N046. Blood was collected in BD vacutainer tubes containing sodium citrate as anticoagulant. To avoid individual variability plasma from at least three donors were pooled.
Cell counter based screening method
To study particles effects on platelet aggregation whole blood was centrifuged 8 minutes at 200xg in order to obtain Platelet Rich Plasma (PRP). PRP was treated with nanoparticles, PBS (negative control) or collagen (Positive control) for 15 minutes at 37 °C. After that single platelet count was conducted using Z2 counter and size analyzer (Beckman Coulter). Difference in single platelet count between negative control and test samples was used to calculate percent platelet aggregation. Additional control included incubation of platelet poor plasma and PBS with particles and analyzing these samples on the instrument. These controls were used to monitor potential particle aggregation in the presence of plasma proteins to avoid false-negative results. Detailed protocol is available at http://ncl.cancer.gov/NCL_Method_ITA-2.pdf.
Light transmission aggregometry
To further study platelet aggregation activity of PAMAM dendrimers, we employed light transmission aggregometry (PAP-8E aggregometer, Bio/Data Corp., Horsham, PA) as described previously (Ref 15). Platelet rich plasma (PRP) was prepared from blood of healthy donors (ACD anticoagulated, Department of Transfusion Medicine, Clinical Center, NIH, Bethesda, MD). Fifty mL of whole blood was centrifuged at 150 g for 10 minutes at room temperature and platelet rich plasma (PRP) was collected. The sediment was then centrifuged at 1000 g for 15 minutes at room temperature to obtain platelet poor plasma (PPP), used as a blank. The PRP platelet count was assayed (ABX Pentra 60, Horiba ABX, Inc., Irvine, CA) and diluted with PPP to 250 × 103 platelets/μL. Aggregation experiments were completed within 4 hours after blood collection to ensure normal platelet responsiveness. Thrombin Receptor Activator Peptide (TRAP-6) or Collagen were used as positive controls. All platelet samples were preincubated for 2 min before the adding the tested nanomaterials or controls in stirring wells of the aggregometer, then a 20 minutes reading was obtained for every sample set. Each experiment was performed using at least 3 blood samples from different donors. Means of maximum aggregation responses ± SEM are presented.
Flow Cytometry
Analysis of platelet surface activation markers and platelet membrane microparticles (MPs) by flow cytometry as described previously (Ref 15). Platelet rich plasma was prepared as described above and then diluted to 250 × 103 platelets/μL with platelet poor plasma for microparticle experiments and to 30 ×103 platelets/μL with Tyrode’s-HEPES buffer (THB: 130 mM NaCl, 2.6 mM KCl, 0.42 mM NaH2PO4, 5.5 mM glucose, 10 mM HEPES, 0.3% bovine serum albumin) for assessing platelet surface activation markers. Platelets we equilibrated for 30 minutes after dilution. Then they were incubated with tested nanomaterials (100 μg/mL) or a positive/negative control (20 μM TRAP-6 and platelets only, respectively) for 15 minutes on rocking platform at 37°C. Platelet surface markers and MP assays were run in parallel, using the same blood specimen. For analysis of platelet surface markers, platelet samples were spun briefly for 1 minute, at 150 g at room temperature to avoid presence of large nanomaterial aggregates. 50μL of supernatant was stained with saturating concentration of monoclonal antibodies against CD41a (FITC labeled) and CD62P (PE labeled). Matching isotype controls and nonlabeled samples were used as controls. After 15 minutes incubation in the dark, at room temperature, samples were diluted 10 fold with THB and immediately acquired using a FACSCalibur flow cytometer (Becton Dickinson, San Diego, CA, USA) equipped with CELLQuest software, with forward scatter (FSC) and side scatter (SSC) in logarithmic mode and subsequently analyzed using FlowJo (Tree Star, Inc. Ashland, OR). Representative histograms and FSC/SSC plots of 3 independent experiments are presented.
Microparticle samples, after incubation with nanomaterials, were spun for 10 minutes at 10°C at 10000g to obtain platelet free plasma (PFP) for the MP assay. Samples were then processed and analyzed as described previously 31, 32. Aliquots of 50 μL PFP were incubated for 20 min at room temperature in the dark with saturating concentrations of FITC- and PE-conjugated antibodies. In parallel, nonlabeled samples and samples labeled with relevant isotype controls were analyzed. After incubation and washing with 1 mL HBSS/ Ca2+/BSA, samples were resuspended in 500 μL HBSS/Ca2+/BSA (Hank’s balanced salt solution, Gibco, Grand Island, NY, was supplemented with CaCl2 to 2.5 mM Ca2+ and with 0.3% BSA) and analyzed by flow cytometry. Data were acquired using the flow cytometer and software as described above. MPs were analyzed using both forward scatter (FSC) and side scatter (SSC) in logarithmic mode. The flow rate was evaluated using TruCount beads from Becton Dickinson (San Diego, CA) analyzed as separate samples in parallel. MPs were defined as particles ≤ 1μm based on size comparison on forward scatter with the size standard polystyrene beads of 1μm in diameter. Counts of CD41a+CD62P+MPs and in the platelet supernatant was evaluated using double fluorescence plots acquired for 60 seconds at the standard flow rate. Relative increase in MP count in platelet supernatant after different treatments is presented as mean ±SEM of 3 independent experiments. Representative double fluorescence plots of MPs are shown.
Scanning Electron Microscopy
PRP was untreated or treated with dendrimers at final concentration of 100 μg/mL for 7 minutes, as described in cell counter based screening method section above. At the end of incubation, platelets were fixed with 2% paraformaldehyde for 15 minutes, centrifuged at 1000g for 10 minutes and ressupended in 500 μL of PBS; 100 μL of the platelet solution was deposited on poly-L-lysine coated cover slip and incubated for 20 minutes. The cover slips were rinsed with PBS three times and incubated for 30 min in 2 % glutaraldehyde solution in 0.1M PBS buffer (pH 7.4). The cover slips were then washed three times with 0.1 M cacodylate buffer. The samples were immersed in a series of graded ethanol solution (20%, 50%, 70%, 90% in water and 100%) for 10 minutes and two changes were performed for 100% ethanol. At the last step of dehydration, tetramethylsilane (TMS) was added and kept for ten minutes. Three changes were done to remove any residue of ethanol. The TMS was removed and the samples were dried in a desiccator under vacuum. The cover slips were attached to SEM aluminum stub and a carbon and a thin layer of Au was evaporated on the cover-slips. The SEM imaging was performed using Hitachi S4700 FESEM.
Results
Particle characterization
To understand the relationship between particle physicochemical properties and their interaction with human platelets, we studied 12 formulations of PAMAM dendrimers (Figure 1).
Figure 1. Schematic representation of dendrimers used in the current study.
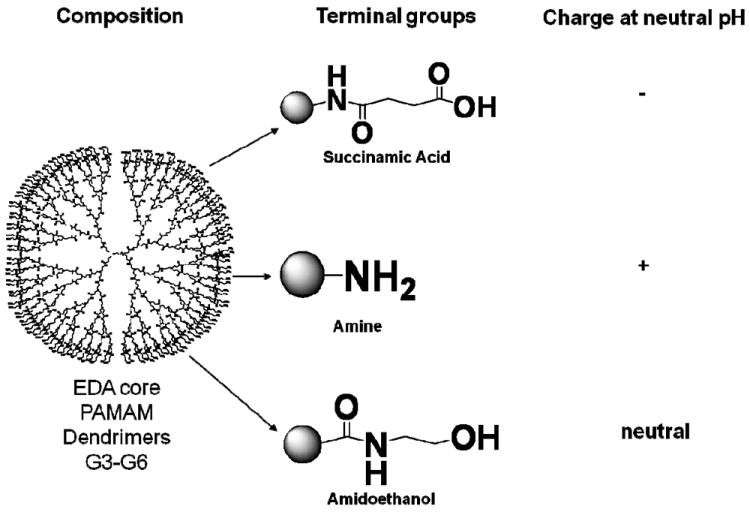
Four generations (G3, G4, G5 and G6) of PAMAM dendrimers with etylenediamine core, functionalized with succinamic acid, amine and amidoethanol groups were used in this study. PAMAM – polyamidoamine.
Particles were chosen to facilitate comparison of particles with different surface charges but same size, and particles of the same surface charge but different sizes. The same batches of particles were also used in our previous study investigating the role of particle size and surface charge in induction of leukocyte procoagulant activity33. The study included four generations (G3, G4, G5 and G6), and three surface functionalities (succinamic acid, amine, and ethanolamine terminations for negative, positive, and neutral surface charges, respectively). DLS provided information about the hydrodynamic size (diameter) of the nanoparticles in solution; this parameter is relevant to biological systems and is the only broadly accessible method to estimate the size of “soft” particles such as dendrimers 1. The zeta potential is the electrical potential at the surface, which separates the molecules that tumble with the nanoparticle in solution and the molecules of the bulk solvent. Surface charge has been shown to play a role in nanoparticle uptake and plasma-protein binding and may also be important for the interaction between nanoparticle surface and bacterial endotoxins 1, 34, 35. Therefore physicochemical characterization of nanoparticles used in this study included measurement of particle size by DLS (hydrodynamic diameter) and measurement of the zeta potential. Since endotoxin contamination of nanomaterials has been linked to false-positive results in immunological tests 34, 36, we also assessed the amounts of endotoxin in the studied formulations. The results are summarized in Table 1.
Table 1. Summary of particle characterization.
Particle hydrodynamic size was determined by Dynamic light scattering (DLS), shown is Z-average with standard deviation values (N=12). Zeta-potential as property of particle surface charge was performed using zeta-sizer (N=12). Endotoxin was measured using standard kinetic turbidity LAL assay (N=3). LAL-limulus amoebocyte lysate.
| Surface | Amine (-NH2) | Carboxy (-COOH) | Hydroxy (-OH) | ||||||
|---|---|---|---|---|---|---|---|---|---|
| Generation | Z-Ave Size DLS, nm | Zeta-potential, mV | Endotoxin, EU/mg | Z-Ave Size DLS, nm | Zeta-potential, mV | Endotoxin, EU/mg | Z-Ave Size DLS, nm | Zeta-potential, mV | Endotoxin, EU/mg |
| G3 | 3.1 ± 0.1 | 43.3 ± 2.0 | <0.500 | 3.5±0.1 | -25.7±0.9 | 0.340 | 3.0±0.1 | -5.8±0.9 | <0.005 |
| G4 | 4.2±0.1 | 34.6±0.1 | 0.625 | 4.5±0.1 | -40.0±1.4 | 0.047 | 3.8±0.1 | -3.3±1.2 | <0.005 |
| G5 | 5.5±0.1 | 43.3±0.7 | <0.050 | 5.9±0.1 | -33.8±0.7 | 0.358 | 5.1±0.1 | 4.3±0.2 | <0.005 |
| G6 | 7.5±0.1 | 46.2±1.5 | 0.060 | 7.6±0.1 | -43.3±0.5 | 0.006 | 6.5±0.1 | 14.7±0.5 | 0.029 |
Cationic but not anionic and neutral dendrimers induce platelet aggregation in vitro
Each formulation was tested at several concentrations ranging from 1.563 to 100.0 μg/mL. Hydroxyl-terminated and carboxy-terminated dendrimers did not result in aggregation of human platelets in vitro, irrespective of their size (Figure 2 A and B). No aggregation was detected in platelet rich plasma treated with small, generation 3, cationic (amine-terminated) PAMAM dendrimers (Figure 2C). However, G4, G5 and G6 cationic dendrimers resulted in platelet aggregation in a concentration-dependent manner (Figure 2C).
Figure 2. Effects of PAMAM dendrimers on platelet aggregation.
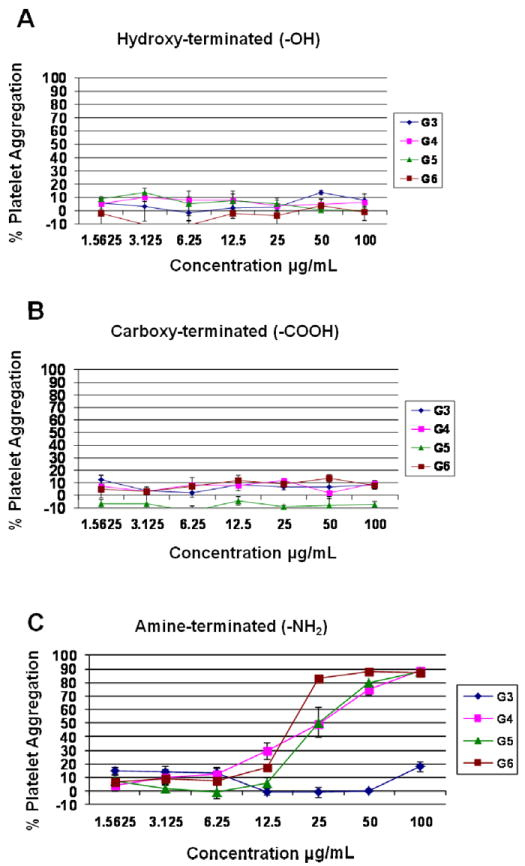
PAMAM dendrimers hydroxyterminated (A), carboxy-termnated (B) and amine terminated (C and D) were tested for a potential to induce platelet aggregation. All particles were tested at 7 concentrations: 100, 50, 25, 12.5, 6.25, 3.13, and 1.56 μg/mL. Collagen and PBS were used as positive and negative controls, respectively. Each point on the curve represents the mean of duplicate results ± standard deviation (N=3) (%CV between individual replicates < 20). (A-C) platelet aggregation results were plotted against particle concentration w/v.
Surface charge and density of terminal amines is important in dendrimer induced platelet aggregation
To explore the role of surface charge in platelet aggregation induced by cationic PAMAM dendrimers of equivalent size, we studied several formulations of G5 cationic PAMAM dendrimers, in which 100, 80, 60, 40, 20 or 0 percent of the surface amines were neutralized by capping with acetic anhydride. We observed that platelet aggregation induced by these formulations was proportional to the amount of surface amines (Figure 3).
Figure 3. Role of surface charge in dendrimer-induced platelet aggregation.
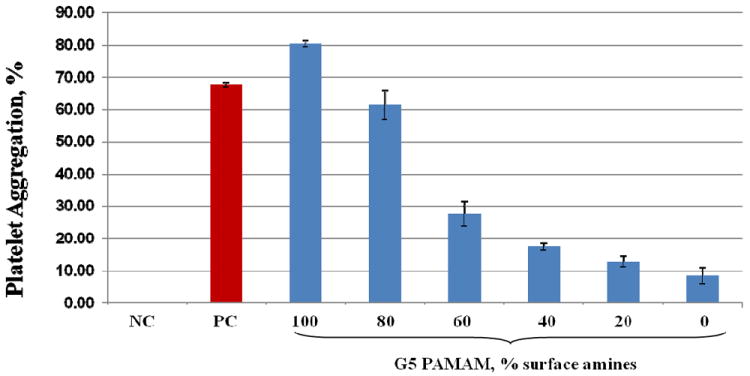
Generation 5 amine terminated PAMAM dendrimers were modified to reduce number of amine groups on the particle surface. Platelet aggregation was estimated in a number of derivatives which differ by the percentage of surface amine groups ranging from 100 to 0%. All particles were studies at concentration of 100μg/mL. Shown is test results from three independent experiments. Each bar is mean response plus standard deviation (N=6). NC- negative control (saline); PC – positive control (collagen). PAMAM – polyamidoamine.
To determine if surface charge alone is sufficient to cause platelets aggregation, we tested two other cationic molecules, a linear polymer (poly-L-lysine) and a small polycationic peptide (polymyxin B). While poly-L-lysine induced platelet aggregation regardless of molecular weight, no platelet aggregation was observed in polymyxin B treated platelets (Figure 4).
Figure 4. Effects of other cationic molecules on human platelets.
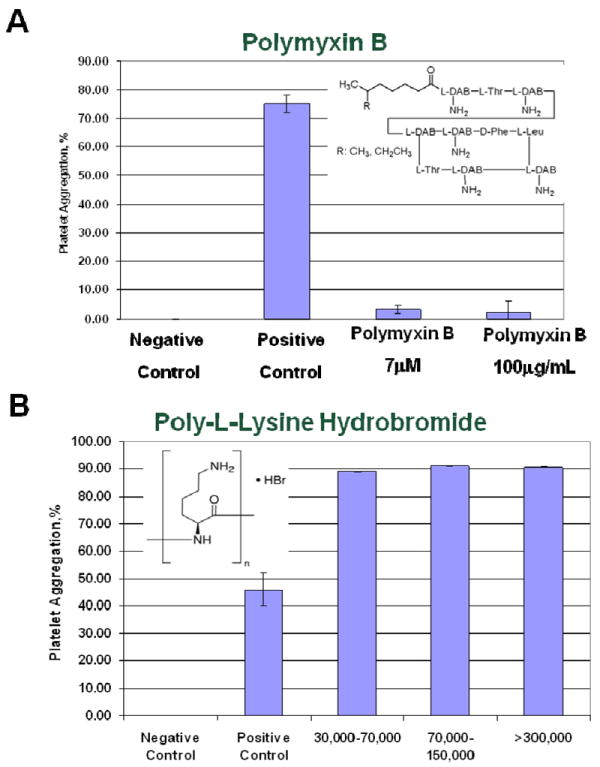
Platelet aggregation was studied with two cationic molecules (A) polycationic peptide, polymixine B, and (B) 100μg/mL of linear polymer, poly-L-lysine hydrobromide of various molecular weight (30K-70K, 70-150K and >300K) were tested. PBS and collagen were used as negative and positive controls, respectively. Shown is mean plus standard deviation (N=3).
Cationic dendrimers induce platelet aggregation through the disruption of membrance integrity
To verify that decrease in a single platelet count used to estimate platelet aggregation in these experiments is not due to the cytotoxicity of the dendrimers, we analyzed an aliquot of platelet rich plasma from aggregation experiments by scanning electron microscopy (SEM) (Figure 5) and confirmed this using traditional light transmission aggregometry (LTA) (Figure 6). Traditional LTA is a low throughput method; and was used only for cationic G3 dendrimers (non-reactive in high throughput cell-count method) and cationic G6 dendrimers (reactive in cell-count method).
Figure 5. Analysis of platelet morphology and aggregation state by scanning electron microscopy.
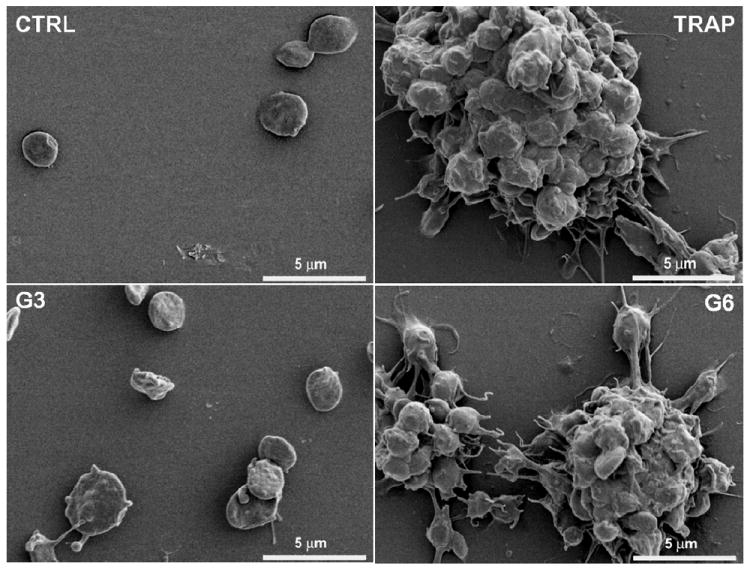
Human platelets from healthy donors were left untreated (CTRL), treated with positive control (TRAP; 20uM) or amine terminated PAMAM dendrimers generation 3 (G3; 100 μg/mL), and generation 6 (G6;100 μg/mL). After 7 minutes incubation, platelets were fixed with paraformaldehyde 2%, washed with PBS, deposited on polylysine coated cover slips, fixed with glutaraldehyde 2%, washed in cacodylate buffer, dehydrated in ethanol series followed by tetramethylsilane washing. Dried samples were spur-coated with Au before experiment.
Figure 6. Analysis of dendrimer-induced platelet aggregation by light transmission aggregometry.
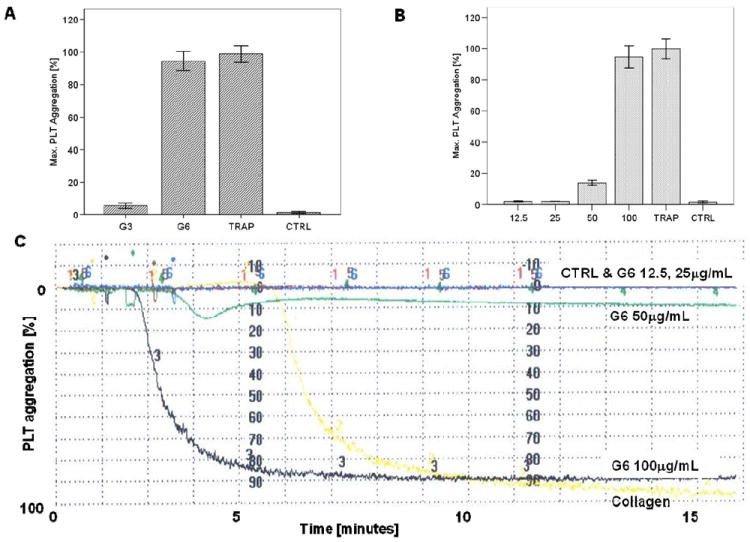
(A) G3 and G6 amine terminated PAMAM dendrimers with cationic surface were tested at concentration 100 μg/mL. (B) G6 amine terminated PAMAM dendrimers were tested at four concentrations 12.5-100 μg/mL. Each bar represents mean value plus standard deviation (N=6). TRAP and PBS were used as positive and negative controls, respectively. (C) Representative image of platelet aggregation graph showing kinetic of platelet response to various concentrations of G6 amine terminated PAMAM denrimer and controls. PAMAM- polyamidoamine.
Platelet aggregation is preceded by activation of several signaling pathways which lead to an increase in intracellular concentration of calcium ions, release of intermediate signaling molecules (e.g. ATP, thrombospondin and PDGF) from intracellular storage granulas, changes in platelet shape, development of pseudopodia, expression of activation markers on the cellular membrane, and release of procoagulant microparticles from the plasma membrane 5, 13, 14, 37. In literature reports, expression of activation markers was used to demonstrate activation of human platelets by various types of carbon-based nanomaterials 13, 38 and silver nanoparticles 7. We therefore analyzed whether dendrimer-induced platelet aggregation is accompanied by expression of activation marker CD62P on platelet surface and release of intermediate signaling molecules (thrombospondin, PDGF and ATP). Although the amine-terminated G3 dendrimer did not induce platelet aggregation, an increase in fluorescence intensity corresponding to surface exposure of CD62P was observed in both amine-terminated G3 and G6 dendrimer-treated platelets (Figure 7A). However, the analysis of FSC and SSC profiles revealed also changes in platelet morphology in dendrimer-treated samples (Figure 7B). In addition, amine-terminated G3 dendrimer treated platelets showed significantly increased binding of the isotype control antibody (the antibody of the same type as antiCD62P and labeled with the same fluorescent label, but not specific to CD62P) (Figure 7).
Figure 7. Analysis of expression of platelet activation markers CD62P by flow cytometry.
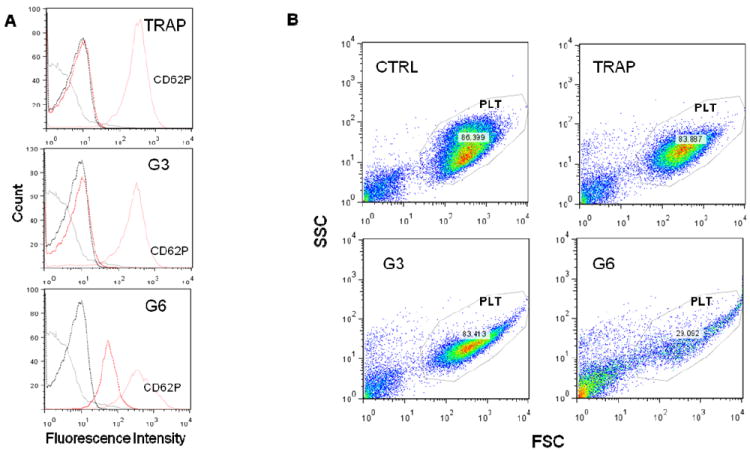
Flow cytometric analysis of platelets treated with G3 and G6 amine-terminated dendrimers. Platelets were incubated with dendrimers at concentration 25μg/mL for 20 min at 37C. 20mM TRAP treated plasma and PRP only were used as positive (TRAP) and negative (CTRL) control, respectively. Three independent experiments with platelets from different donors were performed. (A) Expression of PLT activation marker CD62P on dendrimer treated platelets. Representative histograms shown: Solid black line - nontreated PLTs; dotted black line - nontreated PLTs with isotype CTRL Mab; solid red line - dendrimer treated PLTs with CD62P Mab, Red Dotted - dendrimer treated PLTs with isotype CTRL Mab. (B) Representative FSC/SSC plots demonstrate significant desintegration of platelets (PLT gate) in G6 treated sample.TRAP – thrombine receptor activating protein (positive control); G3 – generation 3 amine terminated PAMAM dendrimer; G6 – generation 6 amine terminated PAMAM dendrimer; gray line – untreated cells isotype control; dotted black line – untreated cells CD62P; red line – treated cells CD62P; dotted red line – treated cells isotype control. PLT – platelet acquisition gate.
We also tested the release of ATP, thrombospondin and PDGF in platelets treated with large cationic dendrimers (G6), small cationic dendrimers (G3) and controls. Large but not small cationic dendrimers resulted in rapid (within first 15 min) release of ATP, thrombospondin and PDGF from cells (Supplementary Figures 1 and 2). We next checked for the presence of CD62P+CD41a+ membrane microparticles (MP) in platelet supernatants. While a clear positive response was observed in positive control treated cells, no increase in CD62P+CD41a+MP release was detected in either G3 or G6 amine-terminated dendrimer treated samples (Figure 8).
Figure 8. Analysis of platelet membrane microparticles by flow cytometry.
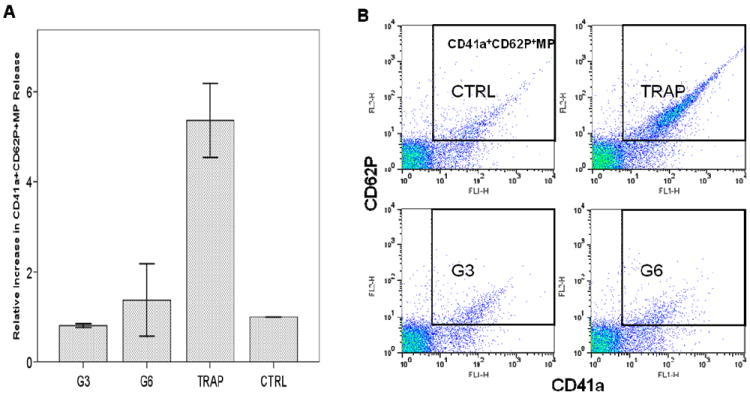
Flow cytometry analysis of the release of platelet membrane microparticles (MP) from dendrimer treated platelets. Platelets were incubated with dendrimers at concentration 25μg/mL for 20 min. at 37C; 20mM TRAP treated plasma and PRP only were used as positive (TRAP) and negative (CTRL) control, respectively. Three independent experiments with platelets from different donors were performed. (A) Relative increase in CD41a+CD62P+MP release, shown is mean ± SEM. (B) Representative double fluorescence plots of platelet CD41a+CD62P+MP.TRAP – thrombine receptor activating protein (positive control); G3 – generation 3 amine terminated PAMAM dendrimer; G6 – generation 6 amine terminated PAMAM dendrimers.
To further probe the mechanism of dendrimer induced platelet aggregation, we used a number of chemical and biological inhibitors known to interfere with various pathways of platelet activation. The inhibitors included in our study were selected so that we targeted “classical” pathways of platelet activation, such as various calcium-, αII/βIII integrin-, PAR1-, P2Y-, and COX2- activated pathways, and also non-traditional pathways such as MMP-dependent, which were suggested to be unique to nanomaterials 14. The complete list of inhibitors and pathways they interfere with is presented in Supplementary Table 1. We observed complete blocking or moderate inhibition of collagen-induced platelet aggregation with several inhibitors, while none of the inhibitors blocked or inhibited dendrimer-induced platelet aggregation (Figure 9).
Figure 9. Effect of inhibitors on dendrimer-induced platelet aggregation.
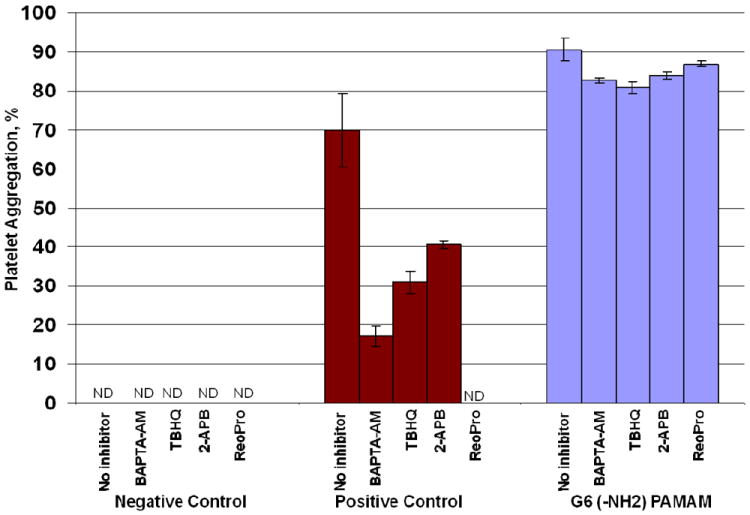
Human platelet rich plasma was left untreated, treated with collagen(positive control) or G6- amine terminated PAMAM dendrimer alone or in combination with several inhibitors. Shown is mean value plus standard deviation (N=6). G6 – generation 6 amine terminated PAMAM dendrimer; BAPTA-AM – 1,2-Bis(2-aminophenoxy)ethane-N,N,N’,N’-tetraacetic acid tetrakis(acetoxymethyl ester), membrane permeant intracellular Ca2+ chelator; TBHQ – 2,5-di-(tert-butyl)-1,4-hydroquinone, sarco-endoplasmic reticulum Ca2+ ATP-ase type 3 (SERCA3) blocker; 2-APB – 2-aminoethoxydiphenylborate, store operated calcium entry (SOCE) Ca2+ channel blocker; ReoPro – monoclonal antibody neutralizing aIIb/bIIIa integrin.
Discussion
In the present study we have demonstrated that neutral (hydroxy-terminated) and anionic (carboxy-terminated) PAMAM dendrimers did not result in aggregation of human platelets in vitro, irrespective of their size. This data is similar to other reports showing that anionic polystyrene and cetyl alcohol/polysorbate-based nanoparticles do not induce platelet aggregation, but in contrast to studies using some anionic liposome and latex nanoparticles and demonstrating their interaction with platelets 8-12. We did not observe platelet aggregation in platelet rich plasma treated with small, generation 3 (G3), cationic (amine-terminated) PAMAM dendrimers, however their larger cationic counterparts (G4, G5 and G6) resulted in platelet aggregation in a concentration-dependent manner. This data are in contrast with the findings of an earlier study which reported that platelet aggregation by cationic polystyrene particles depended inversely on particle size, with stronger effects of particles with smaller sizes 12. However, these results are in agreement with an earlier PAMAM dendrimer study which showed that cationic, but not anionic or neutral PAMAM dendrimers, were cytotoxic and caused lysis of red blood cells 39. Our finding highlighting the role of particle size in inducing platelet aggregation complements earlier studies by Kobayashi et al who demonstrated that blood clearance of PAMAM dendrimers and routes of excretion from body are determined by dendrimer size40. When dendrimers of various generations are analyzed at equal weight-per-volume concentrations, each sample has an equal numbers of total amines in solution allowing for the analysis of nanoparticle size on platelet aggregation41. When the dendrimers were compared thusly, there was clear difference between small (G3) and large (G4, G5 and G6) dendrimers, and no significant difference in platelet aggregation between G4, G5 and G6 dendrimers. To explore the role of surface charge in platelet aggregation induced by cationic PAMAM dendrimers of equivalent size, we studied several formulations of G5 cationic PAMAM dendrimers, in which 100, 80, 60, 40, 20 or 0 percent of the surface amines were neutralized by capping with acetic anhydride. We observed that platelet aggregation induced by these formulations was proportional to the amount of surface amines. Collectively, data shown in Figures 2 and 3, demonstrate that both particle size and surface charge are important physicochemical properties which determine dendrimer interaction with human platelets. To verify that decrease in a single platelet count used to estimate platelet aggregation in these experiments is not due to the cytotoxicity of the dendrimers, we analyzed an aliquot of platelet rich plasma from aggregation experiments by scanning electron microscopy (SEM) and further verified these finding by using traditional light transmission aggregometry (LTA). Traditional LTA is a low throughput method; and was used only for cationic G3 dendrimers (non-reactive in high throughput cell-count method) and cationic G6 dendrimers (reactive in cell-count method). In agreement with the data presented in Figure 2 C, platelet aggregation was not observed by LTA in G3 cationic PAMAM dendrimer treated PRP, but was comparable to that caused by the positive control in G6 treated PRP. Also in agreement with previous data, platelet aggregation induced by cationic G6 PAMAM dendrimers were concentration dependent.
Because platelet aggregation is preceded by activation of several signaling pathways which lead to an increase in intracellular concentration of calcium ions, release of intermediate signaling molecules (e.g. ATP, thrombospondin and PDGF) from intracellular storage granulas, changes in platelet shape, development of pseudopodia, expression of activation markers on the cellular membrane, and release of procoagulant microparticles from the plasma membrane 5, 13, 14, 37, we analyzed whether dendrimer-induced platelet aggregation is accompanied by expression of activation marker CD62P on platelet surface and release of intermediate signaling molecules (thrombospondin, PDGF and ATP). Although the amine-terminated G3 dendrimer did not induce platelet aggregation, an increase in fluorescence intensity corresponding to surface exposure of CD62P was observed in both amine-terminated G3 and G6 dendrimer-treated platelets.
Several light beams are used in flow cytometry when cells are passing through the detector: one beam when light is directed along the cell and called forward scatter (FSC), and several lights perpendicular to the cell, and called side scatter (SSC). The analysis FSC and SSC profiles gives useful information about the cell, in that it identifies the inner complexity of the cell such as membrane roughness, nucleus shape, type and amount of cytoplasmic granules. The analysis of FSC and SSC profiles revealed changes in platelet morphology in dendrimer-treated samples. Since platelets are anuclear cells, change in SSC is indicative of change in the state of cytoplasmic granules (degranulation) and the change in membrane roughness. In addition, amine-terminated G3 dendrimer treated platelets showed significantly increased binding of the isotype control antibody (the antibody of the same type as antiCD62P and labeled with the same fluorescent label, but not specific to CD62P). Based on these observations, we postulate that the observed CD62P positive staining of dendrimer treated platelets is caused by plasma membrane permeabilization and non-specific binding of the antibody to the disrupted plasma membrane. Release of ATP, thrombospondin and PDGF correlated with platelet aggregation described above, in that the release was observed only in platelets treated with large dendrimers (which cause platelet aggregation), and was not detected in samples treated with small dendrimers, which did not cause platelet aggregation. The release of thrombospondin and PDGF in G6 dendrimer treated samples occurred very rapidly, further suggesting mechanical damage rather than a signaling-mediated event. CD62P+CD41a+ membrane microparticles (MP) represent another marker of platelet aggregation and activation. While a clear positive response was observed in positive control treated cells, we were unable to detect an increase in CD62P+CD41a+MP release in either G3 or G6 amine-terminated dendrimer treated samples. These data further suggest that the platelet plasma membrane is likely damaged by the dendrimer treatment, preventing a highly controlled vesiculation process such as MP release. To further verify that cationic dendrimers cause platelet plasma membrane damage rather than a specific signaling to induce platelet aggregation, we used a number of chemical and biological inhibitors known to interfere with various pathways of platelet activation. While complete blocking to moderate inhibition of collagen-induced platelet aggregation was observed with several inhibitors, in agreement with published studies 13, 14, none of the inhibitors blocked or inhibited dendrimer-induced platelet aggregation.
Several earlier studies with dimyristoyl-sn-glycero-3-phosphocholine (DMPC) supported lipid bilayers and computer simulation 22-24, 26, 27 have shown that all PAMAM dendrimers intersperse into lipid bilayers, but only cationic PAMAM dendrimers result in changes in membrane layers, and larger dendrimers lead to hole formation. Such hole formation allows for molecular transport across membranes. This property of cationic PAMAM dendrimers, also called “dendroporation” was stronger with increasing generation 22-24, 26. Another modeling study suggested that cationic PAMAM dendirmers can be used to pull together two anionic lipid layers 42. This leads us to propose that in contrast to carbon-based nanomatrials 13, 14 and silver nanoparticles 7 platelet aggregation by cationic PAMAM dendrimers is not due to induction of classical pathways leading to platelet activation, but is rather due to the alterations in lipid bilayers.
In summary, we demonstrated that cationic, but not anionic or neutral PAMAM dendrimers, induced aggregation of human platelets in vitro, that this aggregation was determined by the particle size and surface charge, was not associated with membrane microparticle release, and was insensitive to various chemical and biological inhibitors of platelet activation. The results of our in vitro study are in agreement with recent study by Greish et al who reported coagulation toxicity in vivo in mice treated with cationic but not anionic PAMAM dendrimers43. The results of our study provide information about structure activity relationship of PAMAM dendrimers in terms of their interaction with human platelets in vitro. These data may contribute to and further expand the framework of nanoperiodic property recently proposed by Tomalia44. Based on our data and previously published membrane modeling studies, we propose a model for cationic PAMAM dendrimer-induced platelet aggregation in which aggregation is caused by alterations in the integrity of the platelet plasma membrane and is not triggered by conventional platelet activation signaling pathways. Interestingly, a recent study suggests that cationic polystyrene latex particles induce platelet aggregation through disruption of membrane integrity 45. Thus a disruption of membrane integrity may become a common platelet aggregation mechanism for different classes of cationic nanomaterials.
Supplementary Material
Acknowledgments
This project has been funded in whole or in part with federal funds from the National Cancer Institute, National Institutes of Health, under contract N01-CO-12400 and HHSN261200800001E. The content of this publication does not necessarily reflect the views or policies of the Department of Health and Human Services, nor does mention of trade names, commercial products, or organizations imply endorsement by the U.S. Government. The findings and conclusions in this article have not been formally disseminated by the Food and Drug Administration and should not be construed to represent any Agency determination or policy. We thank Nader Ayub, Kent Worthington, Barry Neun, David Parmiter and Jamie Rodriguez for excellent technical support.
References
- 1.Hall JB, Dobrovolskaia MA, Patri AK, McNeil SE. Characterization of nanoparticles for therapeutics. Nanomedicine (Lond) 2007;2:789–803. doi: 10.2217/17435889.2.6.789. [DOI] [PubMed] [Google Scholar]
- 2.Cedervall T, Lynch I, Lindman S, Berggard T, Thulin E, Nilsson H, Dawson KA, Linse S. Understanding the nanoparticle-protein corona using methods to quantify exchange rates and affinities of proteins for nanoparticles. Proc Natl Acad Sci U S A. 2007;104:2050–5. doi: 10.1073/pnas.0608582104. [DOI] [PMC free article] [PubMed] [Google Scholar]
- 3.Lundqvist M, Stigler J, Elia G, Lynch I, Cedervall T, Dawson KA. Nanoparticle size and surface properties determine the protein corona with possible implications for biological impacts. Proc Natl Acad Sci U S A. 2008;105:14265–70. doi: 10.1073/pnas.0805135105. [DOI] [PMC free article] [PubMed] [Google Scholar]
- 4.Lynch I, Cedervall T, Lundqvist M, Cabaleiro-Lago C, Linse S, Dawson KA. The nanoparticle-protein complex as a biological entity; a complex fluids and surface science challenge for the 21st century. Adv Colloid Interface Sci. 2007;134-135:167–74. doi: 10.1016/j.cis.2007.04.021. [DOI] [PubMed] [Google Scholar]
- 5.Simak J. Nanotoxicity in blood: effects of engineered nanomaterials on platelets. In: Sahu SC, Casciano DA, editors. Nanotoxicity: from in vivo and in vitro models to health risks. A John Wiley and Sons Ltd; 2009. pp. 191–225. [Google Scholar]
- 6.Stamopoulos D, Manios E, Gogola V, Benaki D, Bouziotis P, Niarchos D, Pissas M. Bare and protein-conjugated Fe(3)O(4) ferromagnetic nanoparticles for utilization in magnetically assisted hemodialysis: biocompatibility with human blood cells. Nanotechnology. 2008;19 doi: 10.1088/0957-4484/19/50/505101. 505101. [DOI] [PubMed] [Google Scholar]
- 7.Jun EA, Lim KM, Kim K, Bae ON, Noh JY, Chung KH, Chung JH. Silver nanoparticles enhance thrombus formation through increased platelet aggregation and procoagulant activity. Nanotoxicology. 2010 doi: 10.3109/17435390.2010.506250. [DOI] [PubMed] [Google Scholar]
- 8.Koziara JM, Oh JJ, Akers WS, Ferraris SP, Mumper RJ. Blood compatibility of cetyl alcohol/polysorbate-based nanoparticles. Pharm Res. 2005;22:1821–8. doi: 10.1007/s11095-005-7547-7. [DOI] [PubMed] [Google Scholar]
- 9.Zbinden G, Wunderli-Allenspach H, Grimm L. Assessment of thrombogenic potential of liposomes. Toxicology. 1989;54:273–80. doi: 10.1016/0300-483x(89)90063-2. [DOI] [PubMed] [Google Scholar]
- 10.Miyamoto M, Sasakawa S, Ozawa T, Kawaguchi H, Ohtsuka Y. Platelet aggregation induced by latex particles. I. Effects of size, surface potential and hydrophobicity of particles. Biomaterials. 1989;10:251–7. doi: 10.1016/0142-9612(89)90101-4. [DOI] [PubMed] [Google Scholar]
- 11.Miyamoto M, Sasakawa S, Ozawa T, Kawaguchi H, Ohtsuka Y. Mechanisms of blood coagulation induced by latex particles and the roles of blood cells. Biomaterials. 1990;11:385–8. doi: 10.1016/0142-9612(90)90091-4. [DOI] [PubMed] [Google Scholar]
- 12.Mayer A, Vadon M, Rinner B, Novak A, Wintersteiger R, Frohlich E. The role of nanoparticle size in hemocompatibility. Toxicology. 2009;258:139–47. doi: 10.1016/j.tox.2009.01.015. [DOI] [PubMed] [Google Scholar]
- 13.Semberova J, De Paoli Lacerda SH, Simakova O, Holada K, Gelderman MP, Simak J. Carbon nanotubes activate blood platelets by inducing extracellular Ca2+ influx sensitive to calcium entry inhibitors. Nano Lett. 2009;9:3312–7. doi: 10.1021/nl901603k. [DOI] [PubMed] [Google Scholar]
- 14.Radomski A, Jurasz P, Alonso-Escolano D, Drews M, Morandi M, Malinski T, Radomski MW. Nanoparticle-induced platelet aggregation and vascular thrombosis. Br J Pharmacol. 2005;146:882–93. doi: 10.1038/sj.bjp.0706386. [DOI] [PMC free article] [PubMed] [Google Scholar]
- 15.Cejas MA, Chen C, Kinney WA, Maryanoff BE. Nanoparticles that display short collagen-related peptides. Potent stimulation of human platelet aggregation by triple helical motifs. Bioconjug Chem. 2007;18:1025–7. doi: 10.1021/bc070105s. [DOI] [PubMed] [Google Scholar]
- 16.Okamura Y, Handa M, Suzuki H, Ikeda Y, Takeoka S. New strategy of platelet substitutes for enhancing platelet aggregation at high shear rates: cooperative effects of a mixed system of fibrinogen gamma-chain dodecapeptide- or glycoprotein Ibalpha-conjugated latex beads under flow conditions. J Artif Organs. 2006;9:251–8. doi: 10.1007/s10047-006-0345-0. [DOI] [PubMed] [Google Scholar]
- 17.Zhu J, Xue J, Guo Z, Zhang L, Marchant RE. Biomimetic glycoliposomes as nanocarriers for targeting P-selectin on activated platelets. Bioconjug Chem. 2007;18:1366–9. doi: 10.1021/bc700212b. [DOI] [PubMed] [Google Scholar]
- 18.Fernandes EG, de Queiroz AA, Abraham GA, San Roman J. Antithrombogenic properties of bioconjugate streptokinase-polyglycerol dendrimers. J Mater Sci Mater Med. 2006;17:105–11. doi: 10.1007/s10856-006-6813-5. [DOI] [PubMed] [Google Scholar]
- 19.Kim Y, Klutz AM, Hechler B, Gao ZG, Gachet C, Jacobson KA. Application of the functionalized congener approach to dendrimer-based signaling agents acting through A(2A) adenosine receptors. Purinergic Signal. 2009;5:39–50. doi: 10.1007/s11302-008-9113-3. [DOI] [PMC free article] [PubMed] [Google Scholar]
- 20.Marx V. Poised to branch out. Nat Biotechnol. 2008;26:729–32. doi: 10.1038/nbt0708-729. [DOI] [PubMed] [Google Scholar]
- 21.Biricova V, Laznickova A. Dendrimers: Analytical characterization and applications. Bioorg Chem. 2009;37:185–92. doi: 10.1016/j.bioorg.2009.07.006. [DOI] [PubMed] [Google Scholar]
- 22.Hong S, Bielinska AU, Mecke A, Keszler B, Beals JL, Shi X, Balogh L, Orr BG, Baker JR, Jr, Banaszak Holl MM. Interaction of poly(amidoamine) dendrimers with supported lipid bilayers and cells: hole formation and the relation to transport. Bioconjug Chem. 2004;15:774–82. doi: 10.1021/bc049962b. [DOI] [PubMed] [Google Scholar]
- 23.Hong S, Leroueil PR, Janus EK, Peters JL, Kober MM, Islam MT, Orr BG, Baker JR, Jr, Banaszak Hol MM. Interaction of polycationic polymers with supported lipid bilayers and cells: nanoscale hole formation and enhanced membrane permeability. Bioconjug Chem. 2006;17:728–34. doi: 10.1021/bc060077y. [DOI] [PubMed] [Google Scholar]
- 24.Kelly CV, Leroueil PR, Orr BG, Banaszak Holl MM, Andricioaei I. Poly(amidoamine) dendrimers on lipid bilayers II: Effects of bilayer phase and dendrimer termination. J Phys Chem B. 2008;112:9346–53. doi: 10.1021/jp8013783. [DOI] [PMC free article] [PubMed] [Google Scholar]
- 25.Lee H, Larson RG. Molecular dynamics simulations of PAMAM dendrimer-induced pore formation in DPPC bilayers with a coarse-grained model. J Phys Chem B. 2006;110:18204–11. doi: 10.1021/jp0630830. [DOI] [PubMed] [Google Scholar]
- 26.Martin H, Kinns H, Mitchell N, Astier Y, Madathil R, Howorka S. Nanoscale protein pores modified with PAMAM dendrimers. J Am Chem Soc. 2007;129:9640–9. doi: 10.1021/ja0689029. [DOI] [PubMed] [Google Scholar]
- 27.Marrink SJ, de Vries AH, Mark AE. Coarse grained model for semiquantitative lipid simulations. J Phys Chem B. 2004;108:750–760. [Google Scholar]
- 28.Patri AK, Myc A, Beals J, Thomas TP, Bander NH, Baker JR., Jr Synthesis and in vitro testing of J591 antibody-dendrimer conjugates for targeted prostate cancer therapy. Bioconjug Chem. 2004;15:1174–81. doi: 10.1021/bc0499127. [DOI] [PubMed] [Google Scholar]
- 29.US FDA CDER.,CBER.,CDRH., and CVM. Guideline on validation of the Limulus Amebocyte Lysate test as an end-product endotoxin test for humanand animal parenteral drugs, biological products, and medical devices. CDER CBER CDRH CVM; Rockville, MD: 1987. p. 20857. [Google Scholar]
- 30.USP 30 NF 25. Bacterial endotoxins test. 2007;1(85) [Google Scholar]
- 31.Simak J, Gelderman MP, Yu H, Wright V, Baird AE. Circulating endothelial microparticles in acute ischemic stroke: a link to severity, lesion volume and outcome. J Thromb Haemost. 2006;4:1296–302. doi: 10.1111/j.1538-7836.2006.01911.x. [DOI] [PubMed] [Google Scholar]
- 32.Gelderman MP, Simak J. Flow cytometric analysis of cell membrane microparticles. Methods Mol Biol. 2008;484:79–93. doi: 10.1007/978-1-59745-398-1_6. [DOI] [PubMed] [Google Scholar]
- 33.Dobrovolskaia MA, Patri AK, Potter TM, Rodriguez JC, Hall JB, McNeil SE. Dendrimer-induced leukocyte procoagulant activity depends on particle size and surface charge. Nanomedicine (Lond) 2011 doi: 10.2217/nnm.11.105. [DOI] [PubMed] [Google Scholar]
- 34.Dobrovolskaia MA, Germolec DR, Weaver JL. Evaluation of nanoparticle immunotoxicity. Nat Nanotechnol. 2009;4:411–4. doi: 10.1038/nnano.2009.175. [DOI] [PubMed] [Google Scholar]
- 35.Jones CF, Grainger DW. In vitro assessments of nanomaterial toxicity. Adv Drug Deliv Rev. 2009;61:438–56. doi: 10.1016/j.addr.2009.03.005. [DOI] [PMC free article] [PubMed] [Google Scholar]
- 36.Vallhov H, Qin J, Johansson SM, Ahlborg N, Muhammed MA, Scheynius A, Gabrielsson S. The importance of an endotoxin-free environment during the production of nanoparticles used in medical applications. Nano Lett. 2006;6:1682–6. doi: 10.1021/nl060860z. [DOI] [PubMed] [Google Scholar]
- 37.Miller VM, Hunter LW, Chu K, Kaul V, Squillace PD, Lieske JC, Jayachandran M. Biologic nanoparticles and platelet reactivity. Nanomedicine (Lond) 2009;4:725–33. doi: 10.2217/nnm.09.61. [DOI] [PMC free article] [PubMed] [Google Scholar]
- 38.Bihari P, Holzer M, Praetner M, Fent J, Lerchenberger M, Reichel CA, Rehberg M, Lakatos S, Krombach F. Single-walled carbon nanotubes activate platelets and accelerate thrombus formation in the microcirculation. Toxicology. 2010;269:148–54. doi: 10.1016/j.tox.2009.08.011. [DOI] [PubMed] [Google Scholar]
- 39.Malik N, Wiwattanapatapee R, Klopsch R, Lorenz K, Frey H, Weener JW, Meijer EW, Paulus W, Duncan R. Dendrimers: relationship between structure and biocompatibility in vitro, and preliminary studies on the biodistribution of 125I-labelled polyamidoamine dendrimers in vivo. J Control Release. 2000;65:133–48. doi: 10.1016/s0168-3659(99)00246-1. [DOI] [PubMed] [Google Scholar]
- 40.Kobayashi H, Kawamoto S, Jo SK, Bryant HL, Jr, Brechbiel MW, Star RA. Macromolecular MRI contrast agents with small dendrimers: pharmacokinetic differences between sizes and cores. Bioconjug Chem. 2003;14:388–94. doi: 10.1021/bc025633c. [DOI] [PubMed] [Google Scholar]
- 41.Tomalia D. The dendritic state. Materials Today. 2005 Mar;:34–46. [Google Scholar]
- 42.Khopade AJ, Shenoy DB, Khopade SA, Jain NK. Phase structures of a hydrated anionic phospholipid composition containing cationic dendrimers and pegylated lipids. Langmuir. 2004;20:7368–73. doi: 10.1021/la049682k. [DOI] [PubMed] [Google Scholar]
- 43.Greish K, Thiagarajan G, Herd H, Price R, Bauer H, Hubbard D, Burckle A, Sadekar S, Yu T, Anwar A, Ray A, Ghandehari H. Size and surface charge significantly influence the toxicity of silica and dendritic nanoparticles. Nanotoxicology. 2011 doi: 10.3109/17435390.2011.604442. [DOI] [PubMed] [Google Scholar]
- 44.Tomalia DA. In quest of a systematic framework for unifying and defining nanoscience. J Nanopart Res. 2009;11:1251–1310. doi: 10.1007/s11051-009-9632-z. [DOI] [PMC free article] [PubMed] [Google Scholar]
- 45.McGuinnes C, Duffin R, Brown S, N LM, Megson IL, Macnee W, Johnston S, Lu SL, Tran L, Li R, Wang X, Newby DE, Donaldson K. Surface derivatization state of polystyrene latex nanoparticles determines both their potency and their mechanism of causing human platelet aggregation in vitro. Toxicol Sci. 2011;119:359–68. doi: 10.1093/toxsci/kfq349. [DOI] [PubMed] [Google Scholar]
Associated Data
This section collects any data citations, data availability statements, or supplementary materials included in this article.