

Abstract
Background:
Algorithm evaluation provides a means to characterize variability across image analysis algorithms, validate algorithms by comparison with human annotations, combine results from multiple algorithms for performance improvement, and facilitate algorithm sensitivity studies. The sizes of images and image analysis results in pathology image analysis pose significant challenges in algorithm evaluation. We present an efficient parallel spatial database approach to model, normalize, manage, and query large volumes of analytical image result data. This provides an efficient platform for algorithm evaluation. Our experiments with a set of brain tumor images demonstrate the application, scalability, and effectiveness of the platform.
Context:
The paper describes an approach and platform for evaluation of pathology image analysis algorithms. The platform facilitates algorithm evaluation through a high-performance database built on the Pathology Analytic Imaging Standards (PAIS) data model.
Aims:
(1) Develop a framework to support algorithm evaluation by modeling and managing analytical results and human annotations from pathology images; (2) Create a robust data normalization tool for converting, validating, and fixing spatial data from algorithm or human annotations; (3) Develop a set of queries to support data sampling and result comparisons; (4) Achieve high performance computation capacity via a parallel data management infrastructure, parallel data loading and spatial indexing optimizations in this infrastructure.
Materials and Methods:
We have considered two scenarios for algorithm evaluation: (1) algorithm comparison where multiple result sets from different methods are compared and consolidated; and (2) algorithm validation where algorithm results are compared with human annotations. We have developed a spatial normalization toolkit to validate and normalize spatial boundaries produced by image analysis algorithms or human annotations. The validated data were formatted based on the PAIS data model and loaded into a spatial database. To support efficient data loading, we have implemented a parallel data loading tool that takes advantage of multi-core CPUs to accelerate data injection. The spatial database manages both geometric shapes and image features or classifications, and enables spatial sampling, result comparison, and result aggregation through expressive structured query language (SQL) queries with spatial extensions. To provide scalable and efficient query support, we have employed a shared nothing parallel database architecture, which distributes data homogenously across multiple database partitions to take advantage of parallel computation power and implements spatial indexing to achieve high I/O throughput.
Results:
Our work proposes a high performance, parallel spatial database platform for algorithm validation and comparison. This platform was evaluated by storing, managing, and comparing analysis results from a set of brain tumor whole slide images. The tools we develop are open source and available to download.
Conclusions:
Pathology image algorithm validation and comparison are essential to iterative algorithm development and refinement. One critical component is the support for queries involving spatial predicates and comparisons. In our work, we develop an efficient data model and parallel database approach to model, normalize, manage and query large volumes of analytical image result data. Our experiments demonstrate that the data partitioning strategy and the grid-based indexing result in good data distribution across database nodes and reduce I/O overhead in spatial join queries through parallel retrieval of relevant data and quick subsetting of datasets. The set of tools in the framework provide a full pipeline to normalize, load, manage and query analytical results for algorithm evaluation.
Keywords: Algorithm validation, parallel database, pathology imaging, spatial database
INTRODUCTION
Digital microscopy for pathology study has recently become a popular research area where a large number of computer-based image analysis tools are developed to support not only disease diagnosis but also treatment efficacy evaluation in clinical and research settings. Meanwhile, machine-based image analysis presents salient merits that facilitate researchers for better understanding of the underlying biological mechanisms of disease progression. In contrast to digital microscopy image analysis, the human-based traditional glass reviewing protocols are biased, limited, and qualitative. As a result, it is not unusual to see the low inter- and intra-observer concordance, and poor reviewing reproducibility. These defects severely preclude the possibility of fully leveraging pathology imaging data in clinical and biomedical research.
The performance of computer-based analysis is highly consistent, whereas performance of human-based reviews can drastically drop when the scope of analysis is scaled up, for instance, to the order of millions of nuclei per tumor sample. Unlike pathologists, computer-based analysis is not vulnerable to the analytic scale. Furthermore, the capacity of large-scale analysis by machines enables a more definitive data process, thereby reducing bias. Analyses accommodating large data by machines also facilitate discovery of significant associations that would be identified at a much larger cost of human labor and time. Moreover, machine-based analysis on digital slides extends the scope of descriptive features from those appreciated by pathology domain experts to those not perceived by the human visual detection system, thereby presenting great potential for biologically meaningful subclassification of disease and for informing human reviewers of features that are clinically relevant. In literature, it has been demonstrated that pathology imaging data contains rich and biologically meaningful phenotypic information that can be extracted by image processing pipelines to link to underlying molecular alterations and clinical outcomes, potentially providing a high-throughput methodology for clinical diagnosis and investigation.[1–6] Recent advancements in high-resolution high-throughput digital scanners have also enabled rapid development of computer-based histopathology image analysis for virtual microscopy. Additionally, computational and storage infrastructures for large-scale microscopic image analysis have been improved to enable high performance and parallel computations with large I/O throughput support.
In transition to digital pathology, computer-based image analysis, however, invites one critical problem–evaluation and validation of image analysis algorithms. To ensure the analysis accuracy and biological meaning of imaging information, evaluation and validation of image analysis algorithms is an indispensable component in biomedical imaging studies. As the efficacy of an analysis pipeline generally depends on numerous factors, such as the characteristics of specimens and images used in the study, types of image processing operations employed, and the study objectives, algorithms have to be carefully validated. A systematic approach for algorithm evaluation can facilitate the development of refined algorithms to better support biomedical research and computer-aided diagnosis. It can also substantially help the development of common training and test datasets from various sources to establish public shared data archives with well-understood ground truth and algorithm performance, encouraging further algorithm evaluation in a community of researchers. However, an algorithm evaluation framework has to address data processing, management, and query requirements arising from large volumes of image data and analysis results. We propose, develop, and evaluate a high performance, database-supported system to support validation and comparison of image analysis algorithms targeting high-resolution microscopy images.
Our work is motivated by whole slide image analysis studies carried out as part of integrative in silico experiments at the In Silico Brain Tumor Research Center (ISBTRC).[7] ISBTRC is a collaborative effort of four institutions: Emory University, Thomas Jefferson University, Henry Ford Hospital, and Stanford University, and focuses on integrative translational research on brain tumors by analyzing complementary data types (genomics, imaging, clinical outcome). Microscopy image analysis algorithms are central to in silico experiments at ISBTRC. These algorithms are used to extract, quantify, and classify the spatial features from high-resolution whole slide tissue images. The results from image analyses are correlated with genomic and clinical outcome data to identify better biomarkers and mechanisms of disease progression. In this paper, we focus on segmentation algorithms as a case study. The segmentation step in pathology image analysis is critical to the success of downstream analysis steps such as feature computation and classification.
The need for algorithm evaluation and comparison arises in many ISBTRC image analysis cases. (i) Algorithm validation. Algorithms are tested, evaluated and improved in an iterative manner. This involves a formal testing phase where segmentations done by pathologists are captured and compared to an algorithm's output. The results are evaluated to assess inter-observer variability between pathologists, between algorithms and humans, and between different algorithms. (ii) Algorithm consolidation. Multiple algorithms can be developed in a study to solve the same problem. Different algorithms may have their own unique strengths on analyzing images with certain characteristics. In those cases, an array of algorithms can be aggregated in a complementary way. Consolidating results from multiple algorithms (i.e., an ensemble approach) may lead to better analysis results. (iii) Algorithm sensitivity studies. An algorithm often includes a set of parameters that can be adjusted to adapt to different types, resolutions, and qualities of images. Exploring the sensitivity of analysis output with respect to parameter adjustments can provide a guideline for the best deployment of algorithms in different scenarios and for rapid development of robust algorithms.
A major challenge to efficient execution of these cases is the vast amount of image data and analysis results. State-of-the-art tissue slide scanners are capable of producing high-magnification, high-resolution images from whole slides and tissue microarrays within minutes. One single whole slide image can contain 1010 pixels and 106-107 biological objects of interest, such as nuclei. A brute-force pair-wise comparison between results from two analysis sets could incur a complexity of O (n2)–1012 operations, where n is the number of objects, with additional extensive Input/Output (I/O) cost for reading the data. An efficient mechanism is needed to manage large volumes of results (along with provenance information). Moreover, the mechanism should support computational and data intensive queries–such as spatial join queries for comparison of image markups associated with different analysis results.
Algorithm validation has been studied for medical imaging.[8] Much work has been done on model design for image analysis results, including the work by the NCI Annotation and Image Markup project[9] for radiology images, the Open Microscopy Environment project for cell imaging,[10] and DICOM Structural Reporting for human annotations.[11] Biomedical imaging databases have been developed for managing results.[10,12–14] However, they are not designed to provide support for data querying and retrieval for algorithm evaluation workflows. The use of parallel and distributed computing for analysis enables researchers to process image data rapidly and produce large volumes of analysis results. For example, a distributed system has been developed by Yang et al., for computer-aided analysis of digitized breast tissue specimens.[15] Our work differs in that we propose a database-based approach to support algorithm evaluation by systematically (1) managing large-scale results from algorithms and human annotations, and (2) supporting efficient queries with a parallel spatial database architecture.
MATERIALS AND METHODS
Algorithm Evaluation Workflows and Queries
A typical algorithm comparison workflow employed in ISBTRC studies consists of the following steps [Figure 1]: (1) multiple algorithms or algorithms with different parameters are applied to non-overlapping image tiles partitioned from whole slide images. Note that tiling is a common practice for pathology image analysis. Tiling an image is done either by padding tile boundaries to include objects on boundaries (in most cases, objects, such as cells and nuclei, are relatively small), or objects on tile boundaries are discarded when the final analysis result is a statistical aggregation; (2) results and provenance information are represented and managed in a database; (3) the results are queried for comparisons of objects and features extracted by the algorithms–for example, to find the overlap-to-intersection ratio and centroid distance of intersected markups; and (4) for algorithm consolidation, analysis results are either filtered or aggregated based on certain criteria, and for algorithm sensitivity study, changes in results are recorded and stored as algorithm parameters are tuned. Algorithms are applied to image tiles comprising whole slide images, thus the process of executing algorithms and carrying out result comparison is highly data and computational intensive. In this paper, we focus on the data management and query aspect. The workflow execution is left for future discussions.
Figure 1.
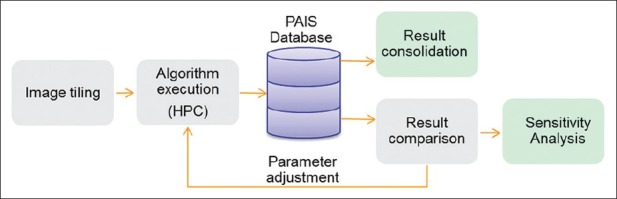
Algorithm comparison workflow
We should note that this workflow can be modified to support algorithm validation, in which algorithm results are compared with human annotations, as seen in Figure 2. Even a single tile derived from a whole-slide image can contain tens of thousands of nuclei, making it infeasible for human annotators to mark boundaries for all objects in a tile. Thus, the algorithm validation workflow divides tiles into smaller regions (subregions) where validation work becomes manageable–e.g., a subregion could be an 8 × 8 division of a tile. As discussed later, we take a stratified sampling approach for deciding the sample size and subregion size. In this way, an image dataset used in validation is organized by three hierarchical spatial concepts in increasing order of granularity: Slide, tile, and subregion.
Figure 2.
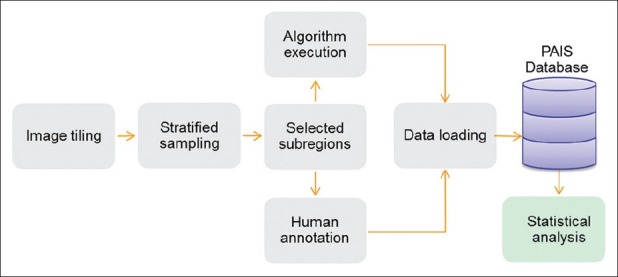
Algorithm validation workflow
These two workflows involve several common query types. The first type of query is the spatial join query, i.e., spatial operations used to combine two or more datasets with respect to a spatial relationship. Two steps are involved in this query type: Spatial filtering based on spatial relationships, such as intersection, and spatial measurements based on computational geometry algorithms, such as area, centroid, distance, and union of polygons. In our case, all comparisons on segmentation results are performed through spatial joins by computing overlap-to-intersection ratio and centroid distance of markup pairs represented in polygons. The second type of query is the spatial containment query. In some cases, algorithm-generated results in certain regions are used for validation or comparison purposes. In this case, containing regions are pre-generated for subsequent analysis as a filtering condition, with which nuclei in tumor regions are retrieved by a spatial containment query that only returns markup objects of nuclei contained in elected tumor regions. The third type of query involves finding objects contained in subregions and computing the density of those objects. This type of query is useful in spatial sampling approaches for algorithm validation. For example, a stratified sampling method can use this type of query to select subregions grouped by the densities of objects in those subregions.
Statistical Sample Size Estimation
For statistical sample size estimation, it is necessary to obtain prior information such as mean, variation or proportion in order to carry out the calculation. Once the pilot data are available, several validation methods on comparing the automatic algorithm and human observer (s) can be conducted. Those evaluation metrics will be calculated at both nucleus level and region of interest level. The mean and standard deviation along with other statistical measures will be used in sample size consideration.
Total sample size determination. For the distance-based and area-based approaches, normality will be assumed (if highly screwed, logarithm or logit transformation may be used). Sample size calculation will be based on the hypothesis test that the measure of interest equals to a threshold. The estimated sample size would assure that there is adequate power to detect a departure from the null hypothesized value.
Sample size determination for stratified sampling. Before sampling ROIs, an image will be partitioned into non-overlapping tiles. Based on certain feature, those tiles can be classified into mutually exclusive categories which will serve as strata in stratified sampling process. One stratified sampling approach is to use proportionate stratification, in which each stratum's sample size is proportional to the total size of that stratum. Sample size of each stratum is determined by  , where Nh is the sample size for stratum h, Nh is the total size for stratum h, N is the total population size, and n is the total sample size. Disproportionate stratification with optimum allocation would be another choice, in which each stratum's sample size is proportional to the standard deviation of the distribution of the feature being stratified on, so that more samples would be
  allocated to the stratum with higher variability to achieve the sample strategy with the lease sampling variance. The way of optimal allocation, called Neyman allocation, is given by
 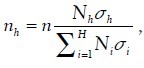 , where Nh is the sample size for stratum h, n is the total sample size, Nh is the total size for stratum h, and σh is the standard deviation of stratum h (obtained from pilot data). Consequently, the overall
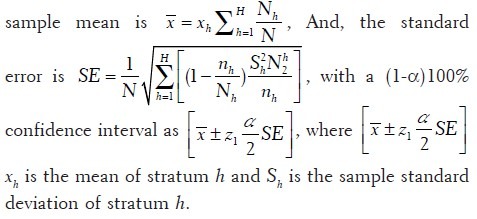
Spatial Data Normalization
One of the major gaps in the process of deriving analytical results from image analysis algorithms or human annotations is to validate and normalize spatial boundaries as valid geometric shapes stipulated by spatial databases. For example, the following is a list of requirements of a valid polygon based on Open Geospatial Consortium standards for simple feature access:[16] (i) Polygons are topologically closed; (ii) The boundary of a polygon consists of a set of linear rings that make up the exterior and interior boundaries; (iii) No two rings in the boundary cross, and the rings in the boundary of a polygon may intersect at a point but only as a tangent; (iv) A polygon may not have cut lines, spikes or punctures; (v) The interior of every polygon is a connected point set; and (vi) The exterior of a polygon with one or more holes is not connected, and each hole defines a connected component of the exterior. Note that there could be objects in the shape of MultiPolygon, which is a collection of multiple polygons. Examples include representing lakes in geographic information system (GIS) applications, or complex blood vessels segmented from whole slide images. Here we focus on normalizing polygon objects, which are most frequently used in our use case. Normalizing other types such as MultiPolygons can be implemented similarly.
Image segmentation algorithms often generate segmented contours represented by mask images, and tools are used to extract contours from mask images as point represented boundaries. For example, OpenCV[17] provides a function findcontours to dump contours into boundaries consisting of points. The machine generated boundaries, however, are often full of invalid geometric shapes. Besides algorithm generated boundaries, users can also mark contours through free hand drawing with whole slide image viewing software such as Aperio's Image Scope.[18] The resulting boundaries are subject to human's ability for precise control of mouse movement and are often error-prone. Based on our observations and extensive study of the use cases, we identify the following major problematic shapes (here we focus on polygon data only):
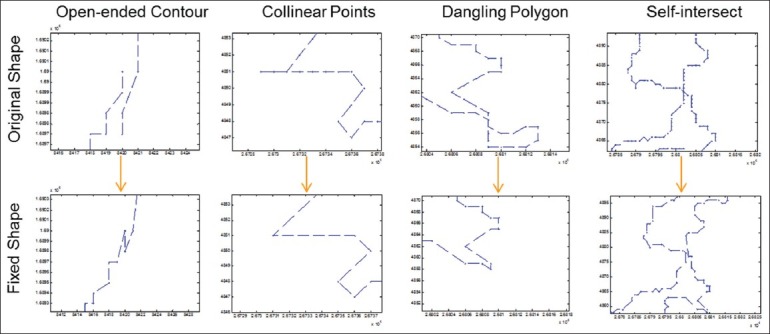
Open-ended Contour
Contours where starting and end points are not identical [Figure 3a]. A straight-forward correction is to connect the starting and ending points provided there are no conflicting segments like self-intersect. Otherwise, it will be further handled as a self-intersect scenario.
Figure 3.
Example use cases of boundary normalization (only a subset is illustrated)
Twisted Contours
Contours whose directions are changing although the shapes are correct, and it is impossible to iterate linearly on every line segment. This can be fixed by changing the order of the points for contours.
Collinear Points
Outlier points that have little effect on the overall appearance and structure of a given polygon, which is a result of joining adjacent line segments [Figure 3b]. These outlier points could be removed by reducing and simplifying adjacent segments around these points.
Duplicate Points
Redundant points. These can be simply removed.
Dangling
Extended line segments or a smaller contour connected to the main polygon contour. Dangling segments or contours [Figure 3c] can be fixed by splitting the contour into parts determined by the presence of intersection, and each part is tested whether it satisfies the properties of a basic polygon; invalid ones are removed.
Multi-Polygon
Compounded polygons joined by either overlapping or tangent boundaries. Multi-polygon can be considered as a special dangling case, except that individual components form a polygon with distinct shape and area. Thus, this can be handled similarly as the dangling case.
Self-Intersect
A contour with an edge (line segment) touching or crossing another edge of the contour [Figure 3d]. This can be resolved by eliminating the exterior coordinates originating from the identified intersection point.
Sharp pointed vertex: An angle formed by two-line segments is too narrow. To fix this, the smoothness of the contour has to be refined, for example, by defining a maximal distance parameter on how a point can be away from the main contour.
Pathology Analytical Imaging Database and Query Support
Pathology analytic imaging standards (pais) data modeling
To manage algorithm results, human annotations and provenance, and to efficiently support complex queries, we employ a data model called PAIS.[19,20] The PAIS data model consists of 62 Unified Modeling Language (UML) classes, representing information on markups (spatial shapes representing regions, cellular or subcellular objects), annotations (including calculated features or observations such as classifications associated with markups), and provenance (image references, analysis, algorithm and parameters). PAIS provides highly generalized data objects and data types and supports flexible relationships across objects. Geometric shapes such as polygons are used to represent the boundaries of segmented objects, such as tumor regions, blood vessels, and nuclei.
Pathology analytic imaging standards database
PAIS employs a spatial database management system (DBMS) based implementation for managing data–we have used IBM DB2 with spatial extender[21] in our implementation.[20] There are three major types of tables involved in the PAIS database: (i) Spatial tables for markup objects with geometric shapes. Spatial DBMS provides extensions to relational DBMS to support spatial data types such as ST_POLYGON and ST_POLYLINE; (ii) Feature and observation tables to capture calculated features, such as area, perimeter, and eccentricity, and descriptive observations, such as classifications of regions or nuclei; and (iii) Provenance tables for image references, subject, specimen, the user performing the analysis, the analysis purpose, and the invoked algorithms. The database implementation provides dozens of functions to support comparison of relationships across spatial objects. Some most commonly used relationship functions include intersects, overlaps, within, contains, and touches, among others. It also provides numerous spatial measurement functions, including those to compute the area and centroid of a spatial object, to calculate the distance of two spatial objects, and to generate an intersected region (a spatial object generated from two spatial objects). Note that PAIS manages image analysis results–original images are managed in a separate database.
Representing results in a structural format and managing them in a database provide significant advantage for expressing complex queries in SQL. Furthermore, extended built-in spatial functions make it easier to support workflows involving spatial operations. For example, as presented earlier, object densities in image subregions can be used as a criterion for stratified sampling. Figure 4 illustrates database support for performing density computations and stratified sampling.
Figure 4.
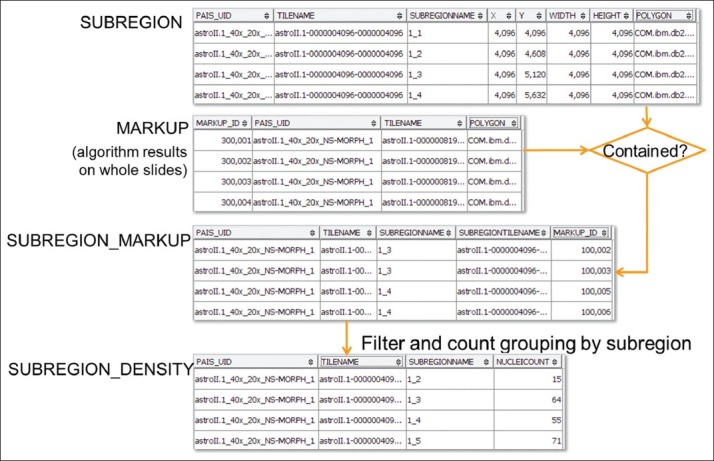
Workflow for generating density data for sampling
Database based sampling
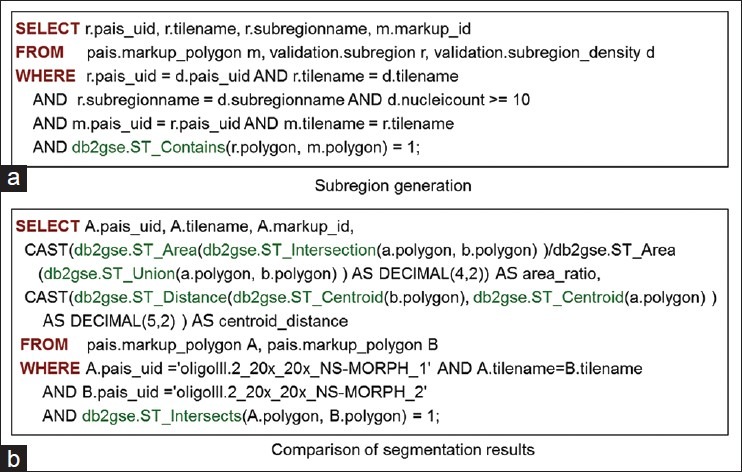
To compute the object density for subregions, we partition tiles to produce subregions. An initial segmentation of all markups is performed by a segmentation algorithm, and all segmented markups are stored in a MARKUP_POLYGON table.[22,23] Then subregion size is defined in a way such that each subregion contains a reasonable set of objects that could be annotated by a human within a single short session, for example, within 10 min by an experienced pathologist based on a pilot study. With the size information, each tile of an image space is divided into subregions and captured in SUBREGION table in the database. SUBREGION contains PAIS_UID, TILENAME, SUBREGIONNAME, (X, Y) coordinates of the top-left corner of the subregion, WIDTH, HEIGHT, and a POLYGON to represent the boundary of each subregion. After the production of markups and subregions, markup and subregion containment relationship can be decided using a spatial containment query, as shown in Figure 5a. In this query, the conditions specify that markups and regions are from the same tile and same image, and regions contain markups. Note that in the query subregions with less significant number of objects, e.g., 10 nuclei, are dropped.
Figure 5.
Example queries. (a) Query to generate subregion and markup containment relationships; (b) Query to compare segmentation results from two methods
Data loading
The performance of loading data into spatial databases depends on both computations and disk I/O operations. While the performance of traditional data loading is normally constrained by disk writing bandwidth, spatial data loading is also constrained by the central processing unit (CPU) resources available to convert raw text data into spatial data structures in the database, such as computing minimal boundary boxes and many other spatial characteristics. Our profiling shows that the CPU utilization is several times higher for loading boundary data as spatial objects than as text data in the database, and the former takes several times longer time. Since a modern computer server often comes with multi-cores, utilizing all the cores for data loading could potentially accelerate the spatial computation at loading stage and reduce the overall loading time. We propose a parallel data loading scheme that can parallelize data loading by user specified number of cores. The data loading tool provides a job scheduling module that manages raw data to be mapped into database tables. The scheduling mechanism has one master thread for managing all jobs–each job is based on one tile. Each slave thread asks the master thread for an available job, and the master thread picks up the next available job and assigns it to the slave thread. This is repeated until all jobs are assigned and processed.
Evaluating results with SQL queries
Once the data is loaded and indexed by the PAIS database, evaluating of results can be supported by expressive SQL queries. For example, as shown in Figure 5b, the SQL query compares two segmented results from an image generated by an algorithm with two different parameters. It computes the overlap-to-intersection ratios and centroid distances of all matched segmented nuclei through the ST_Intersects spatial predicate, which automatically triggers an efficient spatial index assisted query processing. Similarly, image features can also be compared by computing the difference of average, standard deviation, or histogram. More example SQL queries for PAIS can be found at PAIS wiki.[19]
Parallel Database Architecture
A major bottleneck in managing and querying large data is the I/O bottleneck. The evaluation of spatial queries in our studies has shown that many queries’ execution time is spent in I/O, such as aggregation queries. Meanwhile, spatial join queries can be highly computational intensive. Next we describe the parallel database approach to address this issue.
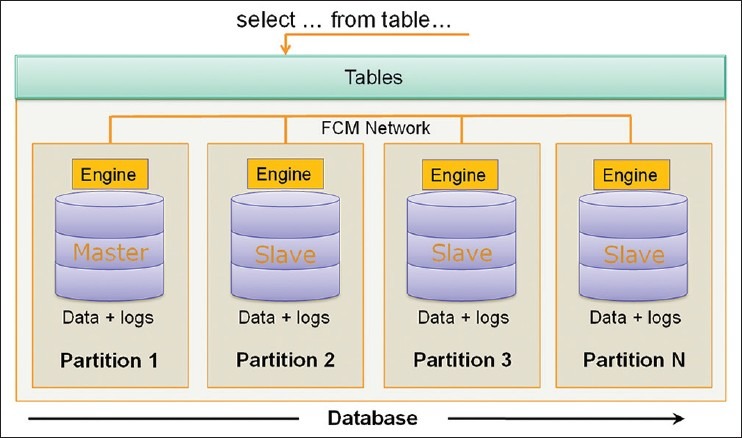
I/O bandwidth can be increased through data partitioning and parallel data access. In our work, we have used a shared-nothing parallel database architecture to manage and query PAIS data to provide scalable data management and to speed up complex queries. Figure 6 illustrates this architecture in which multiple database instances are run on separate physical nodes. We also refer to these nodes as database partitions (Partition 1, Partition 2,…, and Partition N). Each partition has its own disks, CPU and memory, and the partitions are connected through a fast switched network. There is one master partition and multiple slave partitions. The master partition accepts queries from users, translates and parallelizes queries across all partitions, and aggregates the results-this enables the simplicity and expressiveness of SQL queries as such distributed parallel query execution is transparent to users. Our implementation employs IBM DB2's parallel query execution support.[22] This support provides a single logical view of partitioned data so that clients can compose SQL queries as if they interacted with a serial database with no data partitioning.
Figure 6.
Partitioning based parallel database architecture
One major challenge for a shared-nothing architecture is load balancing, i.e., how to distribute data and computational load evenly across all partitions. A skewed data distribution can lead to bottlenecks and deteriorate overall performance. There are two granularities for partitioning data: Partitioning based on images and partitioning based on tiles. The first approach distributes all of the segmentation and feature results obtained from a whole image onto the same partition, and the second approach distributes all results from a tile onto the same partition. The second approach has the benefit of speeding up queries on a single image, as tiles could be queried simultaneously on multiple partitions.
Whether it is applied to tiles or images, partitioning algorithms should try to minimize data communication overhead across partitions for efficient spatial joins between different result sets. Given multiple algorithm results from a list of tiles, an algorithm distributes the results across multiple partitions such that (1) the amount of results on each partition is close across all the partitions and (2) results from different algorithms on the same tile are assigned to the same partition. We implement two approaches to partition the data based on tiles: (i) tilename hashing: Hashing tilename to generate partition keys using the database's built-in hashing function and ii) bin packing of objects in tiles. The later algorithm reads the list of tiles and the sizes of result sets associated with these tiles for each analysis run. It then executes a bin-packing heuristic, where each partition represents a bin, to distribute the tiles across partitions as follows. The algorithm sorts the tiles in descending order of the total result size of each tile. Starting from the top-most tile, it assigns the tile to the partition with the minimum results set size and increments the results set size of the partition by the size of the tile's results set. The algorithm proceeds down the sorted list, assigning the current tile to the partition with the minimum results set size and incrementing the partition's results set size by the tile's results set size. With partitioning key generated by the partitioning methods, during data loading process, the partition keys are used to automatically distribute the data element to the right partition when the insert is executed. Each database partition is stored on the local disk attached to the corresponding node.
In order to further reduce I/O overhead, each partition creates a spatial index on local data. There are a number of indexing and data access methods[23] to support efficient spatial queries. These methods can be categorized into two main classes: Space based and data based. Grid indexing is a common space based approach, where space is partitioned into fixed grid cells. R-Tree indexing,[24] on the other hand, is a common data based approach. In our work, grid based indexing is used, as shown in Figure 7. The red and green spatial boundaries represent segmented nuclei by different methods, and the orange grid represents the grid index. Each spatial region is divided into multi-level grids and indexed. These grids can be used to efficiently identify spatial intersections of markups in spatial joins. For example, in order to find the intersected areas of the green and red markups in grid cell (5,2) based on the minimal bounding box of the markup, the grid cell number is first generated with the green markups. Then all the markups of the other dataset (in red color) that intersect this cell are retrieved based on the grid index. These markups are further filtered by geometric computation. Thus, the total number of markups for comparison is significantly reduced via the grid based indexing.
Figure 7.
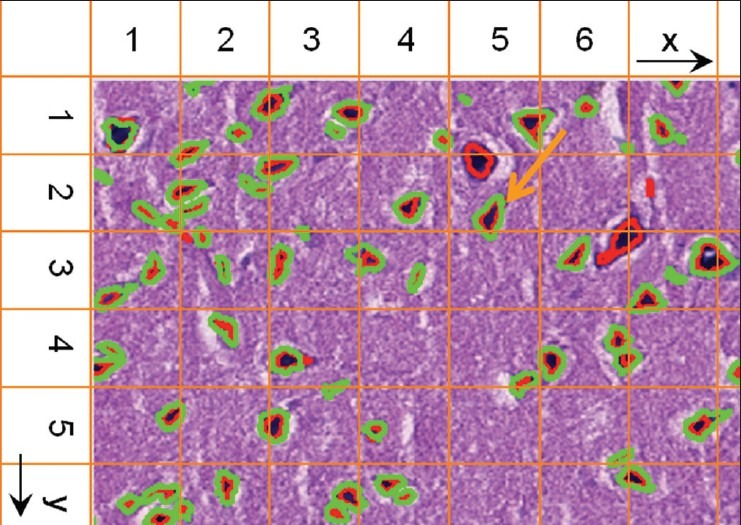
Fixed grid indexing to support spatial join queries
RESULTS AND PERFORMANCE EVALUATION
Software Tools
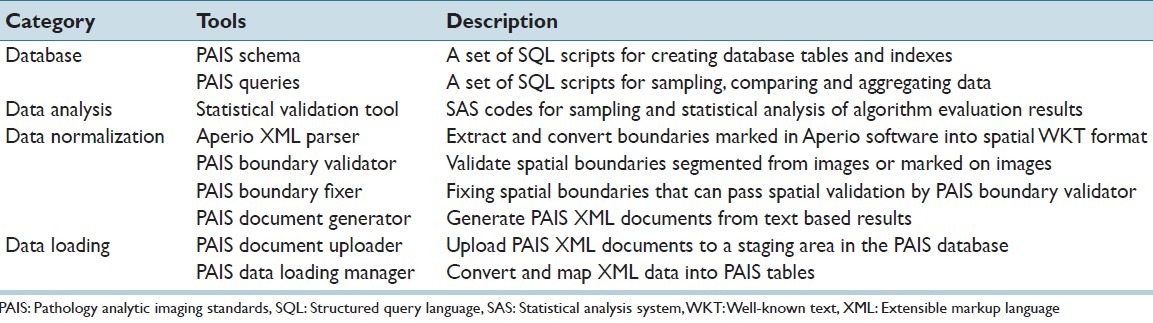
We have developed following software tools to support algorithm evaluation, summarized in Table 1. These tools include: (i) database tools for creating schemas, sampling data and comparing results; (ii) data analysis tool for statistical analysis to support sampling and result evaluation, (iii) data normalization tool for extracting and converting data, validating and fixing spatial boundaries, and converting data into PAIS documents; and (iv) data loading tool for moving data into the database and converting data into structured and spatial data in the database. The tools are available to download at PAIS Wiki.[19] The source codes are available for download at PAIS Google code site.[25]
Table 1.
Pathology analytical imaging standards tools
To setup PAIS database, IBM DB2 database server and its spatial extender is needed. DB2 also comes with a free single partition express edition DB2 Express-C. The setup of the parallel database server on multiple nodes requires sharing of the installed DB2 binaries through network sharing, and each node comes with its own running instance. Database partitions can be created for each node and grouped into a partition group to be used by a PAIS database. Once the installation is done, a database can be created and spatially enabled, and the PAIS tables can be created by the table creation SQL scripts. By following result file format specifications, the analysis results from image analysis software can be converted into PAIS documents with PAIS Document Generator. The documents can then be uploaded into the database with PAIS Document Uploader. The execution of PAIS Data Loading Manager triggers the mapping of PAIS documents in extensible markup language (XML) format into PAIS table records. After that, SQL queries and interactive statistical analysis can be executed. Details on database setup and program execution can be found at PAIS wiki.
Performance Evaluation
Experimental setup
We have performed experiments with different partitions using IBM DB2 as the underlying relational database management system. The cluster machine we use has five nodes. Each node has two quad-core CPUs and 16 GB memory (only a single core is used for each database instance) and runs 64-bit CentOS 5.6. We use IBM Infosphere Data Warehouse edition Version 9.7.3 with DB2 partitioning feature as our database engine. We have DB2 setup with five partitions on five cluster nodes. The dataset includes 18 whole-slide microscopy images analyzed by two methods. The total number of spatial objects is about 18 million and the average number of spatial objects per image is 0.5 million. Analysis results from different runs are stored in files. We use file sizes to estimate the result set sizes for the partitioning algorithm in order to avoid the expensive process of parsing the file for spatial objects twice–once for counting the objects and once for loading the objects to the database.
Spatial query performance
We report the results of two experiments in Figures 8 and 9: One experiment looks at the distribution of data across backend nodes, the other measures the reduction in execution time of spatial joins. The spatial joins in our experiments involve comparisons of overlap-to-intersection ratios and centroid distances between markups from two result sets generated for a single whole slide image. Figure 8 shows the object distribution across five nodes with both bin-packing partitioning method and tilename hashing method. As tilenames are generated based on image names and coordinates of the title location, the values of tilenames take a relatively random distribution. The mean number of objects at each node is 3.65 million, and the standard deviation for this approach is 0.236 million. The bin-packing approach estimates the number of objects based on file sizes, and the standard deviation of object distribution is 0.054 million. The results indicate that the bin-packing scheme works well and the file size provides a good approximation of the number of spatial objects. Figure 8 illustrates spatial join query speed up from a single node setup to a five-node setup for an example image with 2 million markup objects. The results show that linear speedup is achieved with our partitioning approach. The partitioning algorithm allows the DB2's parallel query support to take advantage of partitioned data for higher I/O bandwidth. In addition, indexes set up on each node reduce the local I/O overhead on each node. A further improvement of queries is through pre-computing centroids of polygons when data is loaded. Geometric computation such as computing distances and overlaps for spatial queries is of high computational complexity and could cost much time in query processing. By pre-computing centroids, computation of distances between polygons pairs could be much simplified and the queries can be much accelerated.
Figure 8.
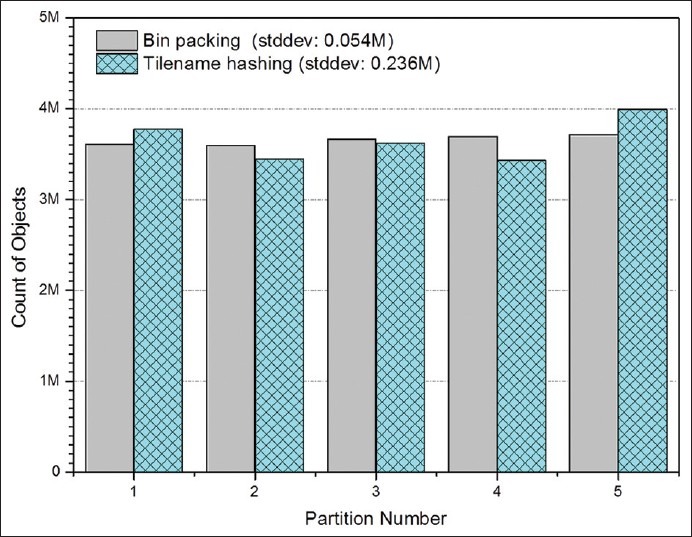
Performance of data partitioning with five computation nodes
Figure 9.
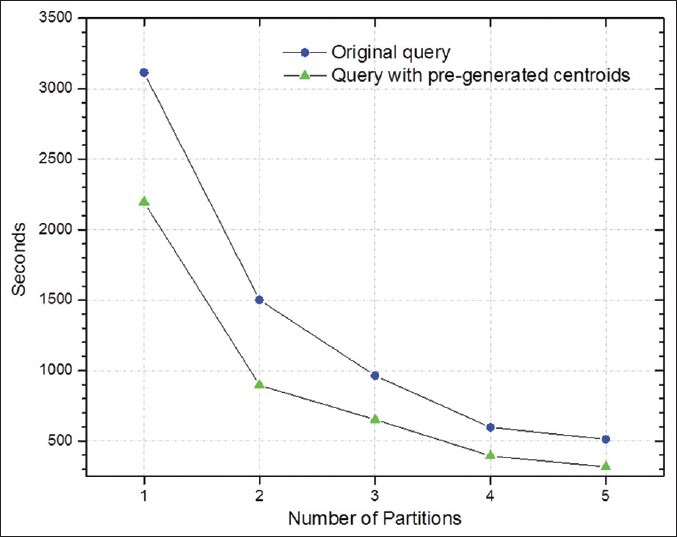
Performance of spatial join queries for comparing two analysis results for an example image
Parallel data loading performance
In Figure 10, we compare the performance of loading spatial data versus non-spatial data, with the same input raw data. With a single thread, spatial data loading takes nearly 8 times more time compared to non-spatial data loading, and CPU utilization is three times higher. Figure 11 shows the performance of parallel data loading for spatial data. By increasing the number of threads from 1 to 16, the CPU utilization is 6 times higher, and the loading time is dropped by 3.6 times. Clearly, this demonstrates that through parallel loading, better CPU utilization could accelerate spatial computation and boost the performance. When the number of threads exceeds the number of CPU cores, the performance begins to drop due to the overhead of the context switch between threads and resource saturation of the system.
Figure 10.
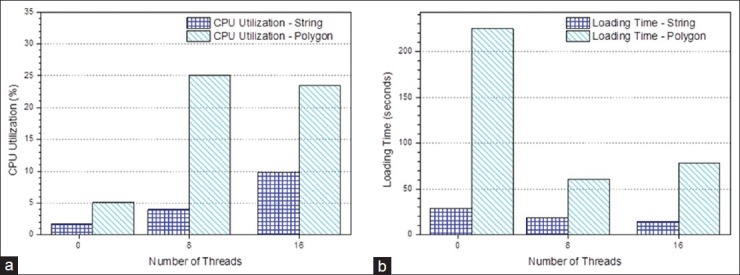
Spatial data loading versus non-spatial data loading (a) Central processing unit utilization; (b) loading time
Figure 11.
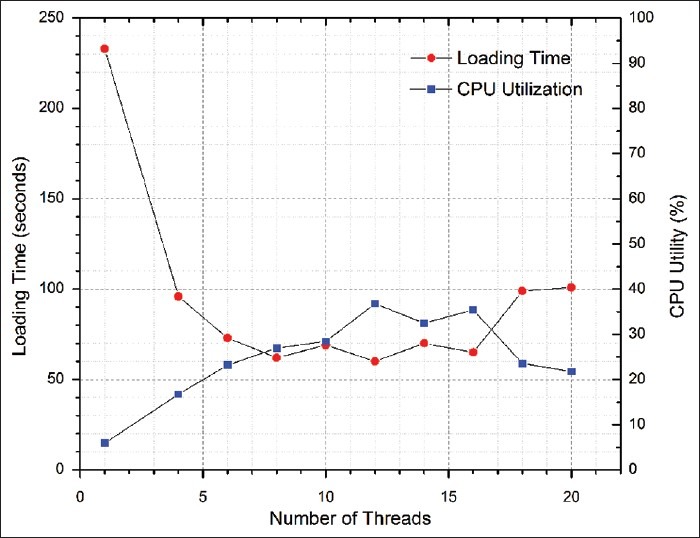
Performance of parallel data loading
EXAMPLE EVALUATION RESULTS
One of the evaluation queries is to find how algorithm parameters can affect the segmentation results. By adjusting parameters, we run the algorithm NS-MORPH[1,2] to segment two sets of nuclear boundaries, and compare the average overlap ratio of intersecting nuclear boundaries between the two result sets. We use a dataset of 18 whole-slide microscopy images. The parameters include Tissue Area Percentage (TAP) to judge if there is sufficient tissue area in the current tile for analysis, Red Blood Cell Minimum Strength (RBCM) of any qualified red blood cell for further analysis, Non-Red Blood Cell Maximum Strength (NRBCMS) of any non-red blood cell to be excluded for RBC recognition, Foreground Minimum Strength (FMS) of any qualified foreground object for further analysis, and Background Maximum Strength (BMS) of any background regions to be excluded for further analysis. The first set of parameters are TAP = 0.9, RBCM = 5, NRBCMS = 4, FMS = 80, and BMS = 45, and the second sets are TAP = 0.9, RBCM = 5, NRBCMS = 4, FMS = 80, and BMS = 3, with the last parameter changed to a smaller value. The query returns the average overlap ratio as 75.6% with standard deviation of 0.227, and average distance as 1.75 with standard deviation of 3.30. The query returns 224, 623 polygons out of total 18,274,876 polygons. We can see that as the excluded background strength threshold is lowered, the second method segments more objects and likely larger nuclei, which leads to lower intersection ratio and increasing distances between polygon pairs. As another example query, for the two results on all images, we query how many nuclear boundaries from result set 1 intersect two or more nuclear boundaries in result set 2. This query is also affected by lowering BMS, which could produce more polygons and even larger polygons. The difference of the results can be quantitatively computed based on PAIS database, which can be used to support iterative development and refinement of image analysis algorithms. Other statistics on the continuity of algorithms or parameter comparisons to ensure an optimal situation could include agreement indices such as intra correlation coefficient (ICC), concordance correlation coefficient (CCC) and kappa statistics, which could be implemented as user defined aggregate functions or stored procedures to run efficiently inside the database.
DISCUSSION
The proposed PAIS pipeline minimizes the introduction of individual bias as the outcomes are based on inputs from multiple pathologists taking into consideration of inter-rater variation among them. That is, PAIS is optimal and suitable for all-level pathologists in terms of mitigating the issue that the results may heavily depend on the accuracy and preference of one rater if not controlling for inter-rater variability. Meanwhile, through a comprehensive PAIS based framework for managing and evaluating algorithm results or human annotations, we can create a curated set of results from algorithms and human annotations, together with original images, to serve as a repository of nominal ground truth. Thus new algorithm results can be formatted and loaded into the database for quick evaluation.
One major hurdle for quantitatively evaluating algorithm results is irregular shapes generated from segmentation algorithms and erroneous human markups. Our studies show that a large portion of the data boundaries are invalid polygons. For example, the boundaries of blood vessels are highly complex polygons. Manual segmentation of these structures results in a high rate of invalid shapes. We have developed a tool to handle these complex cases and correct these errors by using a pipeline of components borrowed from existing libraries, including Boost[26] and Clipper[27] as well as implemented from our custom codes. The boundary fixing tool is robust and fixes all boundaries we generated in our use cases, including algorithm segmented boundaries and human marked boundaries.
The parallel database architecture can be scaled to multiple nodes to accelerate queries, through careful tuning of the database, including even data distribution, co-location of data, and replication of commonly accessed small tables across all nodes. Such optimization also depends on the query types to be supported, and careful examination of query plans is important.
The database approach provides high expressiveness on composing queries, with declarative SQL query language, without any need of programming. This makes it natural and quick for users to write queries to evaluate algorithms.
Our profiling of queries shows that geometric computations, for example, ST_Intersects, dominate query time to support algorithm evaluation queries. We recently developed a graphical processing unit (GPU) based algorithm that accelerates intersection queries through high data parallelism and computation parallelism running on a large number of GPU cores.[28] This approach achieves high efficiency using cost-effective hybrid CPU-GPU architecture. We are exploring generalizing the GPU approach for different types of spatial operations, and having them integrated into databases.
CONCLUSIONS
Pathology image algorithm validation and comparison are essential to iterative algorithm development and refinement. A critical component for this is to support efficient spatial queries. In our work, we develop an efficient data model and parallel database approach to model, normalize, manage and query large volumes of analytical image result data. Our experiments demonstrate that the data partitioning strategy and grid-based indexing result in good data distribution across database nodes and reduce I/O overhead in spatial join queries through parallel retrieval of relevant data and quick subsetting of datasets. The parallel data loading tool can take advantage of multi-cores of a CPU to significantly accelerate data loading of normalized spatial data. The set of tools in the framework provide a full pipeline to normalize, load, manage and query analytical results to support algorithm evaluation.
Footnotes
Available FREE in open access from: http://www.jpathinformatics.org/text.asp?2013/4/1/5/108543
REFERENCES
- 1.Cooper LA, Kong J, Gutman DA, Wang F, Cholleti SR, Pan TC, et al. An integrative approach for in silico glioma research. IEEE Trans Biomed Eng. 2010;57:2617–21. doi: 10.1109/TBME.2010.2060338. [DOI] [PMC free article] [PubMed] [Google Scholar]
- 2.Kong J, Cooper L, Wang F, Chisolm C, Moreno C, Kurc T, et al. In: Proc IEEE Int Symp Biomed Imaging. 2011. A comprehensive framework for classification of nuclei in digital microscopy imaging: An Application to diffuse gliomas; pp. 2128–31. [DOI] [PMC free article] [PubMed] [Google Scholar]
- 3.Kong J, Cooper LA, Wang F, Gutman DA, Gao J, Chisolm C, et al. Integrative, multimodal analysis of glioblastoma using TCGA molecular data, pathology images, and clinical outcomes. IEEE Trans Biomed Eng. 2011;58:3469–74. doi: 10.1109/TBME.2011.2169256. [DOI] [PMC free article] [PubMed] [Google Scholar]
- 4.Cooper LA, Kong J, Gutman DA, Wang F, Gao J, Appin C, et al. Integrated morphologic analysis for the identification and characterization of disease subtypes. J Am Med Inform Assoc. 2012;19:317–23. doi: 10.1136/amiajnl-2011-000700. [DOI] [PMC free article] [PubMed] [Google Scholar]
- 5.Cooper LA, Kong J, Wang F, Kurc T, Moreno CS, Brat DJ, et al. Morphological signatures and genomic correlates in glioblastoma. Proc IEEE Int Symp Biomed Imaging. 2011:1624–7. doi: 10.1109/ISBI.2011.5872714. [DOI] [PMC free article] [PubMed] [Google Scholar]
- 6.Kong J, Cooper L, Moreno C, Wang F, Kurc T, Saltz J, et al. In silico analysis of nuclei in glioblastoma using large-scale microscopy images improves prediction of treatment response. Conf Proc IEEE Eng Med Biol Soc. 2011;2011:87–90. doi: 10.1109/IEMBS.2011.6089903. [DOI] [PMC free article] [PubMed] [Google Scholar]
- 7.In Silico Center for Translational Neuro-oncology Informatics. 2012. [Last accessed on 2012 Dec 4]. Available from: http://web.cci.emory.edu/confluence/display/INSILICO/
- 8.Clunie D. Algorithm Validation Toolkit (AVT), Presentation at the 2008 Radiological Society of North America Annual Meeting. [Last accessed on 2012 Dec 4]. Available from: http://www.dclunie.com/papers/AVT-RSNA-2008-RC730-DAC2.pdf .
- 9.Channin DS, Mongkolwat P, Kleper V, Sepukar K, Rubin DL. The caBIG annotation and image Markup project. J Digit Imaging. 2010;23:217–25. doi: 10.1007/s10278-009-9193-9. [DOI] [PMC free article] [PubMed] [Google Scholar]
- 10.Goldberg IG, Allan C, Burel JM, Creager D, Falconi A, Hochheiser H, et al. The Open Microscopy Environment (OME) Data Model and XML file: Open tools for informatics and quantitative analysis in biological imaging. Genome Biol. 2005;6:R47. doi: 10.1186/gb-2005-6-5-r47. [DOI] [PMC free article] [PubMed] [Google Scholar]
- 11.Clunie DA. DICOM structured reporting and cancer clinical trials results. Cancer Inform. 2007;4:33–56. doi: 10.4137/cin.s37032. [DOI] [PMC free article] [PubMed] [Google Scholar]
- 12.Kvilekval K, Fedorov D, Obara B, Singh A, Manjunath BS. Bisque: A platform for bioimage analysis and management. Bioinformatics. 2010;26:544–52. doi: 10.1093/bioinformatics/btp699. [DOI] [PubMed] [Google Scholar]
- 13.Martone ME, Zhang S, Gupta A, Qian X, He H, Price DL, et al. The cell-centered database: A database for multiscale structural and protein localization data from light and electron microscopy. Neuroinformatics. 2003;1:379–95. doi: 10.1385/NI:1:4:379. [DOI] [PubMed] [Google Scholar]
- 14.Yang L, Tuzel O, Chen W, Meer P, Salaru G, Goodell LA, et al. PathMiner: A Web-based tool for computer-assisted diagnostics in pathology. IEEE Trans Inf Technol Biomed. 2009;13:291–9. doi: 10.1109/TITB.2008.2008801. [DOI] [PMC free article] [PubMed] [Google Scholar]
- 15.Yang L, Chen W, Meer P, Salaru G, Feldman MD, Foran D. High-throughput analysis of breast cancer specimens on the grid. Med Image Comput Comput Assist Interv. 2007;10:617–25. doi: 10.1007/978-3-540-75757-3_75. [DOI] [PMC free article] [PubMed] [Google Scholar]
- 16.Open GIS Implementation specification for geographic information-simple feature access. 2012. [Last accessed on 2012 Dec 4]. Available from: http://www.opengeospatial.org/standards/sfs .
- 17.Open CV. 2012. [Last accessed on 2012 Dec 4]. Available from: http://www.opencv.org/
- 18.Aperio Image Scope. 2012. [Last accessed on 2012 Dec 4]. Available from: http://www.aperio.com .
- 19.Pathology Analytical Imaging Informatics Standards Wiki. 2012. [Last accessed on 2012 Dec 4]. Available from: https://web.cci.emory.edu/confluence/display/PAIS .
- 20.Wang F, Kong J, Cooper L, Pan T, Kurc T, Chen W, et al. A data model and database for high-resolution pathology analytical image informatics. J Pathol Inform. 2011;2:32. doi: 10.4103/2153-3539.83192. [DOI] [PMC free article] [PubMed] [Google Scholar]
- 21.DB2 Spatial. 2012. [Last accessed on 2012 Dec 4]. Available from: http://www.ibm.com/software/data/spatial/db2spatial/
- 22.Baru C, Fecteau G. ACM SIGMOD. New York: ACM; 1995. An overview of DB2 parallel edition; pp. 460–2. [Google Scholar]
- 23.Gaede V, Gunther O. Multidimensional access methods. ACM Comput Surv. 1998;30:170–231. [Google Scholar]
- 24.Guttman A. SIGMOD Conference. New York: ACM; 1984. R-trees: A dynamic index structure for spatial searching; pp. 47–57. [Google Scholar]
- 25.PAIS Google code, 2012. [Last accessed 2012 Dec 4]. Available from: http://code.google.com/p/openpais/
- 26.Boost C++ libraries. 2012. [Last accessed on 2012 Dec 4]. Available from: http://www.boost.org/
- 27.Clipper–An open source freeware polygon clipping library, 2012. [Last accessed on 2012 Dec 4]. Available from: http://www.angusj.com/delphi/clipper.php .
- 28.Wang K, Huai Y, Lee R, Wang F, Zhang X, Saltz J. VLDB Conference. Vol. 5. Istanbul, Turkey: VLDB Endowment; 2012. Accelerating pathology image data cross-comparison on CPU-GPU hybrid systems; pp. 1543–54. [DOI] [PMC free article] [PubMed] [Google Scholar]