Abstract
Background:
Microdialysis is a specific and local sampling method to collect free molecules from the extracellular fluid, however, there are no reports on time delay issues of microdialysis applications.
Aims:
This study was to check the time gap between the start of target molecule changes in detected fluid and corresponding stable concentration formation in the sampled dialysate.
Materials and Methods:
A designated microdialysis system for free calcium ion was set up in vitro and perfused with saline. The dialysate was diluted synchronously, and collected in a vial every 10 min. The free calcium concentration [Ca++] of the sample was measured by an atomic absorption spectrophotometer. A signal-switching method was introduced to mimic the target molecule [Ca++] changes in the detected fluid, standard calcium solution and saline.
Results:
There was a notable lag in dialysates [Ca++] for both uprising and down going course in spite of instant switching between the detected fluids. The recovery time (RT) of the microdialysis system was extrapolated to be 20 min for [Ca++] detection.
Conclusions:
With 10 min sampling interval, [Ca++] time delay of the microdialysis system existed, and could not be estimated precisely beforehand. The signal-switching method was applicable for RT calibration in vitro with a dedicated microdialysis system.
Keywords: Calcium, Microdialysis, Time delay
Introduction
Extracellular space is an important space for cell and blood substance exchange, where conventional techniques can hardly take effect. Microdialysis (MD) is a specific, local sampling method to collect free (unbound) molecules of interest from the extracellular fluid. MD is a unique technique to monitor the chemistry of the extracellular space in living tissue. It was first applied 50 years ago to study tissue biochemistry in the brain of rodent.[1] In recent years, MD has been used widely in both animals and human subjects to investigate the changes experienced by extracellular molecules or medicine under certain physical or pathological condition.
The MD involves inserting a dialysis probe into a particular tissue, perfusing it with a physiological solution (perfusate), and the resulting perfusate (dialysate) closely resembles the composition of the extracellular fluid.[1,2] The MD probe membrane material is characterized by a porous structure allowing the exchange of smaller molecules across the membrane. The exchange of molecules across the membrane occurs by passive diffusion and is driven by the concentration gradient. Since the MD probe is continuously perfused with fresh perfusate, a total equilibrium across the membrane cannot be established.[3]
As exact assessing the recovery through MD membrane is critically important in pharmaceutical studies about the effects of different drugs,[3,4] the way to calculate the exact amount of the drug crossing the MD membrane acting on extracellular tissue is more important. To date, the recovery rate (RR) is a well-known standard method which calculates the ratio between the concentration in the dialysate and the concentration in the peri-probe fluid. However, the target molecules reaching diffusion equilibrium and the dialysate traveling through the MD probe should cause a certain delay, theoretically. So we hypothesized that the changes in dialysate constituents will cause a delay in the probe surrounding fluid. As far as we are aware, there are no reports on time delay issues for MD applications.
In order to confirm our hypothesis, we defined the concept of recovery time (RT), which is the time gap between the start of target molecule changes in detected fluid and corresponding stable concentration formation in the sampled dialysate. We then set up a MD system for free calcium ion [Ca++] detection and introduced a signal-switching method to check the influence of time delay on results.
Materials and Methods
Microdialysis system components
The MD system consists of a probe (CMA20 Elite, 8010435, CMA MD AB, Sweden). 20 K Daltons cut-off, concentric design, Membrane length 4 mm, Inlet tube length 200 mm, internal volume 3.6 μL, Outlet tube length 200 mm, internal volume 3.6 μL), a pump (CMA 402 Syringe Pump with accessory kit, 800310, CMA MD AB, Sweden) and the extending tubes with accessories (FEP Tubing, 3409501 and Tubing Adaptors, 3409500, CMA MD AB, Sweden). Two FEP tubing (internal volume is 1.2 μL/10 cm length) were cut into 40 cm and connected with inlet and outlet tube respectively. The MD probe, extending tubes and accessories kept connected and not replaced during the whole experiment. The dead volume in this system could be calculated as:
(Outlet tubing internal volume) + (Outlet FEP tubing internal volume) =3.6 μL + 4 × 1.2 μL = 8.4 μL
Microdialysis and sampling protocol
The MD probe membranous part was immersed in the saline for 20 min before sampling started. The MD probe inlet tube was perfused with normal saline (NS) at a rate of 2.0 μL/min. A dilution tube was connected with a peristaltic pump to flush the tip of outlet tube with NS at a rate of 0.1 mL/min synchronously. The diluted dialysate was collected in a vial every 10 min, which was stored at – 20°C for further analysis.
Target molecule and signal switch
We choose free Ca++ as target molecule and the detected fluids were standard calcium solution ([Ca++] was set to 1.25 mmol/L) and NS ([Ca++] was about 1-3 μmol/L).
Signal switch procedures included: (1) Put the MD probe into NS for 20 min stabilization, switch the probe to standard calcium solution, and then start the experiment counting and continuous sampling with 10 min interval; (2) 40 min later, switch back the probe to NS, continue sampling for 40 min; (3) diluent (NS) was collected and stored along with dialysate samples at the end each time; and (4) repeat (1) and (2) steps four times.
[Ca++] detection and calculation
All diluted dialysates and diluent samples were analyzed for [Ca++] by atomic absorption spectrophotometer (AAS) (Z5000 Polarized Zeeman AAS, HITACHI, Japan) at 422.7 nm wavelength. Dialysate [Ca++] was calculated as:
[Ca++]e = ([Ca++]d – [Ca++]NS) ×50
[Ca++]e: Dialysate [Ca++], [Ca++]d: Diluted dialysate [Ca++], [Ca++]NS: Diluent [Ca++]
Statistical analysis
All results are expressed as the mean ± standard error (SEM) and were analyzed by a computerized statistical program (SAS (r) 9.1 [TS1M3 DBCS3054], 2002-2003 by SAS Institute Inc., Cary, NC, USA. Licensed to Zhong Shan University, Site 0057294001). A Student's t-test was used for the continuous data (2-tailed) and X2 test was used for categorical data when comparing variables between two groups. If the interactions between time and treatment were of statistical significance, the data were treated as independent samples to allow for further comparisons between different treatment groups at each time point. Among the different time points in each treatment group, the data were treated as related samples; otherwise, further comparisons between different treatment groups at each time point or among different time points in each treatment group were examined by multiple comparisons in analysis of variance for repeated measurements. Differences with a probability (P) of less than 0.05 were considered to be statistically significant.
Results
Under the 10 min sampling interval, [Ca++] was near zero at the beginning, when MD probe was immersed in the saline. Yet the instant switching detected fluid from saline to standard calcium solution, [Ca++] escalated gradually and reached the peak plateau at 20 min, then kept steady until next probe switch. Similarly, [Ca++] went down to the baseline at 60 min, also 20 min later than the detected fluid switching back. There was a notable lag in dialysates [Ca++] for both uprising and down going course. We can extrapolate the RT of this MD set, with 10 min sampling interval, should be 20 min for [Ca++] detection [Figures 1–5].
Figure 1.
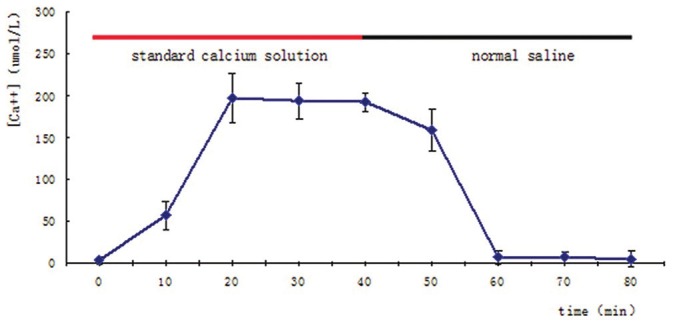
Dialysate [Ca++] changing with different detected fluids. Red or black bar indicated the microdialysis probe merged in different fluids, standard calcium solution or normal saline. The steady level of dialysate [Ca++] was plotted 20 min after detected fluids switching in both phases. Values are means ± SD of each four detections
Figure 5.
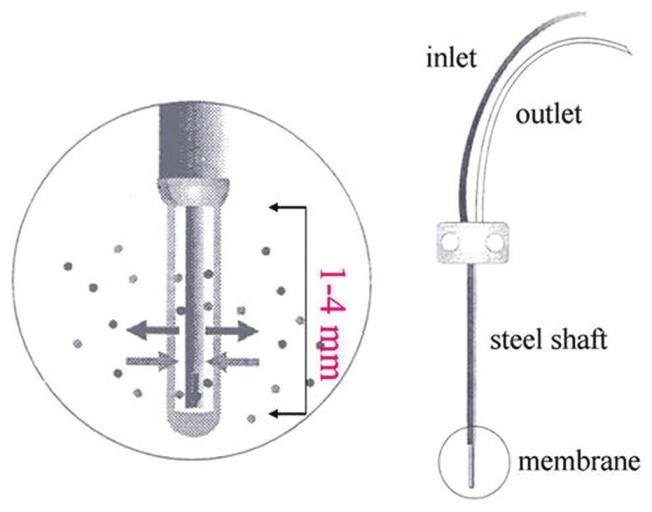
Structure of the Microdialysis probe. (permitted by Jen-Bin Lee)
Figure 2.
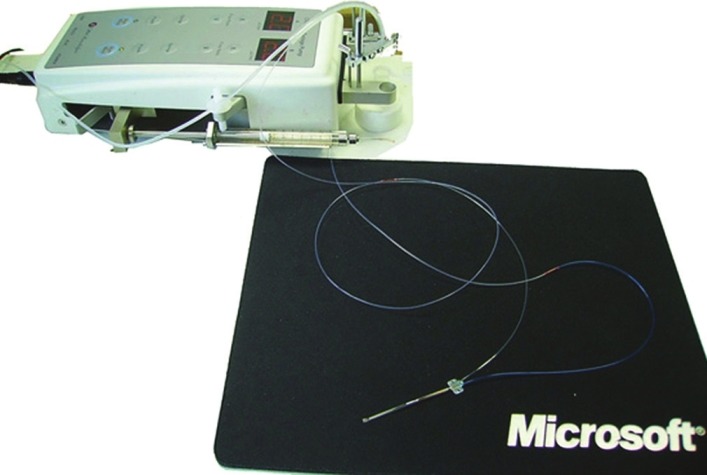
Microdialysis system components and connection
Figure 3.
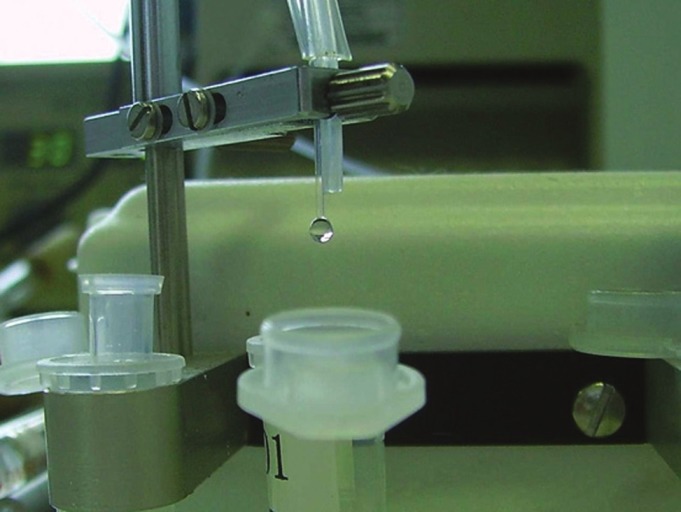
End of the outlet extending FEP tube and synchronously diluting tube
Figure 4.
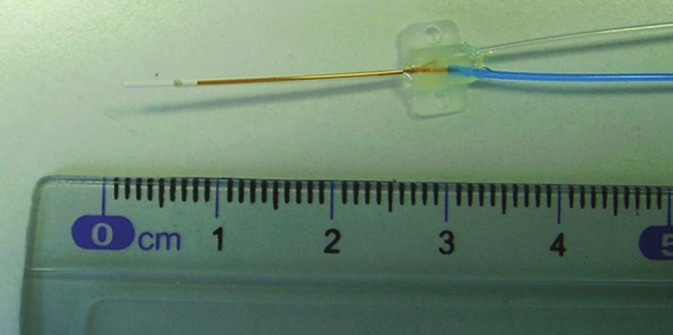
Head (membrane part) of the Microdialysis probe. Blue is the inlet tube. Transparent is the outlet tube
From [Ca++] at peak plateau time point, near 200 μmol/L, corresponding RR of the system was 16%. [Ca++] at each time points were: 3 ± 4 (0 min), 57 ± 17 (10 min), 197 ± 29 (20 min), 194 ± 21 (30 min), 192 ± 11 (40 min), 159 ± 26 (50 min), 7 ± 8 (60 min), 7 ± 7 (70 min), 5 ± 9 (80 min). There was a significant difference (P < 0.01) between baseline grou P values (0 min, 60 min, 70 min, 80 min) and plateau grou P values (20 min, 30 min, 40 min), while no significant difference within each groups was found.
Discussion
The process of target molecule sampling from detected fluid to dialysate can be considered analogous to signal transferring, which has two important parameters: Speed and intensity. Signal intensity decays during transferring, while RR reflects the signal decay, only part of target molecules entering dialysate. Speed is another important factor that influences the manifestation of signal transferring. A classic example is lightning and thundering. Most documents referring to MD would underline the RR of specific system, yet few of them mentioned the time delay issue.[5–8] The process of target molecules from detected fluid entering the dialysate collector involves two steps:[1] Transmembrane infiltration and[2] movement in the outlet, and extending tubes, if exists. So, factors influencing the two processes will alter RT.
Dead volume is the internal volumn parts from dialysis membrane of the probe to the terminal collector, including outlet tube, extending pipelines and other accessories, which may differ greatly from each MD system. Dead volumn accounts for a part of delay, which could be estimated as dead volume/perfusion rate.[2,6] In this MD system, that was 4.2 (8.4/2) min, far less than the RT. Internal volumn of the connector, between the outlet and extending tube, was unknown and alterable. Omitting this part will underestimate the dead volumn and the accounting time delay in our experiment.
Factors interfering the RR in vitro, such as target molecule nature (size, electricity, stereochemical structure), semi-permeable membrane characters (material, pore diameter), temperature, concentration gradient will impact transmembrane diffusion.[1,9] It is a rational extrapolation that these factors could also influence the RT. Holmgaard deemed that a steady state rate of exchange across the MD membrane is rapidly reached.[2] Our result seems not support the opinion, because dead volumn only account for a small portion (21%) of RT. However, these diffusion factors work with RT in complicated patterns, making it hard to estimate precisely in a mathematical model.
Although the diffusion at the MD probe membrane and the collection of fluids is continuous. The small amount of dialysate at low perfusion rate (less than 2/min) pose an analytical problem.[9,10] One of the solutions is employing a intermittent sampling and offline analyzing system. However, long sampling interval may mask the target molecules variation trend and alter the RT. In our experiment [Ca++] of each time point evened the changes within 10 min and the “real” time delay of the MD system might be less than 20 min. Shortening the sampling interval or using an online analyzing method will minimize the influence. Yet, we take the RT parameter for a designated MD system with defined sampling interval. When the sampling interval is much longer than RT, the latter influence on result analyzing could be omitted.
Although MD as a preclinical and clinical tool has been available for two decades and a large body of evidence demonstrates its versatility and usefulness, there is still uncertainty about the use of MD both from a methodological and a regulatory point of view.[1] Our experiment showed that with 10 min sampling interval [Ca++] time delay of the MD system existed and could not be estimated precisely before hand. The signal-switching method we introduced was applicable for RT calibration in vitro, which should be performed under a dedicated MD system before use.
Acknowledgments
The study was finacially supported by the Guangdong Natural Science Foundation No. 10451008901005515.
Footnotes
Source of Support: The study was finacially supported by the Guangdong Natural Science Foundation No. 10451008901005515.
Conflict of Interest: None declared.
References
- 1.Chaurasia CS, Müller M, Bashaw ED, Benfeldt E, Bolinder J, Bullock R, et al. AAPS-FDA Workshop White Paper: Microdialysis principles, application, and regulatory perspectives. J Clin Pharmacol. 2007;47:589–603. doi: 10.1177/0091270006299091. [DOI] [PubMed] [Google Scholar]
- 2.Holmgaard R, Nielsen JB, Benfeldt E. Microdialysis sampling for investigations of bioavailability and bioequivalence of topically administered drugs: Current state and future perspectives. Skin Pharmacol Physiol. 2010;23:225–43. doi: 10.1159/000314698. [DOI] [PubMed] [Google Scholar]
- 3.Sasongko L, Williams KM, Ramzan I, McLachlan AJ. Assessment of in vitro and in vivo recovery of gallamine using microdialysis. J Pharmacol Toxicol Methods. 2000;44:519–25. doi: 10.1016/s1056-8719(00)00117-9. [DOI] [PubMed] [Google Scholar]
- 4.Elmquist WF, Sawchuk RJ. Application of microdialysis in pharmacokinetic studies. Pharm Res. 1997;14:267–88. doi: 10.1023/a:1012081501464. [DOI] [PubMed] [Google Scholar]
- 5.Inserte J, Barba I, Hernando V, Abellán A, Ruiz-Meana M, Rodríguez-Sinovas A, et al. Effect of acidic reperfusion on prolongation of intracellular acidosis and myocardial salvage. Cardiovasc Res. 2008;77:782–90. doi: 10.1093/cvr/cvm082. [DOI] [PubMed] [Google Scholar]
- 6.Keenan DB, Mastrototaro JJ, Voskanyan G, Steil GM. Delays in minimally invasive continuous glucose monitoring devices: A review of current technology. J Diabetes Sci Technol. 2009;3:1207–14. doi: 10.1177/193229680900300528. [DOI] [PMC free article] [PubMed] [Google Scholar]
- 7.Lee MS, Wu YS, Yang DY, Lee JB, Cheng FC. Significantly decreased extracellular magnesium in brains of gerbils subjected to cerebral ischemia. Clin Chim Acta. 2002;318:121–5. doi: 10.1016/s0009-8981(01)00807-5. [DOI] [PubMed] [Google Scholar]
- 8.Lin MC, Huang YL, Liu HW, Yang DY, Lee CP, Yang LL, et al. On-line microdialysis-graphite furnace atomic absorption spectrometry in the determination of brain magnesium levels in gerbils subjected to cerebral ischemia/reperfusion. J Am Coll Nutr. 2004;23:561S–5. doi: 10.1080/07315724.2004.10719404. [DOI] [PubMed] [Google Scholar]
- 9.Guihen E, O’Connor WT. Capillary and microchip electrophoresis in microdialysis: Recent applications. Electrophoresis. 2010;31:55–64. doi: 10.1002/elps.200900467. [DOI] [PubMed] [Google Scholar]
- 10.Korf J, Huinink KD, Posthuma-Trumpie GA. Ultraslow microdialysis and microfiltration for in-line, on-line and off-line monitoring. Trends Biotechnol. 2010;28:150–8. doi: 10.1016/j.tibtech.2009.12.005. [DOI] [PubMed] [Google Scholar]


