

Abstract
Light is potent in circadian, neuroendocrine, and neurobehavioral regulation, thereby having profound influence on the health and wellbeing of all mammals, including laboratory animals. We hypothesized that the spectral quality of light transmitted through colored compared with clear standard rodent cages alters circadian production of melatonin and temporal coordination of normal metabolic and physiologic activities. Female nude rats (Hsd:RH-Foxn1rnu; n = 6 per group) were maintained on a 12:12-h light:dark regimen (300 lx; lights on, 0600) in standard translucent clear, amber, or blue rodent cages; intensity and duration of lighting were identical for all groups. Rats were assessed for arterial blood levels of pO2 and pCO2, melatonin, total fatty acid, glucose, lactic acid, insulin, leptin, and corticosterone concentrations at 6 circadian time points. Normal circadian rhythms of arterial blood pO2 and pCO2 were different in rats housed in cages that were blue compared with amber or clear. Plasma melatonin levels (mean ± 1 SD) were low (1.0 ± 0.2 pg/mL) during the light phase in all groups but higher at nighttime in rats in blue cages (928.2 ± 39.5 pg/mL) compared with amber (256.8 ± 6.6 pg/mL) and clear (154.8 ± 9.3 pg/mL) cages. Plasma daily rhythms of total fatty acid, glucose, lactic acid, leptin, insulin, and corticosterone were disrupted in rats housed in blue or amber compared with clear cages. Temporal coordination of circadian rhythms of physiology and metabolism can be altered markedly by changes in the spectral quality of light transmitted through colored standard rodent cages.
Abbreviation: SCN, suprachiasmatic nuclei; TFA, total fatty acids
Light is one of the most potent biologic forces fundamental to life on our planet. In the past decade, it has been shown that light is responsible for entraining or synchronizing normal circadian rhythms of physiology and metabolism in laboratory rodents, nonhuman primates, and humans primarily by means of intrinsically photoreceptive ganglion cells supplemented with input from rod and cone visual photoreceptors.1-3,5,6,10-15,29-31, 35-38,40-45,48,58,60-67,72,80-85,95 Changes in intensity, duration, and wavelength of environmental light at a given time of day can disrupt many chronobiologic rhythms.10,13-15,40,81,82 During the course of our previous investigations,7,19-22 we demonstrated that adherence to appropriate lighting and lighting protocols, as outlined in The Guide,46 is crucial to the health and wellbeing of laboratory animals and the outcomes of scientific investigations. We determined that a minimal light leak of as little as 0.2 lx (0.08 μW/cm2) intensity in animal rooms during an otherwise normal dark phase (12 h) was sufficient to disrupt circadian rhythms of plasma measures of endocrine physiology and metabolism in rats.19-21 These included disruptions in circadian patterns of plasma melatonin, total fatty acid, glucose, lactic acid, corticosterone, pO2, and CO2 levels. We further demonstrated, by using a unique tissue-isolated human tumor model86 and tumor perfusion technique,22 that light exposure at night suppresses the normal nighttime melatonin signal, thereby disrupting the circadian rhythm of the epidermal growth factor and insulin growth factor signaling pathways and leading to altered host metabolism and accelerated human cancer growth.7,8 These investigations furnished the first laboratory- derived experimental evidence showing in humans that nocturnal light exposure, as occurs in the night-shift worker population, significantly increases the risk of breast cancer.24,39,90
Light detected by the retinal rod and cone photoreceptors of the eyes activates the neural pathway of the primary optic tract, leading to our sense of vision (that is, awareness of colors, brightness, shapes, and motion).11,37,60 Some of the most profound effects of light, however, function below the level of consciousness by means of the alternate neural pathway of the retinohypothalamic tract.1,6,11,12,31,37,40,41,71 Subtle changes in light intensity, spectral transmittance, or wavelength (perceived as tint or color) and duration at a particular time of day can evoke marked chronobiologic rhythm alterations in all mammals.11,37,42,85 Common to all living organisms in their ability to respond to light is that all photobiologic responses, including circadian rhythms associated with metabolism and physiology, are mediated by organic molecules (that is, chromophores), which absorb light quanta and then undergo physical–chemical changes in the process called ‘phototransduction.’11,33 These photoactive molecules do not absorb energy equally across the electromagnetic spectrum but have their own unique patterns of wavelength sensitivity (that is, wavelength absorbance spectrum), which are dependent on the unique molecular structures within each photopigment complex. In the field of photobiology, one of the principal tools for identifying the photopigment initiating these light-induced responses is the action spectrum, which is the relative response of an organism to different wavelengths of visible and nonvisible light.11,33 In humans and rodents, light quanta are detected by the short-wavelength–sensitive photopigment melanopsin that is contained within a small group of intrinsically photosensitive retinal ganglion cells of the eye.6,40,41,57,76 This information then is transmitted via the retinohypothalamic tract to a central ‘molecular clock’ residing in the suprachiasmatic nuclei (SCN) of the hypothalamus.65,84 The SCN, whose activity is entrained by the light:dark cycle,84 signals the pineal gland via a polysnynaptic pathway, which in turn drives a series of molecular events leading to the production of the pineal neurohormone melatonin (N-acetyl-5-methoxytryptamine) primarily at nighttime.81 The daily rhythmic melatonin signal contributes to the temporal coordination of many normal behavioral and physiologic functions including the sleep–wake cycle,2,3,16,71 feeding behaviors,2,66,70,98 hormone levels,25,27,35,93 retinal physiology,5,6 reproductive cycles,80,96 immune function,17,54,59 temperature regulation,2,16,60,95 electrolyte balance,77 protein synthesis,92 redox states,77 and intermediary metabolism.50,99 The most powerful wavelengths for circadian regulation of these responses in all mammals reside in the general spectral region between 450 and 550 nm.13,14,74 However, longer wavelength light (above 550 nm) of sufficiently high intensity and duration can acutely suppress melatonin and further phase-shift or entrain circadian rhythms.11,32,38,56,74,94
Prior research has illustrated that the spectral, irradiance, and illuminance characteristics of light can influence circadian, neuroendocrine, and neurobehavioral responses in different species of rodents housed in polycarbonate cages.10-12,14,15,19-22,37,66 These studies provided the basis for earlier recommendations for housing of animals in typical animal quarters (for example, those included in the 7th edition of The Guide47) as well as experimental animal facilities for spaceflight.18,68 Clearly, over the past 25 y, there have been significant advances in our understanding of light and its effects on mammals, particularly laboratory animals. Indeed, some of this earlier work11,37 led to the new recommendations for improved animal room lighting and lighting protocols in the more recent 8th edition of The Guide.46 The duration and wavelength of animal room lighting, key components of circadian regulation in all mammals, have long been important considerations in animal facility lighting design. However, the effect of different standard laboratory animal cage colors (specifically, the principal wavelengths of visible and near-visible light they transmit to laboratory animals during the light phase) on the circadian regulation physiology and metabolism had not been examined previously.
The current study examined the hypothesis that the spectral transmittance or quality (color) of light passing through standard laboratory rodent cages alters circadian melatonin production as well as the daily temporal coordination of normal metabolic and physiologic activities in female nude rats typically used in cancer research. Our basic approach was to house these rats in 1 of 3 types of standard rodent cages currently used in laboratory animal facilities worldwide. Caging differed in tint (that is, clear, amber, or blue), thereby exposing rats during the light-phase to different spectral transmittances of light, whereas intensity and duration of light exposure remained constant for all rats. We evaluated the rhythm of melatonin production as well as other chronobiologic rhythms of physiology and metabolism that are often altered in and may even underlie metabolic disorders such as glucose intolerance,52,55,99 insulin resistance,4,9,49,55,97 type II diabetes,52,55,99 and obesity78,79 as well as cardiovascular disease25,26,51 and cancer.7,8,19-21
Materials and Methods
Reagents.
HPLC-grade chloroform, ethyl ether, methanol, glacial acetic acid, heptane, hexane, were purchased from Fisher Chemical (Pittsburgh, PA). Free fatty acid, cholesterol ester, triglyceride, phospholipid, rapeseed oil methyl ester standards and boron trifluoride–methanol, potassium chloride, sodium chloride, and perchloric and trichloroacetic acids were purchased from Sigma Scientific (St Louis, MO). UltraPure water (catalog no. 400000) was purchased from Cayman Chemical (Ann Arbor, MI).
Animals, housing conditions, and diet.
The female adult (age, 3 to 4 wk), pigmented, homozygous, athymic, inbred nude rats (Hsd:RH-Foxn1rnu) used in this study were purchased from Harlan (Indianapolis, IN) and were certified by the vendor to be free of all known rodent bacterial, viral, and parasitic pathogens. Rats were maintained in an AAALAC-accredited facility in accordance with The Guide.46 All procedures for animal use were approved by the Tulane University IACUC.
Rats were maintained in cages containing hardwood maple bedding (catalog no. 7090, Sanichips, Harlan Teklad, Madison, WI; 2 bedding changes weekly). To ensure that all rats remained free from infection with bacterial and viral agents, serum samples from sentinel animals housed only on the combined soiled bedding from other study cages in the same housing unit were tested quarterly and during the course of this study by multiplex fluorescent immunoassays for rat coronavirus, Sendai virus, pneumonia virus of mice, sialodacryoadenitis virus, Kilham rat virus, Toolan H1 virus, reovirus type 3, Mycoplasma pulmoni, lymphocytic choriomeningitis virus, mouse adenoviruses 1 and 2, Hantaan virus, Encephalitozoon cuniculi, cilia-associated respiratory bacillus, parvovirus NS1, rat parvoviruses, and rat murine virus, and rat theilovirus (IDEXX Research Animal Diagnostic Laboratory, Columbia, MO) as well as external and internal parasites. All blood samples analyzed during the course of this study tested negative for the listed bacterial and viral agents. Rats had free access to acidified water and food (Irradiated Laboratory Rodent Diet 5053, Purina, Richmond, IN), prepared in accordance with national standards.69 Quadruplicate determinations of this diet contained (per 100 g) 4.1 g total fatty acid (TFA), composed of 0.03% myristic (C14:0), 12.53% palmitic (C16:0), 0.22% palmitoleic (C16:1n7), 3.15% stearic (C18:0), 21.78% oleic (C18:1n9), 56.48% linoleic (C18:2n6), 5.28% γ-linolenic, and 0.26% arachidonic (C20:4n6) acids. Minor amounts of other fatty acids comprised 0.27%. Conjugated linoleic acids and trans fatty acids were not present. More than 90% of the TFA was in the form of triglycerides; more than 5% was in the form of free fatty acids.
Caging, lighting regimens, and spectral transmittance measurements.
After a 1-wk acclimation period, rats were randomized into 3 designated groups of 6 rats each (3 per cage) and placed in standard translucent laboratory rodent cages (10.5 in. × 19 in. × 8 in.; wall thickness, 0.10 in.) that were either clear, amber, or blue in hue (Figure 1). Cages used in this study were purchased from Ancare (polycarbonate translucent clear: catalog no. R20PC; polysulfone translucent amber, catalog no. R20PLF; Bellmore, NY) or Lab Products (polycarbonate translucent blue: catalog no. 80778CC; Seaford, DE). Among the 3 cage types evaluated, the blue cages are in least common use today. Polycarbonate plastic is the most widely used laboratory animal caging material due to its temperature resistance, impact resistance, versatility, ease of cleaning, and low cost and is derived from rigid polymers of carbonate groups. Polysulfone plastic is used extensively in laboratory animal caging because of its versatility and ability to withstand higher temperatures in autoclaving (above 131 °C), alkalies, and acids and is made from polymers of repeating polysulfone group (with aryl-SO2-aryl subunits).29 All cages were maintained with identical stainless steel lids (catalog no. 10SS, Ancare) for cradling food and water and were covered by polysulfone translucent clear microfilter tops (catalog no. N10MBT, Ancare). The SPF rats were maintained in environmentally controlled rooms (25 °C; 50% to 55% humidity) with diurnal lighting on a 12:12-h light:dark cycle (lights on, 0600). Animal rooms were lighted with a series of 3 overhead ballast–lamp systems each containing 4 cool-white fluorescent lamps (catalog no. F32T8TL741, Alto Collection, 32 W, Philips Somerset, NJ); animal rooms were completely devoid of light contamination during the dark phase.19-21 Daily during the course of the current experiment, the animal room was monitored for normal light-phase lighting intensity (spectral power distribution) at 1 m above the floor in the center of the room (at rodent eye level) and outside, from within, and at the front of the animal cages by using a radiometer–photometer (model no. IL1400A) and radiance detector (model no. SEL033; using F filter no. 23104 and W diffuser no. 6849), all from International Light Technologies (Peabody, MA); these instruments were calibrated regularly during the course of this study. Each day and at the same time (0800), prior to light intensity measurements for that day, all cages on the rack shelf were rotated one position to the right (placed at an identical, premeasured distance apart) in the same horizontal plane; the cage at position 6 (last position at far right on the shelf) was moved to position 1 (first position at far left on the shelf). Although there were no significant differences in light intensity, as measured outside of and from within at the front of each cage at each of the 6 positions, the daily cage shift further ensured uniformity of intensity of ocular light exposure and accounted for the effects of any unforeseen subtle differences due to position on the rack shelf.
Figure 1.

Photoimage showing the standard polycarbonate translucent clear (left), polysulfone amber (center), and polycarbonate blue (right) rat cages. All animal cages had the same dimensions (19 in. × 10.5 in. × 8 in.; wall thickness, 0.1 in.) and were autoclavable to 121 °C.
To minimize the potentially confounding effects of cage clouding or aging due to cage cleaning during the course of this study, only new cages were used. Cages were cleaned and sanitized by using a cage and rack washer–disinfector system (model no. GEW 112222, Getinge, Rochester, NY) with a high-detergency, low-alkaline compound (catalog no. 18030F, Pharmacal, Naugatauk, CT) and a phosphoric acid washing detergent (catalog no. 08430F, Pharmacal) followed by sufficient fresh-water rinsing at 82 °C (180 °F) for 3 min (total cycle time, 30 min) to reduce potential soap-film buildup and clouding; although the cages were not autoclaved, the procedure describe here resulted in thorough sanitation. Cages then were tested microbiologically by using a novaLUM luminometer (model no. 001, Charm Sciences, Lawrence, MA). All cages underwent 4 cleaning treatments during the course of the study; the cleaning treatment did not introduce noticeable pitting, glazing, or cracking that might affect light transmittance. Cage light-intensity measurements made daily over the 6-wk course of this study showed no variation as a result of the cleaning procedure.
Under current convention, during discussions of human and laboratory animal environments, the term ‘luminous flux’ (lux) is used to indicate the amount of light falling on a surface that stimulates the mammalian eye during daytime (that is, the perceived brightness to the eye; photometric values). Measures of lux are appropriate for human daytime vision but are inappropriate for quantifying light stimuli that regulates circadian, neuroendocrine, or neurobehavioral physiology in animals or humans.11,12,56 Consequently, we measured the radiometric values of irradiance (in μW/cm2) in the cages by using the same equipment and system as used in the animal quarters. According to these standards, the light stimuli in the investigation we report here are presented in terms of lux and μW/cm2 for ease of understanding.
Measures of spectral transmittance through cages were taken in a windowless room (17.5 ft × 13.5 ft) that was illuminated by 3 lighting fixtures (2 ft × 4 ft) each containing 4 32-W, 48-in. T8, fluorescent lamps (color temperature, 3500 K; Osram Sylvania, Westfield, IN) behind clear, prismatic acrylic diffusers. The test room measured near-identical luminosity and irradiance lighting conditions to those of the animal room with identical cool-white fluorescent full-spectrum lighting and without rats in the cages at the time of testing. Correlated color temperature (in degrees Kelvin), a measure of the color appearance of light transmitted into the cages as it relates to temperature (in degrees Kelvin) and photon flux (photons/cm2/s), a measure of light photons landing on a given area (cm2),45 were measured by using a chromometer (model CL-200A, Konica-Minolta, Tokyo, Japan). Spectral transmittances were quantified by using a handheld spectroradiometer (FieldSpec, ASD, Boulder, CO). The 3 cage types (clear, amber, and blue) were held in place, upside-down, covering the cosine receptor foreoptic attachment used for irradiance measurements. The optical sensor on the meter was centered inside each cage and oriented in each of 4 horizontal directions of the room while spectral power measurements were recorded. In addition, the sensor was directed upward, directly toward the overhead fluorescent lamps lighting the room, at a distance of 1.4 m to the light source. Spectral power distributions were recorded when the meter was pointing directly at the overhead fluorescent lighting source, which was the most stable measurements among the 5taken for each cage and, therefore, was used for comparison between cages.
Pearson correlations were performed to determine similarities and differences of the spectral power distributions between cages. By using irradiance measures, the correlation coefficient of the spectral power distributions from 380 to 760 nm was determined. As a more detailed method of analysis, the spectral power distribution was divided into 100 bins (each bin equaled 1 nm; that is, from 400 to 500 nm), and Pearson correlations were determined between cage conditions and then combined with initial measurements.
Arterial blood collection.
After being exposed for 2 wk to the described lighting regimens, rats underwent a series of 6 low-volume blood draws via cardiocentesis to collect left ventricular arterial blood7,8,19-21,88 over a period of 30 d. Briefly, blood collections on all rats in each group (n = 6 per group) were designated at 4-h intervals (that is, at 0400, 0800, 1200, 1600, 2000, and 2400) to cover the 24-h feeding period. For example, all rats in all 3 groups were tested at 0400; sampling for the next time point (that is, 0800) was 5 d later. Accordingly, each rat was tested only once every 5 d to eliminate the effects on feeding, stress and potential mortality, for a combined total of 108 whole blood samples (that is, 6 rats per group × 3 groups × 6 time points per rat). Each rat was lightly anesthetized by using CO2 inhalation by placement for 10 to 15 s into an acrylic gas anesthetizing chamber (10 in. × 8 in. × 8 in.; catalog no. AB2, Braintree Scientific, Braintree, MA), through which CO2 and air were passed to approximate a 70% CO2:30% air environment. At the first sign of unconsciousness (that is, loss of righting reflex) and while spontaneously breathing, the rat was removed from the chamber in preparation for cardiocentesis and placed in supine position to breath room air unassisted; 1-mL samples (less than 5% total blood volume) were taken from the left ventricle by cardiocentesis via tuberculin syringe (25-gauge, 3/8 in.; Becton-Dickinson, Franklin Lakes, NJ) moistened with sodium heparin (1000 U/mL; Elkin-Sinn, Cherry Hill, NJ).20,21 Blood sampling during the dark-phase (that is, 2000, 2400, and 0400) was performed under a safelight red lamp (120 V, 15 W, model B, catalog no. 152 1517, Kodak, Rochester, NY) to preserve the nocturnal melatonin surge.7,8,13,14,44,64 Exposure at the red lamp at rat eye level during the 45-s cardiocentesis procedure was no greater than 0.48 ± 0.01 lx (1.16 ± 0.04 μW/cm2). The investigators have more 35 y experience in using this institutional IACUC-approved cardiocentesis technique. There were no complications (such as moribundity and morbidity) due to anesthesia or cardiocentesis during the course of the investigation, and rats were active immediately after the procedure.
Arterial blood glucose, lactate, and acid–gas measurements.
At the time of each cardiocentesis time point sampling, a portion of the whole blood collected (95 µL) was taken for measurement of pH, pO2, pCO2, glucose, and lactate levels by using an iSTAT1 Analyzer and CG4+ and CG8+ cartridges (Abbott Laboratories, East Windsor, NJ). Minimal detection levels for pH, pO2, pCO2, glucose and lactate values were 0.01, 0.1 mm Hg, 0.1 mm Hg, 0.2 mg/dL, and 0.01 mmol/L, respectively. After these measurements, all remaining whole-blood samples were centrifuged at 12,000 × g for 10 min at 4 °C (model Micro17R, accuSpin centrifuge, Fisher Scientific, Fair Lawn, NJ) for plasma collection. Plasma samples were stored at −20 °C until assayed for melatonin, corticosterone, insulin, leptin, and total fatty acids.
Melatonin analysis.
Arterial plasma melatonin levels were measured by using a 125I-melatonin rat radioimmunoassay kit (catalog no. BA 3500, Labor Diagnostika Nord, Nordham, Germany) and analyzed by using an automated gamma counter (model Cobra 5005, Hewlett Packard, Palo Alto, CA).20,21 The minimal detection level for the assay was 1 to 2 pg melatonin per milliliter of plasma.
Fatty acid extraction and analysis.
Arterial plasma free fatty acids, triglycerides, phospholipids, and cholesterol esters were extracted from 0.1-mL samples, as previously described.8,9,19-23,88,89 Prior to extraction, heptadecanoic acid (100 µg) that had been dissolved in chloroform (Fisher Scientific) was used as an internal standard. Methyl esters of fatty acids were analyzed by using a gas chromatograph (model 5890A, Hewlett Packard) fitted with a flame ionization detector (model no. 7673A, Hewlett Packard), autoinjector (model no. 7673S, Hewlett Packard), and integrator (model no. 3396A, Hewlett Packard). All separations were completed by using a 0.25-mm × 30-m capillary column (model no. 2380, Supelco, Bellefonte, PA) at 190 °C, with helium as the carrier gas (linear rate, 20 cm/s; split, 100:1). The injection port and detector were adjusted to 220 °C. All methyl esters were identified on the basis of their retention time, compared with that of known standards. The minimal detectable limit for the assay was 0.05 μg/mL.
ELISA of corticosterone, insulin, and leptin.
Arterial plasma samples were prepared in duplicate for the measurement of corticosterone, insulin, and leptin levels by using corticosterone (catalog no. 55-CORMS-E01, mouse–rat, ALPCO, Salem, NH), insulin (catalog no. 80-INSRTH-E01, rat, high-range, ALPCO), and leptin (catalog no. 22-LEPMS-E01, mouse–rat, ALPCO) chemiluminescent ELISA diagnostic kits. Samples were measured at 450 nM on a microplate reader (VersaMax, Molecular Devices, Sunnyvale, CA). Detection sensitivity for corticosterone, insulin, and leptin plasma analyses were 4.5 ng/mL, 0.124 ng/mL, and 10 pg/mL, respectively; lower limits of the assays were 15 ng/mL, 0.15 ng/mL, and 10 pg/mL, respectively; and coefficients of variation for all assays were less than 4.0%.
Statistical analysis.
Unless otherwise noted, all data are presented as mean ± 1 SD (n = 6 per group) and were compared by using one-way ANOVA followed by the Bonferroni multiple-comparison test to evaluate differences (Prism, GraphPad Software, La Jolla, CA). Differences among group means were considered statistically significant at a P level of less than 0.05.
Results
Measurement of animal room illumination and spectral transmittance through caging.
Daytime animal room illumination (mean ± 1 SD; n = 90 measurements) at the center of the room and at 1 m above the floor (radiance detector facing upward toward light ballasts) had relatively little variance and was 421.63 ± 4.17 lx (172.87 ± 1.71 μW/cm2). Measurements of photometric illuminance (lux) and radiometric irradiance (μW/cm2) from outside and inside the front of each cage type, made daily as cages were shifted left-to-right at the same level on the caging racks, showed little to no intercage variability, and the mean values were 131.59 ± 4.17 lx (53.95 ± 1.71 μW/cm2 outside and at the front of the cage and 91.98 ± 5.31 lx (37.71 ± 2.18 μW/cm2) inside at the front of the cage. Spectral power distributions of light measured through the wall of each cage type (Figure 2) were typical of this fluorescent lamp type, with signature peaks in the appropriate wavelengths. Differences in the amplitude of these peaks are apparent between cage types. Blue cages contained the highest peak amplitude (3% higher than clear and 16% higher than amber cages, respectively), and the amber cage displayed the lowest peak amplitude (8% lower than the clear cage) in the short-wavelength (400 to 550 nm) segments. As expected, in long-wavelength (550 to 700 nm) ranges, peak amplitude shifted, with clear and amber cages demonstrating larger peak amplitudes (10% and 14%, respectively) compared with that of blue cages in peaks over 550 nm. The Pearson correlation coefficient between cage conditions did not demonstrate a significant difference based on linearity of the curves. Several significant (P < 0.05) differences in peak amplitude between cage types are apparent, with blue cages displaying larger peak amplitudes in the short-wavelength portions of the human visible spectrum (390 to 550 nm) and amber and clear cages displaying larger peak amplitudes in the long-wavelength areas (550 to 700 nm), as expected.
Figure 2.

Measurements of spectral transmittance through standard polycarbonate translucent clear, polysulfone amber, and polycarbonate blue animal cages.
Table 1 presents the measured interior radiometric and photometric values of the clear, blue, and amber cages used in this study. The measured correlated color temperature of the fluorescent lamps in the room was 3250 K; there were no significant differences between the correlated color temperatures for the room and those for the rats in each type of cage; in addition, cage group measurements were not significantly different from one another. The recorded irradiance (µW/cm2), illuminance (lux), and photon density values revealed minimal differences in light transmittance depending on the color of the cage. Four peak irradiance values correlating to the mercury and phosphor emissions that are typical to this type of fluorescent light source45 were chosen for a comparison of peak amplitudes between cages (Table 2). Blue-tinted cages revealed maximal irradiance value differences nearer the blue portion of the visible spectrum (480 nm) compared with those for amber (18.1%) and clear (–6.7%) cages; amber-tinted cages (A) showed maximal irradiance value differences nearer the yellow portion of the visible spectrum (532 nm) compared with those for blue (9.6%) and clear (–3.0%) cages.
Table 1.
Radiometric and photometric values inside the translucent clear, amber, and blue cages
| Clear | Amber | Blue | |
| Irradiance (µW/cm2) | 84 | 80 | 74 |
| Photon flux (×1015 photons/cm2/s) | 1.20 | 1.12 | 1.17 |
| Illuminance (lx) | 238 | 238 | 216 |
| Correlated color temperature (K) | 3250 | 3142 | 3484 |
Table 2.
Irradiance (μW/m2) and differences (%) between peak wavelengths.
| Peaks | Cage color | 424 nm | 480 nm (blue) | 532 nm (amber) | 605 nm |
| Irradiance | Clear | 0.0171 | 0.0166 | 0.0649 | 0.0691 |
| Blue | 0.0181 | 0.0177 | 0.0669 | 0.0633 | |
| Amber | 0.0131 | 0.0145 | 0.0605 | 0.0667 | |
| Difference between peaks | Clear vs blue | −5.9 | −6.7 | −3.0 | 8.4 |
| Clear vs amber | 23.0 | 12.6 | 6.9 | 3.4 | |
| Blue vs amber | 27.3 | 18.1 | 9.6 | −5.4 |
Food and water intakes and growth rates.
There were no significant differences in food or water intake or body growth rate among the various caging groups during the course of this study. Daily food intake was 8.39 ± 0.86 g per 100 g body weight, daily water intake was 12.30 ± 2.01 mL per 100 g body weight daily, and daily weight gain was 2.20 ± 0.40 g (n = 33 measurements per group).
Plasma melatonin values.
Diurnal rhythms in concentrations of plasma melatonin for animals in groups A through C are shown in Figure 3. Daily rhythms in plasma melatonin were similar for all groups: low during daytime (< 10 pg/mL), significantly (P < 0.001) higher during the dark-phase (with peak levels occurring between 2400 and 0400), and decreasing to a nadir between 1200 and 1600 h. Peak dark-phase melatonin levels for rats in blue cages were nearly 4-fold higher (P < 0.05) than those of rats in amber cages and nearly 7-fold higher (P < 0.001) than those for rats in clear cages. The dark-phase peak melatonin levels of rats in amber cages were nearly 2-fold higher (P < 0.05) than those of rats in clear cages. There were no differences in either the phase (for example, timing) or duration of the nocturnal melatonin signal among the 3 groups of rats. The integrated mean levels of melatonin over the 24-h period for rats in blue cages were nearly 3-fold higher (P < 0.05) than those of rats in amber cages and nearly 5-fold higher (P < 0.05) than those of rats in clear cages; integrated mean levels for rats in amber cages were 1.3-fold higher (P < 0.05) than those of rats in clear cages.
Figure 3.

Diurnal plasma melatonin levels (pg/mL; mean ± 1 SD) of female nude rats (n = 6 per group) maintained for 6 wk in a controlled 12:12-h light:dark cycle (300 lx; 123 µW/cm2; lights on, 0600) in either standard polycarbonate translucent clear (black circles), polysulfone amber (amber squares), or polycarbonate blue (blue triangles) rodent cages. Rats were exposed to dark-phase lighting cycles from 1800 to 0600 h (dark bars). Data from 2 replicate experiments are shown. *, Value is significantly (P < 0.05) different from nonmarked values of the same group.
Arterial plasma TFA.
The diurnal rhythms in concentrations of arterial blood plasma TFA with free access to food were measured in the female nude rats (Figure 4). The plasma lipid levels followed that of the normal feeding pattern, as reported earlier.21,87,88 Plasma TFA measured during the light phase (1600) were significantly (P < 0.001) less than those during the dark phase (0400) for all 3 groups, with peak values (at 0400) significantly (P < 0.05) different for groups in amber and blue cages compared with clear cages (that is, clear > amber > blue). In addition, calculated total TFA assessed over the 24-h day (Figure 4) were significantly (P < 0.05) different from one another at 29.1 mg/mL (clear cages), 26.7 mg/mL (amber cages), and 25.1 mg/mL (blue cages).
Figure 4.
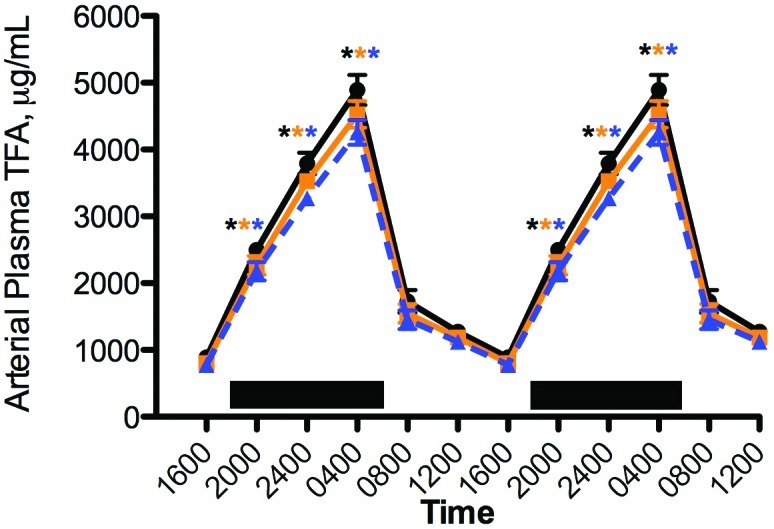
Diurnal changes in the blood plasma lipid concentrations in the arterial blood of adult female nude rats fed normal chow ad libitum and maintained in standard polycarbonate translucent clear (black circles), polysulfone amber (amber squares), or polycarbonate blue (blue triangles) rodent cages. Rats were exposed to dark-phase lighting cycles from 1800 to 0600 (dark bars). The plasma total fatty acid value (µg/mL; mean ± 1 SD; n = 6 per group) at each time point was the sum of myristic, palmitic, palmitoleic, stearic, oleic, linoleic, and arachidonic acids. Data from 2 replicate experiments are shown. *, Value is significantly (P < 0.05) different from nonmarked values of the same group.
Arterial blood glucose, lactate and acid-gas levels.
Figure 5 depicts daily rhythms in levels of arterial blood glucose, lactate, pO2, and pCO2 in female nude rats from all groups. Phase shifts were determined by comparing peak values (acrophases) of rats in amber and blue cages with those of rats in clear cages. A ‘phase-advance’ was defined as a shift in a group peak level to an earlier time (that is, from 1200 to 0800) as compared with values from rats in clear cages, whereas a ‘phase-delay’ was defined as a shift in a group to a later time (that is, from 0400 to 0800). Daily rhythms for arterial glucose and lactate concentrations of rats in amber and clear cages (Figure 5 A and B) followed near-identical patterns and demonstrated 2 peaks, one occurring at the middle of the light phase (1200) and the other occurring early during the dark phase (2000). Major peaks in both blood glucose and lactate levels for rats in blue cages occurred at 0800 and appeared to be phase-advanced by 4 h as compared with those for rats in clear cages, followed by a minor peak at 2000, which was coincident with the second glucose and lactate peaks for rats in clear cages. Total calculated areas under the glucose curves over the 24-h day were lowest for group B, as compared with groups A and C (P < 0.05). Average mean blood glucose concentrations calculated over the 24-h day were 165.3 ± 1.7 mg/dL for rats in clear cages, 155.3 ± 2.2 mg/dL in amber cages, and 138.3 ± 1.9 mg/dL in blue cages. Calculated average mean daily arterial lactate assessed over the 24-h day was lowest (P < 0.05) for rats in blue cages (1.14 ± 0.04 mmol/L) compared with that in rats in amber (1.25 ± 0.05 mmol/L) or clear (1.25 ± 0.03 mmol/L) cages.
Figure 5.

Diurnal changes in arterial (A) blood glucose (mg/dL; mean ± 1 SD), (B) lactate (mmol/L; mean ± 1 SD), (C) pO2 (mm Hg; mean ± 1 SD), and (D) pCO2 (mm Hg; mean ± 1 SD) of female nude rats (n = 6 per group) maintained in either standard polycarbonate translucent clear (black circles), polysulfone amber (amber squares), or polycarbonate blue (blue triangles) rodent cages, fed normal chow ad libitum, and exposed to dark-phase lighting cycles from 1800 to 0600 (dark bars). Data from 2 replicate experiments are shown. *, Value is significantly (P < 0.05) different from nonmarked values of the same group.
Daily rhythms in arterial pO2 (Figure 5 C) were nearly identical for rats in amber and clear cages, with peak values occurring late in the light phase (1600) and lowest values at the middle of the dark phase (2400). Compared with those is clear cages, rats in blue cages showed an apparent 8-h phase-advance of the major peak at 0800, which was followed by a second minor pO2 peak at 2000 that seemed to be phase-delayed by 4-h compared with the 1600 peaks in the groups in amber and clear cages. Calculated average mean daily arterial pO2 values over the 24-h day (Figure 1 C) were not significantly different from one another (overall mean, 153.0 ± 1.7 mm Hg; n = 108 measurements). Daily rhythms for arterial pCO2 (Figure 5 D) were nearly identical for rats in amber and clear cages, with a major peak value occurring during the light phase at 0800 followed by a minor peak at 2000. In contrast, rats in blue cages evinced a major peak at 1600 that appeared to be 8 h phase-delayed from that of those in amber cages and a secondary peak at 2400 that was 4 h phase-delayed relative to the secondary peak in those in clear cages. Total daily mean arterial pCO2 values were significantly (P < 0.05) lower in rats in blue compared with amber and clear cages. Calculated average mean daily arterial pCO2 assessed over the 24-h day (Figure 5 D) were not significantly different from one another (overall mean, 30.9 ± 0.1 mm Hg; n = 108 measurements).
Arterial blood pH, O2 saturation, and hematocrit were relatively constant for all groups over the 24-h day at 7.425 ± 0.071, 99.1 ± 0.01%, and 45.11 ± 0.05 (n = 108 each), respectively. These values are consistent with carotid arterial values for blood acid–gases determined during previous cardiocentesis investigations at this time of day.20,21
Arterial plasma corticosterone, insulin, and leptin concentrations.
Plasma corticosterone levels revealed clear differences among all groups of rats with regard to integrative concentrations (Figure 6). Values for arterial plasma corticosterone in all groups increased (P < 0.05) at the end of the light-phase with peak levels occurring at 1600 (blue > amber > clear; P < 0.05) that eventually decreased to a nadir at middark phase (2400). A second, but lower-amplitude, peak occurred near the end of the dark phase (0400) in rats in both amber and blue cages (clear > amber > blue; P < 0.05), decreasing to a nadir at 0800 (P < 0.05), whereas a second, higher-amplitude, peak occurred at 0400 in rats in clear cages. Integrated mean plasma corticosterone concentrations calculated over the 24-h day were significantly (P < 0.05) different from one another at 344.0 ± 2.0 ng/mL (997.6 ± 5.8 nmol/L) for rats in clear cages, 422.1 ± 2.0 ng/mL (1224.1 nmol/L) for those in amber cages, and 455.5 ± 5.0 ng/mL (1321.0 ±14.5 nmol/L) for those in blue cages.
Figure 6.
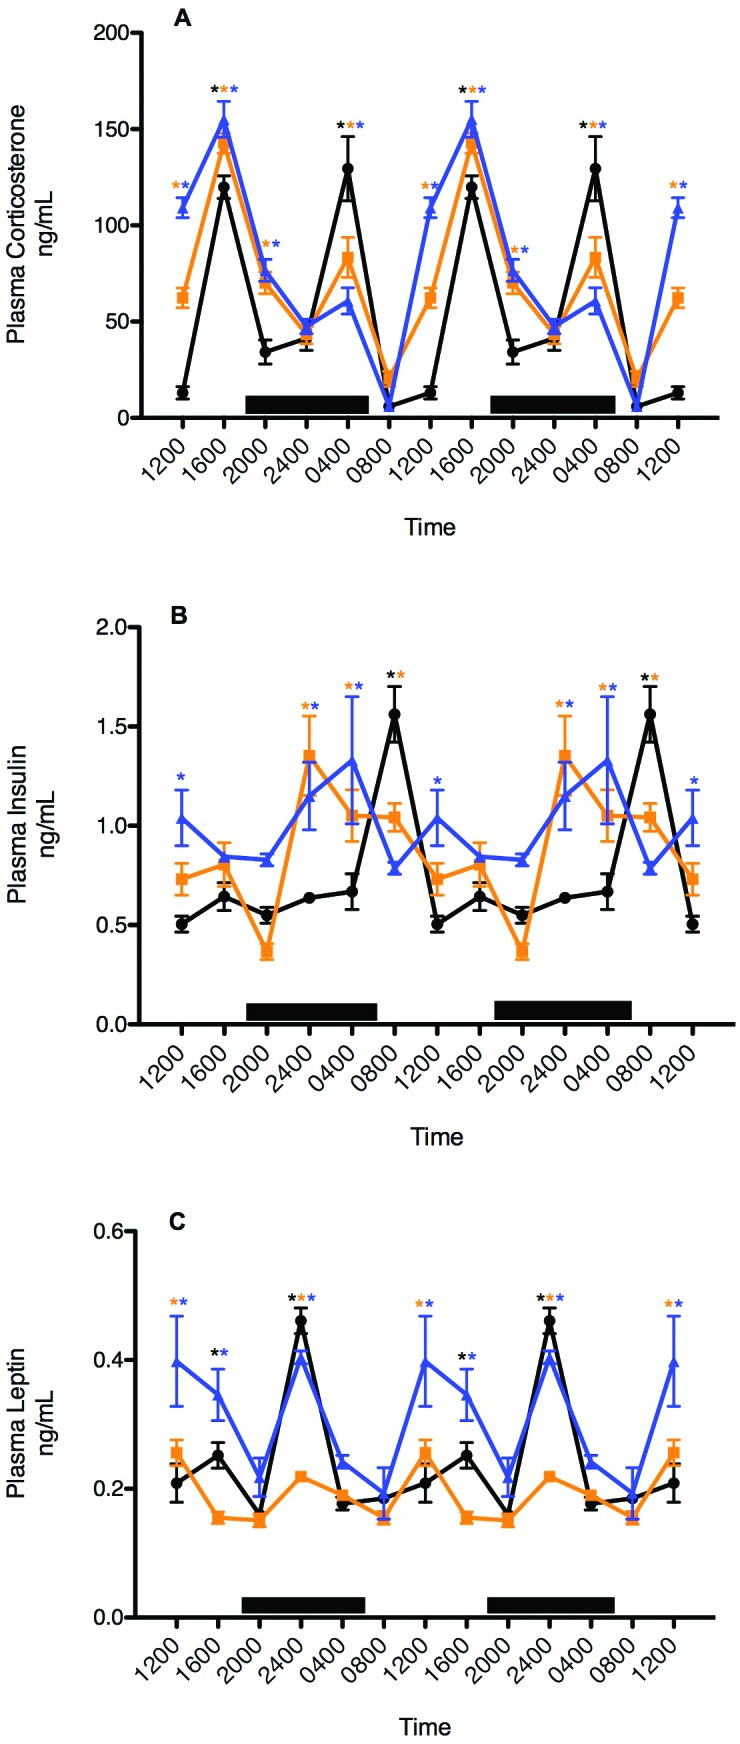
Diurnal changes in plasma (A) corticosterone (ng/mL), (B) insulin (ng/mL), and (C) leptin (pg/mL; mean ± 1 SD; n = 6 per group) in the arterial blood of female nude rats maintained in either standard polycarbonate translucent clear (black circles), polysulfone amber (amber squares), or polycarbonate blue (blue triangles) rodent cages. Rats were exposed to dark-phase lighting cycles from 1800 to 0600 (dark bars). Data from 2 replicate experiments are shown. *, Value is significantly (P < 0.05) different from nonmarked values of the same group.
Plasma concentrations of insulin (Figure 6 B) showed clear differences among groups with regard to daily rhythms and integrative levels. Values for arterial plasma insulin in rats in clear cages increased to highest levels 2 h after onset of the light-phase (0800), with a secondary minor peak prior to onset of the dark phase (1600) and lowest levels throughout the late light and early dark phases (1600 to 2400). Rats in amber and blue cages showed steadily increasing insulin levels from the onset of the dark phase, with an 8-h phase-advanced peak level at 2400 in amber cages and a 4-h phase-advanced peak at 0400 in blue cages. The duration of peak insulin levels was greater in rats in blue than clear cages. Insulin levels rapidly declined over a 4-h interval from their peak at 0800 to their lowest levels at 1200 in rats in clear cages, whereas rats in amber cages experienced a gradual decline in insulin levels over 20 h from their peak at 2400 to their lowest levels, at 2000. Integrated mean plasma insulin concentrations calculated over the 24-h day were significantly (P < 0.05) different from one another at 9.13 ± 0.06 ng/mL for rats in clear cages, 10.70 ± 0.08 ng/mL for those in amber cages, and 11.96 ± 0.09 ng/mL for those in blue cages.
Like insulin, plasma concentrations of leptin (Figure 6 C) revealed clear differences among groups with regard to diurnal rhythms and integrative levels. Arterial plasma leptin levels peaked sharply at middark phase (2400) in rats in both blue and clear cages, whereas rats in amber cages showed a much lower peak at this same time point. Nadirs in blood leptin concentrations occurred at 0400 in clear cages and at 0800 in amber and blue cages. Rats in blue cages had second similar, albeit broader, peak amplitude in leptin levels 12 h later, at the midlight phase (1200), whereas a higher amplitude secondary peak occurred at this time point in rats in amber cages. The secondary peak was significantly (P < 0.05) higher in rats in blue cages compared with amber and clear. Integrated mean plasma leptin concentrations calculated over the 24-h day were significantly (P < 0.05) different, at 2.89 ± 0.46 ng/mL for rats in clear cages, 2.25 ± 0.26 ng/mL for those in amber cages, and 3.60 ± 0.40 ng/mL for those in blue cages.
Discussion
The profound effects of light on mammalian circadian behavioral, physiologic, and metabolic processes are well established.7,11,20,28,36 Indeed, in all vertebrates, these processes are under control of the SCN, the master biologic clock, which itself is entrained by regular alterations in light–dark cycles and the daily melatonin signal. In the absence of signals from the SCN, circadian rhythms of cellular physiology and metabolism in peripheral tissues become disrupted or decoupled, culminating in extreme disorganization of overall whole-body physiology and metabolism. As outlined in The Guide,46 appropriate light and lighting cycles are essential for maintaining the health and wellbeing of laboratory animals used in scientific investigations, and the results of animal experiments often are extrapolated to the realm of human biology to explain mechanisms of physiology and disease. Therefore, elucidating and understanding the effects of the spectral transmittance of light through standard but differently colored laboratory cages on the physiology and metabolism in laboratory animals is crucial.
The radiometric and photometric data that we provide here illustrate that the photic environments within the 3 cage types investigated were significantly different from one another only in spectral transmittance of light (color) passing into the cage. Irradiance, photon flux, illuminance, and correlated color temperature values were similar among the 3 cage groups. Rats housed in either polycarbonate clear, polysulfone amber-tinted, or polycarbonate blue-tinted standard laboratory cages were maintained in an environment where both the intensity and duration of lighting remained constant during the light-phase. We tested the hypothesis that daily rhythms of arterial blood melatonin, TFAs, glucose, lactic acid, acid–gases, corticosterone, insulin, and leptin concentrations are differentially altered in pigmented nude rats exposed to either light in cages that transmit more amber-appearing (550 to 580 nm) or blue-appearing (450 to 480 nm) light as compared with those of rats that received the broad spectrum of visible light (390 to 550 nm) transmitted through clear cages during the light phase. With the exception of the circadian rhythm in blood TFA levels, all physiologic and metabolic rhythms were significantly changed in response to exposures of altered spectral transmittances of light (for example, amber and blue) that differed from the transmittance of broad-spectrum light during the light-phase of a 12:12-h light:dark cycle. Depending on the circulating factor measured, these alterations included changes in rhythm amplitude, phasing (for example, timing), or duration or combinations of these rhythm characteristics. These altered rhythms, however, appear to be independent from the SCN-generated rhythms in dietary intake of TFA (discussed later).
In the case of melatonin, there were no alterations in either the timing or duration of the nocturnal circadian plasma melatonin signal among rats housed in the 3 different cage types. However, amplitudes in the melatonin signal varied markedly; the amplitude of nocturnal plasma melatonin in rats housed in blue-tinted cages was nearly 7-fold higher than for rats housed in clear cages, which we used in previous studies.7,8,19-23,87-89 To our knowledge, this current study is the first in which exposure of a rodent species to a spectral transmittance of light enhanced in the 450- to 480-nm range during the light phase has been shown to markedly augment the amplitude of the melatonin signal during the subsequent dark phase. A similar finding has been reported for pineal levels of melatonin in male rats: melatonin production during the dark phase was higher in rats exposed to natural bright sunlight during the day (for example, 13 h) as compared with the light emitted by cool white fluorescent lamps in a windowless room for the same day length.53 In addition to the much greater irradiance provided by natural sunlight, we speculate that the predominance of blue wavelengths in natural sunlight contributed to enhancement of nocturnal melatonin production. The physiology by which either the wavelength or intensity (or both) of light during the light phase induced more robust melatonin production during the subsequent dark phase of a 24-h day is unknown.
Although a very slight attenuation in the nocturnal amplitude of the plasma TFA rhythm occurred at the end of the dark phase (0400) in rats in amber and blue cages compared with clear cages in the current study, the overall pattern of this circadian rhythm, which is dependent on the SCN-driven feeding activity, was virtually identical among these 3 groups in previous studies.20,21,87-89 In the present study, dietary and water intake appear to be in good agreement with that determined for healthy, young female Hsd:RH-Foxn1rnu nude rats in previous studies.7,20,21
The phasing, amplitudes, and durations of the daily oscillations in arterial plasma glucose and lactate concentrations (Figure 5) and arterial pO2 and pCO2 in rats housed in polysulfone amber-tinted cages closely matched those in observed in animals maintained in polycarbonate clear cages. In the rats housed in polycarbonate blue-tinted cages, both the glucose and lactate rhythms were phased-advanced by 4 h as compared with that in clear cages. In addition, the overall 24-h integrated levels of glucose and lactate levels were lower in blue cages, as compared with amber and clear cages.
Increased corticosterone levels have long been associated with a number of stressors, including anxiety, fear, pain, hemorrhage, infections, low blood glucose, and starvation.25,34,35,50,70,93 This potent glucocorticoid acts on important metabolic tissues such as muscle, liver and adipose tissues to alter metabolism and provide the animal with necessary bioenergetics fuels to better cope with stress.70 Circadian variations in levels of plasma corticosterone in the laboratory rat were first reported in 195935 and were confirmed by other studies over the years.20,25,34,50,93 Under normal conditions of a 12:12-h light:dark cycle (as is shown in the current study), circulating corticosterone levels evinced 2 major peaks, one near the end of the light phase and a second, slightly higher peak near the end of the dark phase, in rats housed in translucent clear polycarbonate cages (Figure 6). In groups in amber and blue cages, the timing of the first and second corticosterone peaks were identical to those in clear cages, but the amplitudes and durations of the first peaks were higher and the amplitudes of the second peaks were lower compared with those in rats in clear cages. Others have shown that peak amplitudes vary somewhat depending on the animal strain and sex, with female rats having somewhat higher daily concentrations but male rats demonstrating a more consistent rhythm.20
The daily major peaks of plasma insulin and leptin (Figure 6) in polycarbonate clear-caged rats at the early light and middark phases, respectively, probably reflect a response to a combination of dark phase-associated, SCN-driven ingestive behaviors as well as circadian-controlled release of these hormones from pancreatic islet cells72 and adipocytes, respectively.27,47,55 These rhythms were disrupted markedly in rats housed in either amber- or blue-tinted cages as compared with the rhythmic patterns observed in the controls with respect to rhythm phasing, amplitude, and duration as well as in the 24-h integrated concentrations of these hormones. Shifts in insulin rhythm phasing accompanied by alterations in rhythm duration appeared to be more prominent in both amber and blue cages, whereas changes in leptin rhythm amplitude were greater in amber cages and the appearance of biphasic leptin peaks was more prominent in blue cages.
Because melatonin exerts regulatory effects on both glucose and lactic acid metabolism and on corticosterone, insulin, and leptin production in both humans9,47,49,53 and rats,25,27,98 we speculate that the marked changes in the circadian amplitude of melatonin, particularly in rats exposed to light in the blue-tinted cages may have affected at least some of the daily rhythm changes observed in these analytes. Other mechanisms, such as melatonin-independent circadian hormonal or neural outputs from the SCN, need also to be considered. Nevertheless, to our knowledge, this report is the first of a direct association between differences in standard laboratory cage hue and accompanying spectral transmittances, amplification of the normal nighttime melatonin signal, and disruptions in the circadian profiles of blood acid gases, glucose, lactate, corticosterone, insulin, and leptin in a mammalian species.
Lighting intensity, spectral quality, and duration are of paramount importance in maintaining stable animal models in laboratory animal facilities worldwide. Even minor variations in these parameters and lighting protocols will affect virtually every biologic response associated with animal physiology and metabolism. We currently are examining these metabolic and physiologic parameters in both pigmented and nonpigmented rats maintained in red-tinted polycarbonate laboratory animal cages (primary spectral quality 650 to 700 nm), because red- and yellow-tinted lighting environments are often used for observation purposes, particularly during the dark-phase. Further studies are needed to discern whether a single factor (for example, irradiance) or combined factors (for example, spectral transmittance and photon density) are required to evoke the biologic changes found in the current study. Our study provides compelling evidence that animals maintained in standard laboratory cages differing only in the spectral transmittance or quality of light (color) passing through the cage to the animal, compared with animals maintained in translucent clear cages exposed to the broad visual spectrum of light, develop chronobiologic disruptions in plasma measures of endocrine metabolism and physiology. Certainly an important consideration for researchers in the development of future protocols and scientific publications, as well as subsequent editions of The Guide, may well be the basic laboratory animal cage type. We believe that the findings presented here make an important contribution to our understanding regarding the influence of the spectral quality of light during scientific investigations on mammalian circadian rhythms of metabolism and physiology and may encourage improved future laboratory animal facility and cage design.
Acknowledgments
This work was supported in part by a Tulane University School of Medicine and Louisiana Cancer Research Consortium Startup Grant (no. 631455 to DEB), NIH grant (no. 1R21CA129875-01A1 to DEB), and an AALAS Grant for Laboratory Animal Science (GLAS) Award (to RTD). VPB is supported by P20RR020152 (NIH), NIA 5K01AG030074-02 (NIA), and The Ellison Medical Foundation New Scholar in Aging award 547305G1. Additional support for the Jefferson coinvestigators (JPH, BW, MJ, and GCB) was from The Institute of Integrative Health (Baltimore, MD). We acknowledge and are grateful for the technical support of Ms Rosezina L Almanza and Ms Katie L Castillo.
References
- 1.Aggelopoulos NC, Meissl H. 2000. Responses of neurones of the rat suprachiasmatic nucleus to retinal illumination under photopic and scotopic conditions. J Physiol 523:211–222 [DOI] [PMC free article] [PubMed] [Google Scholar]
- 2.Aschoff J. 1960. Exogenous and endogenous components in circadian rhythms. Cold Spring Harb Symp Quant Biol 25:11–28 [DOI] [PubMed] [Google Scholar]
- 3.Aschoff J. 1981. Handbook of behavioral neurobiology: biological rhythms. New York (NY): Plenum Press.
- 4.Bailey CJ, Atkins TW, Matty AJ. 1974. Melatonin inhibition of insulin secretion in the rat and mouse. Horm Res 5:21–28 [DOI] [PubMed] [Google Scholar]
- 5.Bellhorn RW. 1980. Lighting in the animal environment. Lab Anim Sci 30:440–450 [PubMed] [Google Scholar]
- 6.Berson DM, Dunn FA, Takao M. 2002. Phototransduction by retinal ganglion cells that set the circadian clock. Science 295:1070–1073 [DOI] [PubMed] [Google Scholar]
- 7.Blask DE, Brainard GC, Dauchy RT, Hanifin JP, Davidson LK, Krause JA, Sauer LA, Rivera-Bermudez MA, Dubocovich ML, Jasser SA, Lynch DT, Rollag MD, Zalatan F. 2005. Melatonin-depleted blood from premenopausal women exposed to light at night stimulates growth of human breast cancer xenografts in nude rats. Cancer Res 65:11174–11184 [DOI] [PubMed] [Google Scholar]
- 8.Blask DE, Dauchy RT, Sauer LA, Holowachuk E, Ruhoff M, Kopff H. 1999. Melatonin inhibition of cancer growth in vivo involves suppression of tumor fatty acid metabolism receptor-mediated signal transduction events. Cancer Res 59:4693–4701 [PubMed] [Google Scholar]
- 9.Boden GI. 2001. Obesity, free fatty acids, and insulin resistance. Curr Opin Endocrinol Diabetes Obes 19:139–143 [DOI] [PMC free article] [PubMed] [Google Scholar]
- 10.Brainard GC.1989. Illumination of laboratory animal quarters: participation of light irradiance and wavelength in the regulation of the neuroendocrine system, p 69–74. In: Science and animals: addressing contemporary issues. Greenbelt (MD): Scientists Center for Animal Welfare.
- 11.Brainard GC, Hanifin JP. 2005. Photons, clocks, and consciousness. J Biol Rhythms 20:314–325 [DOI] [PubMed] [Google Scholar]
- 12.Brainard GC, Hanifin JP, Rollag MD, Greeson JM, Byrne B, Glicman G, Gerner E, Sanford B. 2001. Human melatonin regulation is not mediated by the 3-cone photopic visual system. J Clin Endocrinol Metab 86:433–436 [DOI] [PubMed] [Google Scholar]
- 13.Brainard GC, Richardson BA, King TS, Matthews SA, Reiter RJ. 1983. The suppression of pineal melatonin content and N-acetyl-transferase activity by different light irradiances in the Syrian hamster: a dose–response relationship. Endocrinology 113:293–296 [DOI] [PubMed] [Google Scholar]
- 14.Brainard GC, Richardson BA, King TS, Reiter RJ. 1984. The influence of different light spectra on the suppression of pineal melatonin content in the Syrian hamster. Brain Res 294:333–339 [DOI] [PubMed] [Google Scholar]
- 15.Brainard GC, Vaughan MK, Reiter RJ. 1986. Effect of light irradiance and wavelength on the Syrian hamster reproductive system. Endocrinology 119:648–654 [DOI] [PubMed] [Google Scholar]
- 16.Buhr ED, Yoo SH, Takahashi JS. 2010. Temperature as a universal resetting cue for mammalian circadian oscillators. Science 330:379–385 [DOI] [PMC free article] [PubMed] [Google Scholar]
- 17.Carrillo-Vico A, Guerrero JM, Lardone PJ, Reiter RJ. 2005. A review of the multiple actions of melatonin on the immune system. Endocrine 27:189–200 [DOI] [PubMed] [Google Scholar]
- 18.Commission Internationale de l'Eclairage. 2004. Proceedings of the CIE Symposium on light and health: nonvisual effects. Vienna (Austria): Commission Internationale de l'Eclairage.
- 19.Dauchy RT, Blask DE, Sauer LA, Brainard GC, Krause JA. 1999. Dim light during darkness stimulated tumor progression by enhancing tumor fatty acid uptake and metabolism. Cancer Lett 144:131–136 [DOI] [PubMed] [Google Scholar]
- 20.Dauchy RT, Dauchy EM, Tirrell RP, Hill CR, Davidson LK, Greene MW, Tirrell PC, Wu J, Sauer LA, Blask DE. 2010. Dark-phase light contamination disrupts circadian rhythms in plasma measures of physiology and metabolism. Comp Med 60:348–356 [PMC free article] [PubMed] [Google Scholar]
- 21.Dauchy RT, Dupepe LM, Ooms TG, Dauchy EM, Hill CR, Mao L, Belancio VP, Slakey LM, Hill SM, Blask DE. 2011. Eliminating animal facility light-at-night contamination and its effect on circadian regulation of rodent physiology, tumor growth, and metabolism: a challenge in the relocation of a cancer research laboratory. J Am Assoc Lab Anim Sci 50:326–336 [PMC free article] [PubMed] [Google Scholar]
- 22.Dauchy RT, Sauer LA. 1986. Preparation of ‘tissue-isolated’ rat tumors for perfusion: a new surgical technique that preserves continuous blood flow. Lab Anim Sci 36:678–681 [PubMed] [Google Scholar]
- 23.Dauchy RT, Sauer LA, Blask DE, Vaughan GM. 1997. Light contamination during the dark phase in ‘photoperiodically controlled’ animal rooms: effect on tumor growth and metabolism in rats. Lab Anim Sci 47:511–518 [PubMed] [Google Scholar]
- 24.Davis S, Mirrick DK, Stevens RG. 2001. Night shift work, light at night, and the risk of breast cancer. J Natl Cancer Inst 93:1557–1562 [DOI] [PubMed] [Google Scholar]
- 25.De Boer SF, Van der Gugten J. 1987. Daily variations in plasma noradrenaline, adrenaline, and corticosterone concentrations in rats. Physiol Behav 40:323–328 [DOI] [PubMed] [Google Scholar]
- 26.Depres-Brummer P, Levi F, Metger G, Touitou Y. 1995. Light-induced suppression of the rat circadian system. Am J Physiol 268: R1111–R1116 [DOI] [PubMed] [Google Scholar]
- 27.Diaz B, Blazquez E. 1986. Effect of pinealectomy on plasma glucose, insulin, and glucagon levels in the rat. Horm Metab Res 18:225–229 [DOI] [PubMed] [Google Scholar]
- 28.Ebihara S, Tsuji K. 1980. Entrainment of the circadian activity rhythm to the light cycle: effective light intensity for a Zeitgeber in the rentinal degenerate C3H mouse and the normal C57BL mouse. Physiol Behav 24:523–527 [DOI] [PubMed] [Google Scholar]
- 29.Faith RE, Huerkamp MJ.2008. Environmental considerations for research animals, p 59–83. In: Hessler JR, Lehner NDM. Planning and designing research animal facilities. Burlington (MA): Academic Press.
- 30.Foster RG, Provencio I, Hudson D, Fiske S, DeGrip W, Menaker M. 1991. Circadian photoreception in the retinally degenerate mouse (rd/rd). J Comp Physiol A 169:39–50 [DOI] [PubMed] [Google Scholar]
- 31.Freedman MS, Luca RJ, Soni B, von Schantz M, Munoz M, David-Gray Z, Foster RG. 1999. Regulation of mammalian circadian behavior by non-rod, non-cone, ocular photoreceptors. Science 284:502–504 [DOI] [PubMed] [Google Scholar]
- 32.Gooley JJ, Chamberlain K, Smith KA, Sat Bir SK, Rajarathnam SMW, Van Reen E, Seitzer JM, Czeisler CA, Lockley SW. 2011. Exposure to room light before bedtime suppresses melatonin onset and shortens melatonin duration in humans. J Clin Endocrinol Metab 96:E463–E472 [DOI] [PMC free article] [PubMed] [Google Scholar]
- 33.Grossweiner LI.1989. Photophysics, 1–45. In: Smith KC. The science of photobiology. New York (NY): Plenum Press.
- 34.Gwosdow-Cohen A, Chen CL, Bosch EL. 1982. Radioimmunoassay (RIA) of serum corticosterone in rats. Proc Soc Exp Biol Med 170:29–34 [DOI] [PubMed] [Google Scholar]
- 35.Halberg F.1959. [Physiological 24-hour periodicity; general and procedural considerations with reference to the adrenal cycle]. Int Z Vitaminforsch Beih 10: 225–296. [Article in German]
- 36.Halberg F. 1969. Chronobiology. Ann Rev Physiol 31:675–725 [DOI] [PubMed] [Google Scholar]
- 37.Hanifin JP, Brainard GC.2007. Photoreception for circadian, neuroendocrine, and neurobehavioral regulation. 26: 87–94. [DOI] [PubMed]
- 38.Hanifin JP, Stewart KT, Smith P, Tanner R, Rollag M, Brainard GC. 2006. High-intensity red light suppresses melatonin. Chronobiol Int 23:251–268 [DOI] [PubMed] [Google Scholar]
- 39.Hansen J. 2001. Increased breast cancer risk among women who work predominantly at night. Epidemiology 12:74–77 [DOI] [PubMed] [Google Scholar]
- 40.Hattar S, Liao HW, Takao M, Berson DM, Yau K-W. 2002. Melanopsin-containing retinal ganglion cells: architecture, projections, and intrinsic photosensitivity. Science 295:1065–1070 [DOI] [PMC free article] [PubMed] [Google Scholar]
- 41.Hattar S, Lucas RJ, Mrosovsky N, Thompson S, Douglas RH, Hankins MW, Lem J, Biel M, Hofman F, Foster RG, Yau KW. 2003. Melanopsin and rod–cone photoreceptive systems account for all major accessory visual functions in mice photosensitivity. Nature 424:76–81 [DOI] [PMC free article] [PubMed] [Google Scholar]
- 42.Hofstetter JR, Hofstetter AR, Hughes AM, Mayeda AR. 2005. Intermittent long-wavelength red light increases the period of daily locomotor activity in mice. J Circadian Rhythms 3:8–16 [DOI] [PMC free article] [PubMed] [Google Scholar]
- 43.Honma S, Kanematsu N, Katsuno Y, Honma K. 1992. Light suppression of nocturnal pineal and plasma melatonin in rats depends on wavelength and time of day. Neurosci Lett 147:201–204 [DOI] [PubMed] [Google Scholar]
- 44.Illnerova H, Vanecek J, Hoffman K. 1983. Regulation of the pineal melatonin concentration in the rat (Rattus norvegicus) and the Djungarian hamster (Phodopus sungorus). Comp Biochem Physiol A Comp Physiol 74:155–159 [DOI] [PubMed] [Google Scholar]
- 45.Illuminating Engineering Society. 2011. The lighting handbook, 10th ed. New York (NY): Illuminating Engineering Society.
- 46.Institute for Laboratory Animal Research. 2011. Guide for the care and use of laboratory animals, 8th ed. Washington (DC): National Academies Press.
- 47.Kalsbeek A, Strubbe JH. 1998. Circadian control of insulin secretion is independent of the temporal distribution of feeding. Physiol Behav 63:553–558 [DOI] [PubMed] [Google Scholar]
- 48.Kalsbeek A, Teclemariam-Mesbah R, Cutrera RA, Perreau-Lenz S, Buijs RM.2004. Neural pathways employed by the central pacemaker to transmit its rhythmic output. Proc Sym 2004 Light and Health: nonvisual effects. Commission Internationale de l'Eclairage27:27–32.
- 49.Karlsson B, Knutsson A, Lindahl B. 2001. Is there an association between shift work and having a metabolic syndrome? Results from a population-based study of 27,485 people. Occup Environ Med 58:747–752 [DOI] [PMC free article] [PubMed] [Google Scholar]
- 50.Kennaway DJ, Voultsios A, Varcoe TJ, Moyer RW. 2002. Melatonin in mice: rhythms, response to light, adrenergic stimulation, and metabolism. Am J Physiol Regul Integr Comp Physiol 282:R358–R365 [DOI] [PubMed] [Google Scholar]
- 51.Knutsson A, Akerstedt T, Jonsson BG, Orth-Gomer K. 1986. Increased risk of ischaemic heart disease in shift workers. Lancet 2:89–92 [DOI] [PubMed] [Google Scholar]
- 52.la Fleur SE, Kalsbeek A, Wortel J, van der Vliet J, Bujis RM. 2001. Role for the pineal and melatonin in glucose homeostatsis: pinealectomy increases night-time glucose concentrations. J Neuroendocrinol 13:1025–1032 [DOI] [PubMed] [Google Scholar]
- 53.Laakso ML, Porkka-Heiskanen T, Alila A, Peder M, Johannsen G. 1988. Twenty-four–hour patterns of pineal melatonin and pituitary and plasma prolactin in male rats under ‘natural’ and artificial lighting conditions. Neuroendocrinology 48: 308–313 [DOI] [PubMed] [Google Scholar]
- 54.Li JC, Xu F. 1997. Influence of light–dark shifting on the immune system, tumor growth, and life span of rats, mice, and fruit flies as well as on the counteraction of melatonin. Biol Signals 6:77–89 [DOI] [PubMed] [Google Scholar]
- 55.Lima FB, Machado UF, Bartol I, Seraphim PM, Sumida DH, Moraes SMF, Hell NS, Okamoto MM, Saad MJA, Carvalho CRO, Cipolla-Neto J. 1998. Pinealectomy causes glucose intolerance and decreases adipose cell responsiveness to insulin in rats. Am J Physiol 275: E934–E941 [DOI] [PubMed] [Google Scholar]
- 56.Lockley SW, Brainard GC, Czeisler CA. 2003. High sensitivity of the human circadian melatonin rhythm to resetting by short-wavelength light. J Clin Endocrinol Metab 88:4502–4505 [DOI] [PubMed] [Google Scholar]
- 57.Lucas RJ, Freedman MS, Munoz M, Garcia-Fernandez JM, Foster RG. 1999. Regulation of the mammalian pineal by non-rod, non-cone, ocular photoreceptors. Science 284:505–507 [DOI] [PubMed] [Google Scholar]
- 58.Lynch HJ, Rivest RW, Ronsheim PM, Wurtman RJ. 1981. Light intensity and the control of melatonin secretion in rats. Neuroendocrinology 33:181–185 [DOI] [PubMed] [Google Scholar]
- 59.Maestroni GJ. 1995. T-helper-2 lymphocytes as a peripheral target of melatonin. J Pineal Res 18:84–89 [DOI] [PubMed] [Google Scholar]
- 60.McGuire RA, Rand WM, Wurtman RJ. 1973. Entrainment of the body temperature rhythm in rats: effect of color and intensity of environmental light. Science 181:956–957 [DOI] [PubMed] [Google Scholar]
- 61.McLennan IS, Taylor-Jeffs J. 2004. The use of sodium lamps to brightly illuminate mouse houses during their dark phases. Lab Anim 38:384–392 [DOI] [PubMed] [Google Scholar]
- 62.Menaker M. 1976. Physiological and biochemical aspects of circadian rhythms. Fed Proc 35:2325. [PubMed] [Google Scholar]
- 63.Milcu SM, Nana-Ionescu I, Milcu I.1971. The effect of pinealectomy on the plasma insulin in rats, p 345–357. In: Woltensholme GEW, Knight J. The pineal gland. Edinburgh (UK): Churchill Livingston.
- 64.Minneman KP, Lynch HJ, Wurtman RJ. 1974. Relationship between environmental light intensity and retina-mediated suppression of rat pineal serotonin-N-acetyltransferase. Life Sci 15:1791–1796 [DOI] [PubMed] [Google Scholar]
- 65.Moore RY. 1993. Organization of the primate circadian system. J Biol Rhythms 8:S3–S9 [PubMed] [Google Scholar]
- 66.Moore RY, Lenn NJ. 1972. A retinohypothalamic projection in the rat. J Comp Neurol 146:1–14 [DOI] [PubMed] [Google Scholar]
- 67.Mori W, Aoyama H, Mori W. 1989. Antihypercholesterolemic effect of melatonin in rats. Acta Pathol Jpn 39:613–618 [DOI] [PubMed] [Google Scholar]
- 68.National Aeronautics and Space Administration. 1988. Lighting requirements in microgravity––rodents and nonhuman primates, TM no.101077. Moffett Field (CA): NASA Ames Research Center.
- 69.National Research Council. 1995. Nutrient requirements of laboratory animals, p 11–79. Washington (DC): National Academies Press.
- 70.Nelson DL, Cox MM.2005. Hormonal regulation of food metabolism, p 881–922. In: Lehninger Biochemistry. New York (NY): WH Freeman.
- 71.O'Steen WK, Anderson KV. 1972. Photoreceptor degeneration after exposure of rats to incandescent illumination. Z Zellforsch Mikrosk Anat 127:306–313 [DOI] [PubMed] [Google Scholar]
- 72.Peschke E, Fautek JD, Musshoff U, Schmidt F, Beckmann A, Peschke D. 2000. Evidence for a melatonin receptor within pancreatic islets of neonate rats: functional, autoradiographic, and molecular investigations. J Pineal Res 28:156–164 [DOI] [PubMed] [Google Scholar]
- 73.Pittendrigh CS.1965. On the mechanism of the entrainment of a circadian rhythm by light cycles, p 277–297. In: Aschoff J. Circadian clocks. Amsterdam (the Neatherlands): Elsevier.
- 74.Podolin PL, Rollag MD, Brainard GC. 1987. The suppression of nocturnal pineal melatonin in the Syrian hamster: dose-dependent curves at 500 nm and 360 nm. Endocrinology 121:266–270 [DOI] [PubMed] [Google Scholar]
- 75.Poeggeler BH, Barlow-Walden LR, Reiter RJ, Saarela S, Menendez-Pelaez A, Yaga K, Manchester LC, Chen LD, Tan DX. 1995. Red-light–induced suppression of melatonin synthesis is mediated by N-methyl-d-aspartate receptor activation in retinally normal and retinally degenerate rats. J Neurobiol 28:1–8 [DOI] [PubMed] [Google Scholar]
- 76.Provencio I, Foster RG. 1995. Circadian rhythms in mice can be regulated by photoreceptors with cone-like characteristics. Brain Res 694:183–190 [DOI] [PubMed] [Google Scholar]
- 77.Radzialowski FM, Bousquet WF. 1968. Daily rhythmic variation in hepatic drug metabolism in the rat and mouse. J Pharmacol Exp Ther 163:229–238 [PubMed] [Google Scholar]
- 78.Rasmussen DD, Boldt BM, Wilkinson CW, Yellon SM, Matsumoto AM. 1999. Daily melatonin administration at middle age suppresses male rat visceral fat, plasma leptin, and plasma insulin levels to youthful levels. Endocrinology 140:1009–1012 [DOI] [PubMed] [Google Scholar]
- 79.Rasmussen DD, Mitton DR, Larsen SA, Yellon SM. 2001. Aging-dependent changes in the effect of daily melatonin supplementation on rat metabolic and behavioral responses. J Pineal Res 31:89–94 [DOI] [PubMed] [Google Scholar]
- 80.Reiter RJ. 1973. Comparative effects of continual lighting and pinealectomy on the eyes, the Harderian glands, and reproduction in pigmented and albino rats. Comp Biochem Physiol A Comp Physiol 44:503–509 [DOI] [PubMed] [Google Scholar]
- 81.Reiter RJ. 1991. Pineal melatonin: cell biology of its synthesis and of its physiological interactions. Endocr Rev 12:151–180 [DOI] [PubMed] [Google Scholar]
- 82.Reiter RJ. 1991. Pineal gland: interface between photoperiodic environment and the endocrine system. Trends Endocrinol Metab 2:13–19 [DOI] [PubMed] [Google Scholar]
- 83.Reiter RJ. 2002. Potential biological consequences of excessive light exposure: melatonin suppression, DNA damage, cancer, and neurodegenerative diseases. Neuroendocrinol Lett 23:9–13 [PubMed] [Google Scholar]
- 84.Reppert SM, Weaver DR. 2002. Coordination of circadian timing in mammals. Nature 418:935–941 [DOI] [PubMed] [Google Scholar]
- 85.Rivkees SA. 2007. The development of circadian rhythms: from animals to humans. Sleep Med Clin 2:331–341 [DOI] [PMC free article] [PubMed] [Google Scholar]
- 86.Rivkees SA, Hofman PL, Fortman J. 1997. Newborn primate infants are entrained by low-intensity lighting. Proc Natl Acad Sci USA 94:292–297 [DOI] [PMC free article] [PubMed] [Google Scholar]
- 87.Sauer LA, Dauchy RT. 1988. Identification of linoleic and arachidonic acids as the factors in hyperlipemic blood that increases [3H]thymidine incorporation in hepatoma 7288CTC perfused in situ. Cancer Res 48:3106–3111 [PubMed] [Google Scholar]
- 88.Sauer LA, Dauchy RT, Blask DE. 1997. Dietary linoleic acid intake controls the arterial blood plasma concentration and the rates of growth and linoleic acid uptake and metabolism in hepatoma 7288CTC in Buffalo rats. J Nutr 127:1412–1421 [DOI] [PubMed] [Google Scholar]
- 89.Sauer LA, Dauchy RT, Blask DE, Armstrong BJ, Scalici S. 1999. 13-Hydroxyoctadienoic acid is the mitogenic signal for linoleic acid-dependent growth in rat hepatoma 7288CTC in vivo. Cancer Res 59:4688–4692 [PubMed] [Google Scholar]
- 90.Schernhammer ES, Laden F, Speizer FE, Willett WC, Hunter DJ, Kawachi I, Fuchs CS, Colditz GA. 2001. Rotating night shifts and risk of breast cancer in women participating in the Nurses’ Health Study. J Natl Cancer Inst 93:1563–1568 [DOI] [PubMed] [Google Scholar]
- 91.Seggie J, Sha BE, Uhler I, Brown GM. 1974. Baseline 24-hour plasma corticosterone rhythm in normal, sham-operated, and septally lesioned rats. Neuroendocrinology 15:51–61 [DOI] [PubMed] [Google Scholar]
- 92.Shapiro C, Girdwood P. 1981. Protein synthesis in rat brain during sleep. Neuropharmacology 20:457–460 [DOI] [PubMed] [Google Scholar]
- 93.Shulman GI. 2000. Cellular mechanisms of insulin resistance. J Clin Invest 106:171–176 [DOI] [PMC free article] [PubMed] [Google Scholar]
- 94.Stephan FK, Zucker I. 1972. Circadian rhythms in drinking behavior and locomotor activity of rats are eliminated by hypothalamic lesions. Proc Natl Acad Sci USA 69:1583–1586 [DOI] [PMC free article] [PubMed] [Google Scholar]
- 95.Takahashi JS, DeCoursey PJ, Bauman L, Menaker M. 1984. Spectral sensitivity of a novel photoreceptive system mediating entrainment of mammalian circadian rhythms. Nature 308:186–188 [DOI] [PubMed] [Google Scholar]
- 96.Trentini GP, Genazzani AR, Criscuolo M, Petraglia F, De Gaetani C, Ficararra G, Bidzinska B, Migaldi M, Genazzani AD. 1992. Melatonin treatment delays reproductive ageing of female rats via the opiatergic system. Neuroendocrinology 56:364–370 [DOI] [PubMed] [Google Scholar]
- 97.Van Cauter E. 1998. Putative roles of melatonin in glucose regulation. Therapie 53:467–472 [PubMed] [Google Scholar]
- 98.Wolden-Hanson T, Mitton DR, McCants RL, Yellon SM, Wilkinson WW, Matsumoto AM, Rasmussen DD. 2000. Daily melatonin administration to middle-aged male rats suppresses body weight, intraabdominal adiposity, and plasma leptin and insulin independent of food intake and total body fat. Endocrinology 141:487–497 [DOI] [PubMed] [Google Scholar]
- 99.Wu J, Dauchy RT, Tirrell PC, Wu SS, Lynch DT, Jitawatanarat P, Burrington CM, Dauchy EM, Blask DE, Greene MW. 2011. Light at night activates IGF1R/PDK1 signaling and accelerates tumor growth in human breast cancer xenografts. Cancer Res 71:2622–2631 [DOI] [PubMed] [Google Scholar]