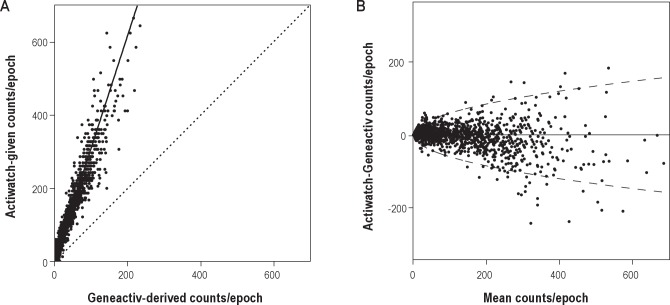
Figure 2.
(A) Scatterplot of Actiwatch-given and Geneactiv-derived counts/epoch from the distal recording of a single participant after applying the initial preprocessing steps, before matching the sensitivity of the devices according to the Passing-Bablok regression equation (solid line). The line of unity, i.e. x = y (dotted line) highlights the difference in sensitivity between Actiwatch counts and Geneactiv counts after the initial data conversion steps. (B) Bland-Altman plot of Actiwatch and Geneactiv counts/epoch after the cross-validation transfer function has been applied. The 95% limits of agreement (dashed line) were estimated using a square root regression for half-normally distributed data (± 5.99*square root(mean counts/epoch)).31

