

Abstract
The T1R1 receptor subunit acts as an umami taste receptor in combination with its partner, T1R3. In addition, metabotropic glutamate receptors (brain and taste variants of mGluR1 and mGluR4) are thought to function as umami taste receptors. To elucidate the function of T1R1 and the contribution of mGluRs to umami taste detection in vivo, we used newly developed knock-out (T1R1−/−) mice, which lack the entire coding region of the Tas1r1 gene and express mCherry in T1R1-expressing cells. Gustatory nerve recordings demonstrated that T1R1−/− mice exhibited a serious deficit in inosine monophosphate-elicited synergy but substantial residual responses to glutamate alone in both chorda tympani and glossopharyngeal nerves. Interestingly, chorda tympani nerve responses to sweeteners were smaller in T1R1−/− mice. Taste cell recordings demonstrated that many mCherry-expressing taste cells in T1R1+/− mice responded to sweet and umami compounds, whereas those in T1R1−/− mice responded to sweet stimuli. The proportion of sweet-responsive cells was smaller in T1R1−/− than in T1R1+/− mice. Single-cell RT-PCR demonstrated that some single mCherry-expressing cells expressed all three T1R subunits. Chorda tympani and glossopharyngeal nerve responses to glutamate were significantly inhibited by addition of mGluR antagonists in both T1R1−/− and T1R1+/− mice. Conditioned taste aversion tests demonstrated that both T1R1−/− and T1R1+/− mice were equally capable of discriminating glutamate from other basic taste stimuli. Avoidance conditioned to glutamate was significantly reduced by addition of mGluR antagonists. These results suggest that T1R1-expressing cells mainly contribute to umami taste synergism and partly to sweet sensitivity and that mGluRs are involved in the detection of umami compounds.
Key points
The taste receptor heterodimer T1R1 + T1R3, metabotropic glutamate receptors (mGluRs) and/or their variants may function as umami taste receptors.
Here, we used newly developed T1R1−/− mice and examined the role of T1R1 and mGluRs in taste detection.
The T1R1−/− mice exhibited seriously diminished synergistic responses to glutamate and inosine monophosphate but not to glutamate alone and significantly smaller responses to sweeteners.
Addition of mGluR antagonists significantly inhibited responses to glutamate in both T1R1−/− and heterozygous T1R1+/− mice.
Taken together, these results suggest that T1R1 mainly contributes to umami taste synergism and partly to sweet sensitivity, while mGluRs are involved in the detection of umami compounds.
Introduction
Recent molecular studies have provided evidence of candidate receptors and transduction systems for five basic tastes, namely sweet, salty, sour, bitter and umami (Niki et al. 2010). Among them, the taste receptor subunit T1R1 functions as an umami taste receptor in combination with its partner, T1R3 (Nelson et al. 2001, 2002; Li et al. 2002). In heterologous expression systems, the human T1R1 + T1R3 heterodimer is activated by glutamate, a typical umami compound (Li et al. 2002), whereas the mouse T1R1 + T1R3 is activated by various amino acids (Nelson et al. 2001). In addition, both the human and the mouse T1R1 + T1R3 show the potentiation of glutamate (amino acid) responses by addition of inosine monophosphate (IMP), which is the most characteristic feature of umami taste (Yamaguchi, 1970). A recent study has identified binding sites of human T1R1 + T1R3 for glutamate and IMP and proposed potential molecular mechanisms underlying umami taste synergism that involve the Venus flytrap domain of T1R1 (Zhang et al. 2008; Behrens et al. 2011). In humans, genetic variation of Tas1r1 (and also Tas1r3) affects the recognition threshold for umami tastants (Shigemura et al. 2009). Thus, T1R1 plays an important role in umami taste detection.
Metabotropic glutamate receptors (mGluRs) and/or their variants may also be involved in umami taste detection. A taste-specific variant of mGluR4 (taste-mGluR4), which lacks most of the N-terminal extracellular domain, was identified in circumvallate and foliate taste buds of rats (Chaudhari et al. 1996). When expressed in Chinese hamster ovary cells, this receptor responded to glutamate and the group III mGluR agonist l(+)-2-amino-4-phosphonobutyrate (l-AP4), although the affinity of taste-mGluR4 for glutamate and l-AP4 is more than 100-fold lower than that of brain-type receptors (Chaudhari et al. 1996, 2000; Yang et al. 1999). In addition, full-length mGluR1 and mGluR4 (Toyono et al. 2002, 2003) and a variant of mGluR1 (taste-mGluR1), which lacks much of the N-terminal extracellular domain (San Gabriel et al. 2005), are expressed in a subset of rat taste cells. Similar to taste-mGluR4, taste-mGluR1 has more than 100-fold lower affinity for glutamate relative to the brain-type receptor (San Gabriel et al. 2005, 2009).
Several prior reports using knock-out (KO) mouse strains support the hypothesis that multiple receptors are involved in umami taste detection. These reports demonstrated residual neural, behavioural and taste cell responses to glutamate in T1R3-KO mice (Damak et al. 2003; Delay et al. 2006; Maruyama et al. 2006). In contrast, Zhao et al. (2003) showed total loss of behavioural and neural responses to glutamate in T1R3-KO and T1R1-KO mice. To elucidate further the function of T1R1 and the contribution of mGluRs to umami taste detection in vivo, we used newly developed KO mice, which lack the entire coding region of the Tas1r1 gene and express mCherry in T1R1-expressing cells. We analysed gustatory nerve responses, responses of T1R1-expressing cells and behavioural lick responses to taste stimuli in T1R1−/− and T1R1+/− mice. We also tested whether mGluR antagonists suppress responses to glutamate in T1R1−/− and T1R1+/− mice.
Methods
Ethical approval
All experimental procedures were approved by the committee for Laboratory Animal Care and Use at Kyushu University (Japan), and the animal welfare committees of the University of Hamburg (Germany) and of the Ministry of Environment, Health and Consumer Protection of the State of Brandenburg (Germany).
Animals
Animals were adult (>8-week-old) male and female T1R1-mCherry knock-out/knock-in mice, which express a red monomeric cherry fluorescent protein (mCherry) under control of the Tas1r1 promoter. The generation and characterization of these mice are described in detail by Voigt et al. (2012). Briefly, a targeting vector was generated to replace the open reading frame of the Tas1r1 gene (Mouse Genome Informatics (MGI) accession number: 1927505) with an expression cassette consisting of a cDNA encoding the transneuronal tracer barley lectin followed by an internal ribosomal entry side and the coding sequence for mCherry. The targeting construct was electroporated into R1 mouse embryonic stem cells; correctly targeted embryonic stem cells were identified by Southern blot and injected into C57BL/6J blastocysts. Chimeric offspring were back-crossed to C57BL/6J animals for at least five generations to give T1R1-mCherry knock-in mice. Heterozygous animals (T1R1+/−) were interbred to produce homozygous offspring (T1R1−/−). The T1R1-mCherry knock-in mice carry a mixed background of 129/Sv (<3%) and C57BL/6 (>97%). To characterize T1R1-mCherry knock-in mice, in situ hybridization experiments were combined with immunohistochemistry and simultaneous expression of the wild-type (WT) and recombinant alleles was visualized in the fungiform taste bud of heterozygous T1R1+/− animals. Moreover, in situ hybridization studies on taste buds of homozygous T1R1−/− mice using riboprobes specific for Tas1r1 and mCherry demonstrated the absence of T1R1 RNA and the presence of mCherry RNA in T1R1−/− mice. In this study, T1R1+/− mice were used as littermate controls. Genotyping was performed by PCR (40 cycles of 94°C for 30 s, 60°C for 30 s and 72°C for 60 s) using purified genomic DNA as the template. Each 10 μl reaction mixture contained the following: 0.25 units of Taq DNA polymerase (TaKaRa Ex Taq™ HS; Takara, Tokyo, Japan), 1 μl of 10× PCR buffer containing 20 mm Mg2+, 0.2 mm of each dNTP, 0.5 mm of each primer pair and <100 ng of genomic DNA. Primers for the Tas1r1 WT allele were 5′-GAATCCACCTGGTTTCCATCCAC GTC-3′ and 5′-CTCTCAGGGTGACTTCAGTCTTTAGA GATGG-3′, yielding 711 bp PCR products. Primers for the Tas1r1-mCherry knock-in allele were 5′-GAAT CCACCTGGTTTCCATCCACGTC-3′ and 5′-GTTGTT GGGGCACTCCATGTTGCT-3′, yielding 462 bp PCR products. The C57BL/6N mice (>8-weeks-old; male and female) were used only in the experiments examining the effect of mGluR antagonists on taste cell responses (see Fig. 11).
Figure 11. The effect of mGluR antagonists on taste responses of M-type taste cells in mouse fungiform papillae.
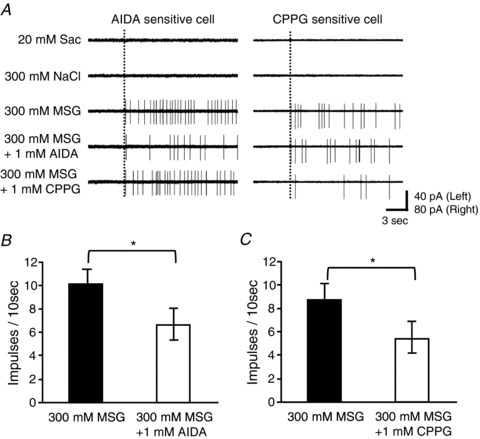
A, sample recordings of M-type taste cells in a C57BL/6N mouse showing the inhibitory effect of AIDA and CPPG. Left panel shows an AIDA-sensitive taste cell, right panel a CPPG-sensitive taste cell. Dotted lines indicate the onset of taste stimulation. B and C, summary of the effect of AIDA (B) and CPPG (C) on responses to 300 mm MSG in M-type taste cells of C57BL/6N mice. Both AIDA and CPPG significantly suppressed responses to MSG in M-type cells. Values indicated are means ± SEM (n= 5 for AIDA, n= 6 for CPPG; *P < 0.05, Student's t test).
Gustatory nerve recording
Whole-nerve responses to lingual application of tastants were recorded from the chorda tympani (CT) or the glossopharyngeal (GL) nerve as described previously (Kawai et al. 2000; Damak et al. 2003). Mice were anaesthetized with an injection of sodium pentobarbital (50–60 mg kg−1 i.p.) and maintained at a surgical level of anaesthesia with supplemental injections of sodium pentobarbital (8–10 mg kg−1 i.p. approximately every hour). The anaesthetic level was evaluated by testing the withdrawal reflex to a paw pinch. Under pentobarbital anaesthesia, the trachea of each mouse was cannulated and the mouse was then fixed in the supine position with a head holder to allow dissection of the CT or the GL nerve. The right CT nerve was dissected free from surrounding tissues after removal of the pterygoid muscle and cut at the point of its entry to the bulla. The right GL nerve was exposed by removal of the digastricus muscle and posterior horn of the hyoid bone. The GL nerve was then dissected free from underlying tissues and cut near its entrance to the posterior lacerated foramen. The entire nerve was placed on the Ag–AgCl electrode. An indifferent electrode was placed in nearby tissue. Neural activities were amplified (K-1; Iyodenshikagaku, Nagoya, Japan) and monitored on an oscilloscope and audiomonitor. Whole-nerve responses were integrated with a time constant of 1.0 s and recorded on a computer using a PowerLab system (PowerLab/sp4; AD Instruments, Bella Vista, NSW, Australia). For taste stimulation of fungiform papillae, the anterior one-half of the tongue was enclosed in a flow chamber made of silicone rubber. For taste stimulation of the circumvallate and foliate papillae, an incision was made on each side of the animal's face from the corner of the mouth to just above the angle of the jaw, and the papillae were exposed and their trenches opened by slight tension applied through a small suture sewn in the tip of the tongue. Taste solutions were delivered to each part of the tongue by gravity flow for 30 (CT) or 60 s (GL). The tongue was washed with distilled water (DW) for an interval of ∼1 min between successive stimulation. Only responses from stable recordings were used for data analysis. At the end of the experiment, animals were killed by the administration of an overdose of the anaesthetic.
Conditioned taste aversion experiments
The conditioned taste aversion (CTA) methods employed in this study were similar to those used previously (Ninomiya & Funakoshi, 1989a; Nakashima et al. 2011). Each animal, with 23 h water deprivation, was placed in a test box on day 1 of training and given free access to DW during a 1 h session. The licks were detected by a lickometer with a laser beam lick sensor (Yutaka Electronics Co., Gifu, Japan) placed between the opening and the polypropylene drinking spout and recorded on a strip chart recorder. From day 2 to 5, training session time was reduced from 1 h to 30 min. During this period, the animal was trained to drink DW on an interval schedule, consisting of 10 s periods of presentation of DW alternated with 30 s intervals. On day 6, each animal with 23 h water deprivation was given access to 300 mm monosodium glutamate (MSG) and 30 μm amiloride [conditioned stimulus (CS)] during the 10 s presentation periods of more than 20 trials. Then experimental mice were given an intraperitoneal injection of 0.24 m LiCl [230 mg kg−1; unconditioned stimulus (US)] to induce gastrointestinal malaise, whereas control mice were given an intraperitoneal injection of 0.15 m NaCl (297 mg kg−1; saline). Day 7 was a recovery period, but the training of drinking DW for 30 min was still carried out on this day. On days 8–11, CTA testing was conducted. On the first trial of the test session, the stimulus was always DW, followed by the CS on the second trial. This procedure ensured that the animal would drink water but avoid the CS. Mice that did avoid the CS were repeatedly presented with DW and each of the test stimuli in a randomized order until the mice no longer licked the DW within 7 s after the animal's first lick on a certain trial. During each trial, the number of licks by each animal for each taste solution, including the CS and DW, was counted during the first 10 s after the animal's first lick.
Taste cell recordings
Recording procedures were the same as used previously (Yoshida et al. 2006, 2009). Animals were anaesthetized with ether and killed by cervical dislocation. The anterior part of the tongue was removed and injected with 100 μl of Tyrode solution containing 0.5–1 mg ml−1 elastase (Elastin Products, Owensville, MO, USA). After incubation for 10–20 min at room temperature, the lingual epithelium was peeled and pinned out in a Sylgard-coated culture dish. Individual fungiform taste buds with a piece of surrounding epithelium were excised from this sheet, and the mucosal side was drawn into the orifice of the stimulating pipette. A gentle suction on the stimulating pipette was maintained to perfuse taste solutions and to hold the taste bud in place. Tyrode solution was always perfused inside the stimulating pipette except during the period of recording. Bath solution (Tyrode solution) was continuously flowed into the recording chamber with a peristaltic pump at approximately 2 ml min−1. The receptor membrane was rinsed with DW at least 30 s before and after taste stimulation (15–20 s). Taste bud cells containing mCherry were identified by confocal laser scanning microscopy (FV-1000; Olympus, Tokyo, Japan) and were approached by a recording electrode (inner diameter ∼1–3 μm, pipette resistances 1.5–3.5 MΩ). Seal resistances were typically 3–10 times the pipette resistances. Electrical signals were recorded by a high-impedance patch-clamp amplifier (Axopatch 200B; Axon Instruments, Foster City, CA, USA) interfaced to a computer (Windows XP) by an analog-to-digital board (Digidata 1320A; Axon Instruments). Signals were filtered at 1 kHz, sampled at 10 kHz and stored on the hard-disk drive of a computer using pCLAMP software (Gap-Free mode; Axon Instruments) for later analysis.
Solutions
In this study, solutions containing MSG were always supplemented with amiloride (30 μm) to prevent the effect of the sodium component of MSG. Test stimuli were 100 mm NH4Cl, 10–1000 mm NaCl, 10–1000 mm KCl, 0.01–10 mm HCl, 10–1000 mm sucrose, 0.1–3 mm SC45647, 3–300 mm acesulfame K, 0.1–30 mm quinine hydrochloride (QHCl), 0.01–2 mm quinine sulfate (QSO4), 0.1–20 mm denatonium, 10–1000 mm MSG with or without 0.5 mm IMP, 10–1000 mm monopotassium glutamate (MPG) with or without 0.5 mm IMP, 0.1–10 mm IMP, 20 mm saccharin (Sac), 500 mm fructose (Fru), 1000 mm sorbitol (Sorb), 500 mm glucose (Glc), 2.5 mm sucralose (Sucra), 500 mm maltose (Mal), 300 mm glycine (Gly), 500 mm l-proline (l-Pro), 300 mm d-alanine (d-Ala), 300 mm l-alanine (l-Ala), 30 mm d-tryptophan (d-Trp) and 100 mm d-phenylalanine (d-Phe). In addition, 0.1–3 mm (RS)-1-aminoindan-1,5-dicarboxylic acid (AIDA) with and without 300 mm MSG, 0.1–3 mm (RS)-α-cyclopropyl-4-phosphonophenylglycine (CPPG) with and without 300 mm MSG, the mixtures of 0.1–3 mm AIDA and CPPG with and without 300 mm MSG were used. These concentrations of antagonists were reported to affect taste responses to glutamate (Nakashima et al. 2001; Eschle et al. 2009; Yasumatsu et al. 2012). For the CTA experiment, the CS was 300 mm MSG. Tyrode solution contained 140 mm NaCl, 5 mm KCl, 1 mm CaCl2, 1 mm MgCl2, 10 mm Hepes, 10 mm glucose and 10 mm sodium pyruvate (pH adjusted to 7.4 with NaOH). The AIDA and CPPG were prepared as 40 mm stock solutions with DW and 1 m KOH to adjust pH to approximately 7.0. Other chemicals were dissolved in DW. All solutions were used at room temperature (25°C). Regents were purchased from Tocris Bioscience (Bristol, UK; AIDA and CPPG), Ajinomoto (Tokyo, Japan; IMP disodium salt), Sigma (St Louis, MO, USA; MPG and amiloride) and Wako Pure Chemical Industries (Osaka, Japan; others).
Data analysis
In the analysis of whole-nerve responses, integrated whole-nerve response magnitudes were measured 5, 10, 15, 20 and 25 s (for the CT) and 5, 10, 20, 30 and 40 s (for the GL) after stimulus onset. There values were averaged, and normalized to responses to 100 mm NH4Cl to account for mouse-to-mouse variations in absolute responses. This relative response was used for statistical analysis (two-way and three-way ANOVA and Student's unpaired t test). In the analysis of taste cell responses, action potential waveforms were analysed with respect to the following parameters: time between peak and antipeak, peak amplitude/antipeak amplitude ratio, antipeak amplitude and peak amplitude (Yoshida et al. 2006). The number of spikes per unit time was counted throughout the recording. The mean spontaneous impulse discharge for each unit was calculated by averaging the number of spikes over the 10 s period in which DW flowed over the taste pore prior to each stimulation period. The magnitude of the response to the taste stimulus was obtained by counting the total number of impulses for the first 10 s after the onset of stimulus application and subtracting the spontaneous impulse discharge. We used data from single taste cells that were defined by the following criteria: (i) the number of spikes evoked by taste stimuli was larger than the mean plus 2SD of the spontaneous discharge in two repeated trials; and (ii) at least three spikes were evoked by taste stimuli.
Two-way and three-way ANOVA and Student's unpaired t test were used to evaluate statistically the difference between genotype (T1R1+/− and T1R1−/− mice), conditioning (saline-injected and LiCl-injected groups) or concentration. Student's unpaired t test was used to evaluate statistically the effect of mGluR antagonists and the difference between T1R1+/− and T1R1−/− mice. Calculations were performed using the statistical software package IBM SPSS Statistics (IBM, Armonk, NY, USA).
Single-cell RT-PCR
The protocol for the multiplex single-cell RT-PCR was similar to those used previously (Yoshida et al. 2005, 2009). Animals were heterozygous or homozygous for the Tas1r1-mCherry allele. Peeling of the lingual epithelium was done as described for ‘Taste cell recordings’. Peeled lingual epithelium was incubated in Ca2+- and Mg2+-free solution (Ca2+ and Mg2+ in Tyrode solution were replaced by EDTA) for 5–10 min. Then, fungiform taste buds were isolated and transferred to the bottom of a culture dish containing Tyrode solution by aspiration with a transfer pipette (inner diameter approximately 100 μm). Single mCherry-expressing taste cells were identified by laser scanning microscopy, harvested by using a thin glass pipette (inner diameter 1–3 μm), transferred to a PCR tube containing 0.5 μl cell lysis buffer (BD Bioscience, Franklin Lakes, NJ, USA) and 0.5 μl RNase inhibitor (Invitrogen, Carlsbad, CA, USA) and stored at −85°C for 1–3 h. Reverse transcription (RT) and first-round amplification took place in the same tube using One Step RT-PCR kit (QIAGEN, Ratingen, Germany). A 50 μl reaction mixture contained the following: 10 μl QIAGEN OneStep RT-PCR buffer (×5), 2 μl QIAGEN One Step RT-PCR enzyme mix, 0.4 mm of each dNTP, 1 μl RNase inhibitor, 0.2–0.6 mm of each outside primer (Table 1) and the sample. After the RT reaction at 50°C for 30 min, the first-round PCR was subsequently performed in the same tube with a 15 min pre-incubation at 95°C followed by 30 cycles (94°C for 30 s, 53°C for 60 s and 72°C for 90 s) in a thermal cycler (TaKaRa PCR thermal cycler; Takara). Subsequently, the first-round PCR products were re-amplified for 35 cycles (94°C for 30 s, 60°C for 30 s and 72°C for 60 s) in separate reactions using the internal primer pairs (Table 1) for each template. The reaction mixture for the PCR was the same as that for genotyping (0.2 μl of the first-round PCR products was used as the sample). After a second amplification, reaction solutions were subjected to 2% agarose gel electrophoresis with ethidium bromide. Positive (purified RNA from a taste bud) and negative (without cell) control reactions were run in parallel. β-Actin was used as the internal control. All primer sets were designed to span exon–intron boundaries to distinguish PCR products derived from genomic DNA and mRNA.
Table 1.
Nucleotide sequences of primers used in single-cell RT-PCR experiments
| Target | Accession no. | Forward | Reverse | Size (bp) |
|---|---|---|---|---|
| T1R1 | NM_031867 | AGGGGGACCCTCTAGGTTAT | ATGATGACCAGTTGGAAGGA | 651 |
| GGTTCTGCCTCACTGTCTCC | GCAGCAGCAATAGCGTGTTA | 339 | ||
| T1R2 | NM_031873 | GCACCAAGCAAATCGTCTAT | CCAGAAGATGAGCAGAATGG | 536 |
| CTCAGGGAGATCTGGCATGT | GTGGAGGCCTATGGGTTTTT | 273 | ||
| T1R3 | NM_031872 | TGCCTGAATTTTCCCATTAT | AGGACACTGAGGCAGAAGAG | 889 |
| CTACCCTGGCAGCTCCTGGA | CAGGTGAAGTCATCTGGATGCTT | 343 | ||
| TRPM5 | NM_020277 | TTCCTGTTCATTGTGGGAGT | GACTCCTGCAACCACAGTTC | 971 |
| CTGATCGCCATGTTCAGCTA | ACTCTGTGTGCCGTTTTCCT | 335 | ||
| PLCβ2 | NM_177568 | TTTGGAGAGACCTTGCTCAC | CCATTGTCTGGAAATTGAGG | 628 |
| GGTGGAAGAGGAGGAAGAGG | CTGACATCCAGCATTCCAGA | 352 | ||
| GLAST | NM_148938 | GGTAAAATCGTGCAGGTCAC | CCACACCATTGTTCTCTTCC | 673 |
| ACATGTTCCCTCCCAATCTG | CAAGAAGAGGATGCCCAGAG | 362 | ||
| Gustducin | NM_001081143 | ACGAGATGCAAGAACTGTGA | TATCTGTCACGGCATCAAAC | 941 |
| TGCTTTGAAGGAGTGACGTG | GTAGCGCAGGTCATGTGAGA | 341 | ||
| SNAP25 | NM_011428 | AAGGGATGGACCAAATCAAT | CAATGGGGGTGACTACTCTG | 601 |
| AAAAAGCCTGGGGCAATAAT | AGCATCTTTGTTGCACGTTG | 304 | ||
| GAD67 | NM_008077 | CATTCTGGTCAAGGAAAAGG | CAGCTCTAGCAGGGAGGTAG | 986 |
| AGATAGCCCTGAGCGACGAG | ATGGCCGATGATTCTGGTTC | 240 | ||
| β-Actin | NM_007393 | CCTGAAGTACCCCATTGAAC | GTAACAGTCCGCCTAGAAGC | 943 |
| GGTTCCGATGCCCTGAGGCTC | ACTTGCGGTGCACGATGGAGG | 370 |
Upper sequences are outside primers and lower sequences inside primers. Abbreviations: GAD67, glutamate decarboxylase 67; GLAST, glutamate/aspartate transporter; PLCβ2, phospholipase C β2; SNAP25, synaptosomal-associated protein 25; T1R1 (T1R2 or T1R3), taste receptor family 1 member 1 (2 or 3); and TRPM5, transient receptor potential cation channel subfamily M member 5.
Results
Gustatory nerve responses to various taste stimuli in T1R1−/− mice
In order to assess the peripheral taste inputs directly, we recorded the responses of the CT and the GL nerves in T1R1+/− and T1R1−/− mice to the application of various taste compounds. In total, CT and GL nerve responses to any tastant were not significantly different between heterozygous T1R1+/− and wild-type (B6) mice (data not shown). In this study, we used heterozygous T1R1+/− mice as the control group. First, we focused on the responses to umami compounds, because T1R1 contributes to umami taste detection (Zhao et al. 2003). In the CT nerve, responses to umami compounds, such as MSG and MPG, alone in T1R1−/− mice tended to be weaker than those in T1R1+/− mice (Fig. 1A and C and Table 2) but were not abolished. These results are similar to previous studies in strains of mice lacking other components of umami signalling, i.e. T1R3-KO (Damak et al. 2003), α-gustducin-KO (He et al. 2004), transient receptor potential cation channel subfamily M member 5 (TRPM5)-KO (Damak et al. 2006) and inositol 1,4,5-trisphosphate receptor type 3-KO mice (Hisatsune et al. 2007). Chorda tympani nerve responses to IMP in T1R1−/− mice also tended to be weaker than those in T1R1+/− mice (Fig. 1E and Table 2), although responses themselves were very small in both types of mice (responses to IMP concentrations higher than 1 mm were significantly different from baseline nerve responses in both T1R1−/− and T1R1+/− mice). Marked differences between T1R1−/− and T1R1+/− mice were found in the synergism between MSG and IMP or MPG and IMP (Fig. 1B and D). Responses to MSG or MPG were not potentiated by addition of 0.5 mm IMP in T1R1−/− mice (two-way ANOVA, F(1,76)= 0.07, P > 0.1 for MSG; and F(1,95)= 0.03, P > 0.1 for MPG), indicating that T1R1 is indispensable for the occurrence of the synergism between glutamate and IMP. In contrast, responses to umami compounds in the GL nerve were not significantly different between T1R1−/− and T1R1+/− mice (Fig. 2 and Table 2), indicating that T1R1 does not contribute to umami taste responses in the posterior tongue.
Figure 1. Concentration–response relationships of chorda tympani (CT) nerve responses for umami taste stimuli.
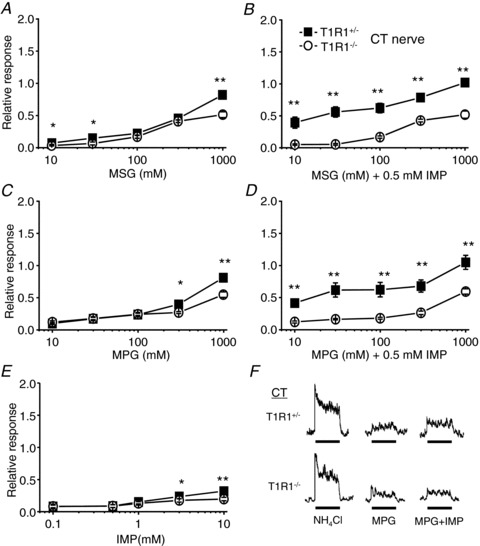
Responses to monosodium glutamate (MSG; A), MSG + 0.5 mm inosine monophosphate (IMP; B), monopotassium glutamate (MPG; C), MPG + 0.5 mm IMP (D) and IMP (E) in T1R1+/− (filled rectangles; n= 5–10) and T1R1−/− mice (open circles; n= 5–16) are shown. Chorda tympani nerve responses were normalized to the response to 100 mm NH4Cl. Values indicated are means ± SEM. Statistical differences were analysed by two-way ANOVA tests (see Table 2) and Student's t test (*P < 0.05, **P < 0.01). F, sample recordings of CT nerve responses to 100 mm NH4Cl, 100 mm MPG and 100 mm MPG + 0.5 mm IMP in T1R1+/− (top traces) and T1R1−/− mice (bottom traces). Bars indicate taste stimulation (30 s).
Table 2.
Two-way ANOVA results for CT and GL nerve responses to taste compounds (T1R1−/− vs. T1R1+/− mice)
| CT nerve | GL nerve | |||
|---|---|---|---|---|
| Tastant | Degrees of freedom | F value | Degrees of freedom | F value |
| MSG | 1,84 | 35.5*** | 1,95 | 0.2 |
| Interaction | 4,84 | 6.9*** | 4,95 | 0.1 |
| MSG + IMP | 1,81 | 134.5*** | 1,95 | 0.0 |
| Interaction | 4,81 | 0.0 | 4,95 | 0.2 |
| MPG | 1,100 | 15.2*** | 1,72 | 0.0 |
| Interaction | 4,100 | 7.0*** | 4,72 | 0.4 |
| MPG + IMP | 1,81 | 61.6*** | 1,59 | 1.1 |
| Interaction | 4,81 | 0.2 | 4,59 | 0.2 |
| IMP | 1,56 | 6.6* | 1,48 | 0.0 |
| Interaction | 4,56 | 1.8 | 4,48 | 0.0 |
| NaCl | 1,71 | 0.3 | 1,66 | 0.2 |
| Interaction | 4,71 | 0.1 | 4,66 | 0.1 |
| KCl | 1,71 | 0.1 | 1,47 | 0.0 |
| Interaction | 4,71 | 0.2 | 4,47 | 0.0 |
| HCl | 1,82 | 0.2 | 1,79 | 0.2 |
| Interaction | 4,82 | 0.0 | 4,79 | 0.2 |
| Sucrose | 1,80 | 23.8*** | 1,93 | 0.1 |
| Interaction | 5,80 | 2.9* | 5,93 | 0.0 |
| SC45647 | 1,59 | 8.8** | 1,54 | 0.0 |
| Interaction | 3,59 | 0.2 | 3,54 | 0.0 |
| Acesulfame K | 1,50 | 7.2* | 1,98 | 0.0 |
| Interaction | 4,50 | 0.6 | 4,98 | 0.1 |
| QHCl | 1,97 | 0.6 | 1,85 | 0.0 |
| Interaction | 6,97 | 0.1 | 6,85 | 0.1 |
| QSO4 | 1,66 | 0.4 | 1,55 | 0.0 |
| Interaction | 3,66 | 0.1 | 3,55 | 0.0 |
| Denatonium | 1,63 | 0.5 | 1,48 | 0.0 |
| Interaction | 3,63 | 0.4 | 3,48 | 0.1 |
The effects of genotype were analysed by two-way ANOVA. The table is based on data shown in Figs 1–4. Top numbers for each chemical relate to the main effect (genotype) and bottom numbers to the interaction effect (genotype × concentration). *P < 0.05, **P < 0.01, ***P < 0.001, ANOVA. Abbreviations: CT, chorda tympani; GL, glossopharyngeal; IMP, inosine monophosphate; MPG, monopotassium glutamate; MSG, monosodium glutamate; QHCl, quinine hydrocholoride; and QSO4, quinine sulfate.
Figure 2. Concentration–response relationships of glossopharyngeal (GL) nerve responses for umami taste stimuli.
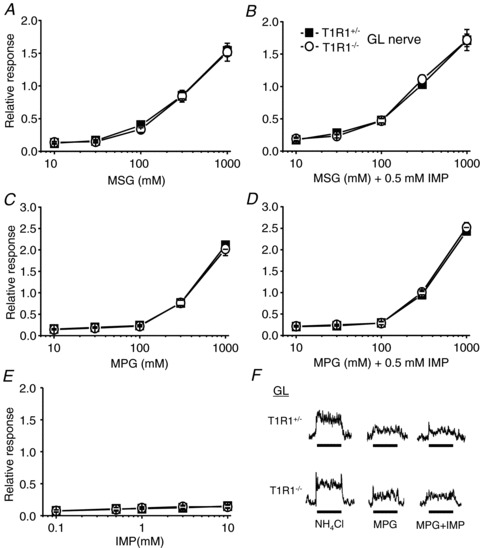
Responses to MSG (A), MSG + 0.5 mm IMP (B), MPG (C), MPG + 0.5 mm IMP (D) and IMP (E) in T1R1+/− (filled rectangles; n= 5–13) and T1R1−/− mice (open circles; n= 5–14) are shown. Glossopharyngeal nerve responses were normalized to the response to 100 mm NH4Cl. Values indicated are means ± SEM. There were no statistically significant differences in two-way ANOVA tests (see Table 2). F, sample recordings of GL nerve responses to 100 mm NH4Cl, 100 mm MPG and 100 mm MPG + 0.5 mm IMP in T1R1+/− (top traces) and T1R1−/− mice (bottom traces). Bars indicate taste stimulation (60 s).
Next, we analysed CT and GL nerve responses to various taste stimuli (Figs 3–5 and Table 2). Chorda tympani nerve responses to salty, sour and bitter compounds (NaCl, KCl, HCl, QHCl, QSO4 and denatonium) and GL nerve responses to all tastants tested were not significantly different between T1R1−/− and T1R1+/− mice (two-way ANOVA test, P > 0.05; Table 2). Interestingly, CT nerve responses to sweeteners, such as sucrose, SC45647 and acesulfame K, in T1R1−/− mice were significantly smaller than those in T1R1+/− mice (Fig. 3 and Table 2; two-way ANOVA test, P < 0.05; Student's t test, *P < 0.05, **P < 0.01). Likewise, CT nerve responses to some other sweeteners, such as saccharin, fructose, sucralose, glycine, l-alanine and d-tryptophan, were significantly smaller in T1R1−/− than in T1R1+/− mice (Student's t test, *P < 0.05, **P < 0.01; Fig. 5A). These results suggest that T1R1 may play a role in the detection of sweet compounds in the anterior tongue.
Figure 5. Gustatory nerve responses to various sweeteners in T1R1+/− and T1R1−/− mice.
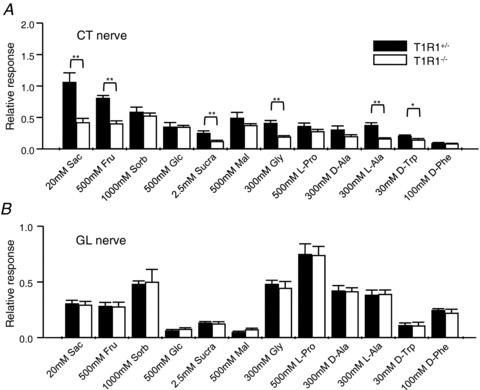
Chorda tympani (A) and glossopharyngeal nerve responses (B) to 20 mm saccharin (Sac), 500 mm fructose (Fru), 1000 mm sorbitol (Sorb), 500 mm glucose (Glc), 2.5 mm sucralose (Sucra), 500 mm maltose (Mal), 300 mm glycine (Gly), 500 mm l-proline (l-Pro), 300 mm d-alanine (d-Ala), 300 mm l-alanine (l-Ala), 30 mm d-tryptophan (d Trp) and 100 mm d-phenylalanine (d-Phe) in T1R1+/− (filled columns; n= 5–13) and T1R1−/− mice (open columns; n= 5–14). Gustatory nerve responses were normalized to the response to 100 mm NH4Cl. Values indicated are means ± SEM. *P < 0.05, **P < 0.01, Student's t test.
Figure 3. Concentration–response relationships of CT nerve responses for various taste stimuli.
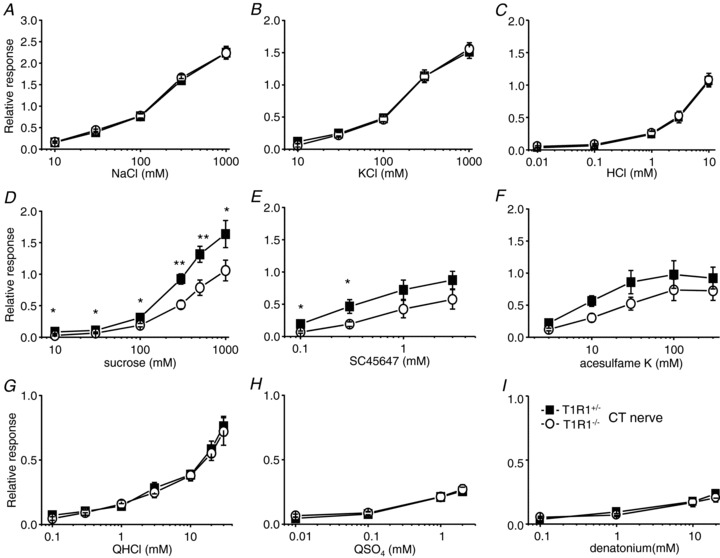
Responses to NaCl (A), KCl (B), HCl (C), sucrose (D), SC45647 (E), acesulfame K (F), quinine hydrochloride (QHCl; G), quinine sulfate (QSO4; H) and denatonium (I) in T1R1+/− (filled rectangles; n= 5–12) and T1R1−/− mice (open circles; n= 6–16) are shown. Chorda tympani nerve responses were normalized to the response to 100 mm NH4Cl. Values indicated are means ± SEM. Statistical differences were analysed by two-way ANOVA tests (see Table 2) and Student's t test (*P < 0.05, **P < 0.01).
Figure 4. Concentration–response relationships of GL nerve responses for various taste stimuli.
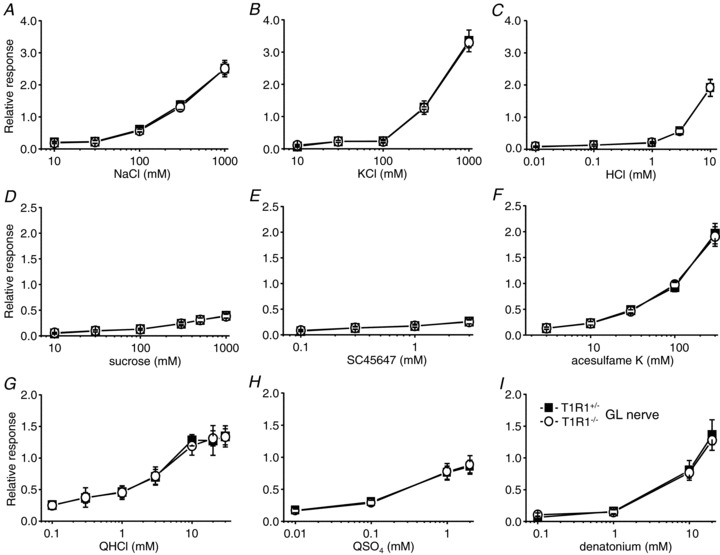
Responses to NaCl (A), KCl (B), HCl (C), sucrose (D), SC45647 (E), acesulfame K (F), QHCl (G), QSO4 (H) and denatonium (I) in T1R1+/− (filled rectangles; n= 5–13) and T1R1−/− mice (open circles; n= 5–13) are shown. Glossopharyngeal nerve responses were normalized to the response to 100 mm NH4Cl. Values indicated are means ± SEM. There were no statistically significant differences in two-way ANOVA tests (see Table 2).
Taste response profiles of primary T1R1-expressing cells
The taste receptor heterodimer T1R1 + T1R3 functions as an umami taste receptor; therefore, T1R1-expressing cells should respond to umami taste stimuli. However, response profiles of primary T1R1-expressing cells have not yet been described. To address this question, we used T1R1+/− animals that carry one Tas1r1 WT and one Tas1r1-mCherry allele and thus express mCherry in T1R1-expressing cells. We used fungiform taste cells because clear mCherry expression was observed in fungiform taste buds but not in circumvallate taste buds, similar to the previous reports showing that T1R1 is predominantly expressed in the fungiform but not other types of taste papillae (Hoon et al. 1999; Nelson et al. 2001). First, we recorded taste responses to five basic taste stimuli from mCherry-positive cells. Sample recordings (Fig. 6A) showed that the mCherry-expressing cell in a T1R1+/− mouse did not only respond to umami tastants but also to sweeteners. In total, we applied five basic taste stimuli (NaCl, HCl, QHCl, saccharin, sucrose, MSG, and MSG + IMP) to 102 mCherry-expressing cells in T1R1+/− mice. Twenty-four cells (23%) showed responses to one or more taste stimuli (Fig. 6C). Among 24 responsive cells, 19 cells responded best to saccharin or sucrose, and five cells responded best to MSG or MSG + IMP. Thus, many T1R1-expressing cells responded to sweet taste stimuli. Eighteen cells responded to MSG or MSG + IMP, but six cells did not. Among 18 umami-sensitive cells, 16 cells showed stronger responses to MSG + IMP than to MSG alone, indicating that responses to MSG were potentiated by the addition of IMP in most T1R1-expressing cells.
Figure 6. Taste responses of mCherry-expressing cells in fungiform taste buds.
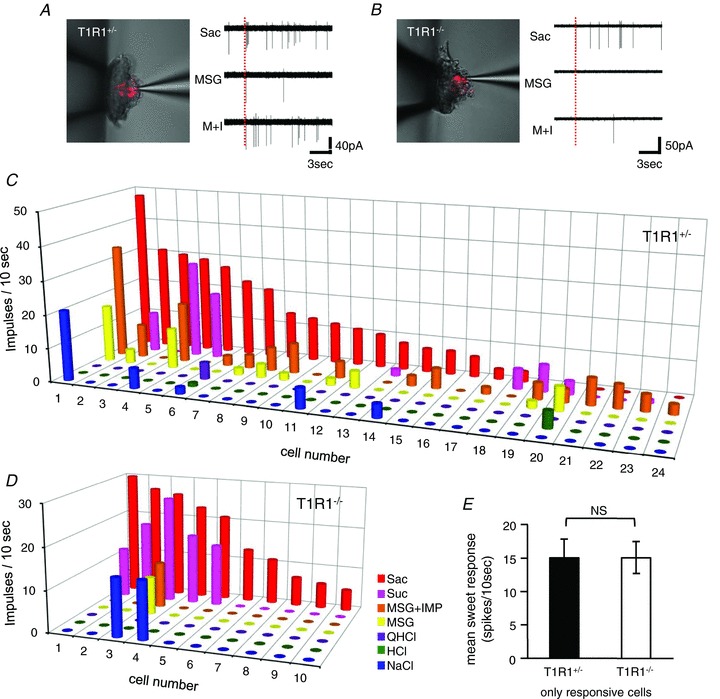
A and B show sample recordings from an mCherry-expressing taste cell of a T1R1+/− mouse (A) and a T1R1−/− mouse (B). Taste responses to 20 mm saccharin (Sac), 300 mm monosodium glutamate (MSG) and 300 mm MSG + 0.5 mm inosine monophosphate (M + I) are shown. Dotted lines indicate the onset of taste stimulation. C and D, response profiles of mCherry-expressing taste cells in T1R1+/− (C) and T1R1−/− mice (D). Taste responses are shown for each taste cell to 300 mm NaCl (NaCl; blue), 10 mm HCl (HCl; green), 20 mm quinine hydrochloride (QHCl; purple), 300 mm monosodium glutamate (MSG; yellow), 300 mm MSG + 0.5 mm inosine monophosphate (MSG + IMP; orange), 500 mm sucrose (Suc; magenta) and 20 mm saccharin (Sac; red). E, mean sweet response of responsive mCherry-expressing taste cells in T1R1+/− (filled column; n= 10) and T1R1−/− mice (open column; n= 20). When the cell responded to both saccharin and sucrose, the averaged response was used to calculate the mean response. Values indicated are means ± SEM. NS, P > 0.1, Student's t test.
Next, we examined taste responses of mCherry-expressing cells in homozygous T1R1−/− mice that carry two Tas1r1-mCherry alleles and thus do not express T1R1. Sample recordings (Fig. 6B) showed that this mCherry-expressing cell in the T1R1−/− mouse did not respond to umami tastants but still responded to sweeteners, although one spike is visible with MSG + IMP. In total, we applied five basic taste stimuli to 122 mCherry-expressing cells in T1R1−/− mice, and only 10 cells (8%) responded to one or more taste stimuli (Fig. 6D). These 10 cells responded best to sweeteners, and only one cell showed responses to MSG and MSG + IMP. The proportion of sweet-responsive cells was smaller in T1R1−/− (10/122; 8%) than in T1R1+/− mice (20/102; 20%). The mean sweet response of responsive cells in T1R1−/− mice was not significantly different from that in T1R1+/− mice (Fig. 6E; Student's t test, P > 0.1). Notably, mean spontaneous firing rate of mCherry-expressing cells in T1R1+/− (0.72 ± 0.16 spikes (10 s)-1) and T1R1−/− mice (0.73 ± 0.13 spikes (10 s)-1) is not significantly different, suggesting that the excitability of mCherry-expressing cells may be similar between T1R1+/− and T1R1−/− mice. These results suggest that knock-out of the Tas1r1 gene does not only affect umami taste responses but also affects sweet taste responses in T1R1-expressing cells. The reduction of sweet response of mCherry-expressing cells in T1R1−/− mice may account for the diminished CT nerve responses to sweeteners in T1R1−/− mice.
Expression of T1Rs in T1R1-expressing taste cells
Many T1R1-expressing cells responded to both umami and sweet taste stimuli (Fig. 6C). These data raise the possibility that these cells might express not only umami taste receptors, T1R1 + T1R3, but also sweet taste receptors, T1R2 + T1R3 (Nelson et al. 2001; Zhao et al. 2003). To test this hypothesis, we examined the expression of T1Rs in T1R1-expressing cells using single-cell RT-PCR. Single mCherry-expressing cells in the fungiform papillae were collected from T1R1+/− mice and subjected to multiplex RT-PCR to examine the expression of T1R1, T1R2, T1R3, TRPM5, phospholipase C β2 (PLCβ2), glutamate/aspartate transporter (GLAST), gustducin, synaptosomal-associated protein 25 (SNAP25) and glutamate decarboxylase 67 (GAD67; Fig. 7A and B). Among 21 mCherry-expressing cells in T1R1+/− mice, T1R2 and/or T1R3 was detected in nine (43%) or 12 cells (57%), respectively. Most T1R1-expressing cells expressed PLCβ2 (20 cells; 95%) and gustducin (21 cells; 100%). TRPM5 was detected in one-half of the T1R1-expressing cells (11 cells; 52%). In contrast, GLAST (a type I cell marker), SNAP25 and GAD67 (type III cell markers) were not detected in T1R1-expressing cells. We also examined expression of these genes in GAD67-expressing cells (type III cells) using the same method and confirmed that T1Rs and type I and type II cell markers were not detected in GAD67-expressing cells (Fig. S1). Although some false-negative results (loss of detection of some genes) may be included in these results, we found that at least seven of 21 cells tested co-expressed all T1Rs. These cells are capable of responding to both sweet and umami taste stimuli. Similar results (except for the expression of T1R1) were obtained from mCherry-expressing cells in T1R1−/− mice (P < 0.001 for T1R1; P > 0.1 for others; χ2 test; Fig. 7C).
Figure 7. Gene expression analysis of mCherry-expressing cells in fungiform papillae of T1R1+/− and T1R1−/− mice by single-cell RT-PCR.
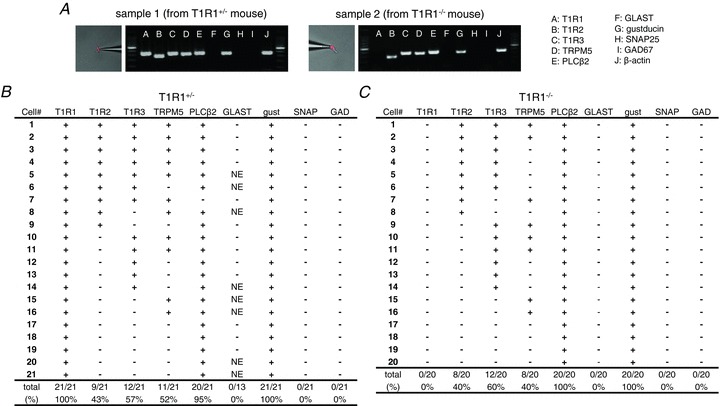
A, examples of single-cell RT-PCR from typical profiled cells. After harvesting single mCherry-expressing taste cells (left pictures), gene expression was analysed by multiplex single-cell RT-PCR (right pictures). Positive and negative control reactions were always run in parallel with reactions with samples (Fig. S1). B and C, summarized data from 21 and 20 mCherry-expressing cells in T1R1+/− (B) and T1R1−/− mice (C), respectively. Each row represents a single cell, and each column represents a different gene as indicated. A plus sign denotes that RT-PCR product was detected, and a minus sign denotes the lack of expression. NE denotes that expression was not examined.
Inhibition of taste responses to MSG by mGluR antagonists
Gustatory nerve responses to umami compounds were not abolished in T1R1−/− mice; in particular, GL nerve responses to umami compounds were not affected by the deletion of the Tas1r1 gene (Figs 1 and 2). Residual responses to glutamate in these animals may be mediated by T1R1-independent receptor systems, such as mGluRs. We therefore tested the effects of antagonists of mGluR1 (AIDA; group I mGluR antagonist) and mGluR4 (CPPG; group III mGluR antagonist) on MSG responses of the CT and GL nerve. We previously demonstrated that all types of glutamate-sensitive fibres did not respond to AIDA or CPPG alone up to 10 mm (Yasumatsu et al. 2012), indicating that AIDA or CPPG itself did not activate these glutamate-sensitive gustatory nerve fibres. In both CT and GL nerves of T1R1−/− and T1R1+/− mice, AIDA, CPPG and the mixture of AIDA and CPPG suppressed responses to 300 mm MSG in a dose-dependent manner (Fig. 8). At the highest concentration of antagonists (3 mm), responses to 300 mm MSG were reduced to 50–80% of control responses. Suppression of MSG responses of the CT and GL nerve by mGluR antagonists seemed more pronounced in T1R1−/− mice than in T1R1+/− mice, although these effects on CT nerve responses were not significantly different between T1R1−/− and T1R1+/− mice in ANOVA tests (Table 3). Chorda tympani nerve responses to other taste stimuli (NaCl, HCl, quinine and sucrose) in T1R1+/− mice were not affected by 0.3 and 3 mm AIDA and CPPG (Fig. 8G and H).
Figure 8. The effect of metabotropic glutamate receptor (mGluR) antagonists on gustatory nerve responses to MSG.
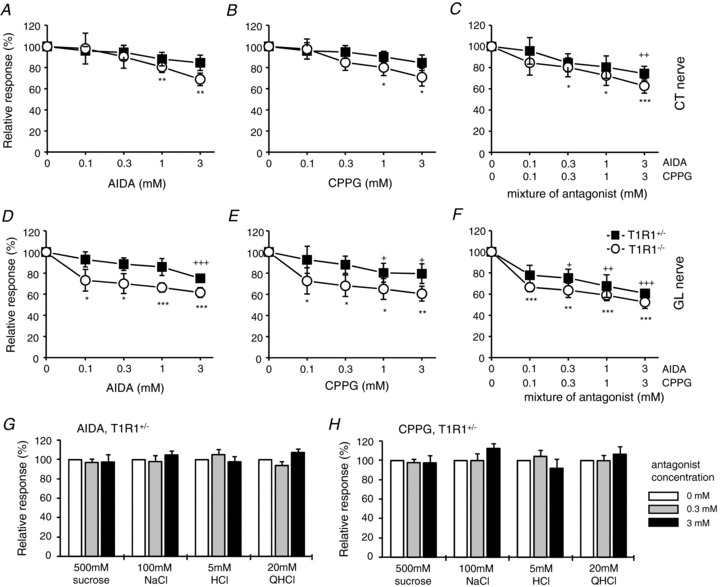
The effect of (RS)-1-aminoindan-1,5-dicarboxylic acid (AIDA; A and D), (RS)-α-cyclopropyl-4- phosphonophenylglycine (CPPG; B and E) and a mixture of AIDA and CPPG (C and F) on CT (A–C) and GL nerve responses (D–F) of T1R1+/− (filled rectangles; n= 4–10) and T1R1−/− mice (open circles; n= 4–10) to 300 mm MSG. Values indicated are means ± SEM. Statistical differences between T1R1+/− and T1R1−/− mice were analysed by two-way ANOVA tests (see Table 3) and Student's t test [no significant differences (P > 0.05) at all concentrations]. Statistical differences from control (0 mm antagonist) were analysed by Student's t test (+P < 0.05, ++P < 0.01, +++P < 0.001 for T1R1+/− mice; *P < 0.05, **P < 0.01, ***P < 0.001 for T1R1−/− mice). The effect of AIDA (G) and CPPG (H) on CT nerve responses to 500 mm sucrose, 100 mm NaCl, 5 mm HCl and 20 mm QHCl in T1R1+/− mice. There is no significant difference between the conditions with and without antagonists (n= 5–7, P > 0.05, Student's t test).
Table 3.
Two-way ANOVA results for CT and GL nerve responses to 300 mm MSG with various concentrations of mGluR antagonists (T1R1−/− vs. T1R1+/− mice)
| CT nerve | GL nerve | |||
|---|---|---|---|---|
| Antagonist | Degrees of freedom | F value | Degrees of freedom | F value |
| AIDA | 1,47 | 1.1 | 1,56 | 17.2*** |
| Interaction | 4,47 | 0.4 | 4,56 | 1.5 |
| CPPG | 1,45 | 2.3 | 1,50 | 6.7* |
| Interaction | 4,45 | 0.4 | 4,50 | 0.4 |
| AIDA + CPPG | 1,57 | 1.8 | 1,57 | 6.6* |
| Interaction | 4,57 | 0.1 | 4,57 | 0.7 |
The effects of genotype were analysed by two-way ANOVA. The table is based on data shown in Fig. 8. Top numbers for each chemical relate to the main effect (genotype) and bottom numbers to the interaction effect (genotype × concentration). *P < 0.05, ***P < 0.001, ANOVA. Abbreviations: AIDA, (RS)-1-aminoindan-1,5-dicarboxylic acid; CPPG, (RS)-α-cyclopropyl-4- phosphonophenylglycine; CT, chorda tympani; GL, glossopharyngeal; mGluR, metabotropic glutamate receptor; and MSG, monosodium glutamate.
We further tested the effect of mGluR antagonists by behavioural tests. Using a CTA protocol, we conditioned T1R1−/− and T1R1+/− mice to avoid 300 mm MSG. These conditioned mice (LiCl-injected group) avoided drinking 300 mm MSG, to which non-conditioned mice (saline-injected group) did not show any avoidance (Fig. 9). These learned aversions were not generalized to sucrose, NaCl, HCl and quinine, indicating that both T1R1−/− and T1R1+/− mice were able to discriminate between the taste of MSG and other tastants. The sensitivity to the taste of MSG might be lower in T1R1−/− mice than in T1R1+/− mice because the numbers of licks for low concentrations of MSG is greater in LiCl injected T1R1−/− mice than in LiCl injected T1R1+/− mice (Fig. 9 and Tables 4 and 5). In any case, T1R1−/− mice were still able to sense the taste of MSG. Using these conditioned mice, we tested the effect of mGluR antagonists on lick responses to 300 mm MSG. In both T1R1−/− and T1R1+/− conditioned (LiCl-injected) animals, addition of AIDA, CPPG and the mixture of AIDA and CPPG increased lick responses to 300 mm MSG in a concentration-dependent manner (Fig. 10). The effect of mGluR antagonists on lick responses to 300 mm MSG was stronger in T1R1−/− mice than in T1R1+/− mice (Tables 4 and 5).
Figure 9. Short-term (10 s) lick responses after aversive conditioning to 300 mm MSG.

Lick responses to MSG (A), sucrose (B), NaCl (C), HCl (D) and QHCl (E) in LiCl-injected (circles) and saline-injected groups (rectangles) of T1R1+/− (filled symbols; n= 5–7) and T1R1−/− mice (open symbols; n= 5). Values indicated are means ± SD. Statistical differences were analysed by ANOVA tests (see Tables 4 and 5) and Student's t test. Asterisks indicate significant differences between T1R1+/− and T1R1−/− mice in the LiCl-injected group (*P < 0.05, **P < 0.01, Student's t test).
Table 4.
Three-way ANOVA results for lick responses to taste compounds
| Genotype | Conditioning | Concentration | ||||
|---|---|---|---|---|---|---|
| Tastant | Degrees of freedom | F value | Degrees of freedom | F value | Degrees of freedom | F value |
| MSG | 1,133 | 16*** | 1,133 | 1087*** | 6,133 | 487*** |
| Sucrose | 1,108 | 6.1* | 1,108 | 0.5 | 5,108 | 2.1 |
| NaCl | 1,126 | 6.0* | 1,126 | 3.5 | 6,126 | 595*** |
| HCl | 1,95 | 3.1 | 1,95 | 5.3* | 4,95 | 468*** |
| QHCl | 1,95 | 1.1 | 1,95 | 1.1 | 4,95 | 608*** |
| CS + AIDA | 1,76 | 10.2** | 1,76 | 997*** | 3,76 | 11.0*** |
| CS + CPPG | 1,76 | 12.3** | 1,76 | 637*** | 3,76 | 6.2** |
| CS + AIDA + CPPG | 1,76 | 31.7*** | 1,76 | 1134*** | 3,76 | 46.9*** |
The effects of genotype (T1R1+/− vs. T1R1−/−), conditioning (saline vs. LiCl) and concentration were analysed by three-way ANOVA. The table is based on data shown in Figs 9 and 10. *P < 0.05, **P < 0.01, ***P < 0.001, ANOVA. Interactions were significantly different in genotype × conditioning and conditioning × concentration for MSG, CS + AIDA, CS + CPPG and CS + AIDA + CPPG (genotype × conditioning for CS + CPPG, P < 0.05; others, P < 0.001; ANOVA). Abbreviations: AIDA, (RS)-1-aminoindan-1,5-dicarboxylic acid; CPPG, (RS)-α-cyclopropyl-4- phosphonophenylglycine; CS, conditioned stimulus; MSG, monosodium glutamate; and QHCl, quinine hydrocholoride.
Table 5.
Two-way ANOVA results for lick responses to taste compounds
| T1R1+/−, saline vs. LiCl | T1R1−/−, saline vs. LiCl | LiCl injection, T1R1+/− vs. T1R1−/− | Saline injection, T1R1+/− vs. T1R1−/− | |||||
|---|---|---|---|---|---|---|---|---|
| Tastant | Degrees of freedom | F value | Degrees of freedom | F value | Degrees of freedom | F value | Degrees of freedom | F value |
| MSG | 1,77 | 1131*** | 1,55 | 258*** | 1,70 | 25.5*** | 1,63 | 0.0 |
| Interaction | 6,77 | 105.9*** | 6,55 | 38.9*** | 6,70 | 1.8 | 6.63 | 1.5 |
| Sucrose | 1,60 | 0.16 | 1,48 | 0.4 | 1,60 | 3.8 | 1,48 | 2.5 |
| Interaction | 5,60 | 0.9 | 5,48 | 0.6 | 5,60 | 0.1 | 5,48 | 0.3 |
| NaCl | 1,70 | 1.1 | 1,56 | 2.7 | 1,70 | 2.5 | 1,56 | 3.4 |
| Interaction | 6,70 | 0.3 | 6.56 | 2.5* | 6,70 | 2.3* | 6.56 | 0.2 |
| HCl | 1,55 | 3.5 | 1,40 | 2.1 | 1,50 | 1.6 | 1,45 | 2.0 |
| Interaction | 4.55 | 0.9 | 4,40 | 0.5 | 4,50 | 0.1 | 4,45 | 1.3 |
| QHCl | 1,55 | 3.8 | 1,40 | 0.1 | 1,50 | 2.8 | 1,45 | 0.1 |
| Interaction | 4,55 | 0.1 | 4,40 | 0.8 | 4,50 | 0.9 | 4,45 | 1.9 |
| CS + AIDA | 1,44 | 1716*** | 1,32 | 190*** | 1,40 | 15.8*** | 1,36 | 0.5 |
| Interaction | 3,44 | 14.9*** | 3,32 | 4.5** | 3,40 | 0.2 | 3,36 | 0.6 |
| CS + CPPG | 1,44 | 2526*** | 1,32 | 108*** | 1,40 | 10.5** | 1,36 | 3.4 |
| Interaction | 3,44 | 24.6*** | 3,32 | 3.1* | 3,40 | 0.0 | 3,36 | 3.9* |
| CS + AIDA + CPPG | 1,44 | 1299*** | 1,32 | 249*** | 1,40 | 36.1*** | 1,36 | 0.7 |
| Interaction | 3,44 | 32.8*** | 3,32 | 15.1*** | 3,40 | 1.4 | 3,36 | 3.4* |
The effects of genotype (T1R1+/− vs. T1R1−/−) or conditioning (saline vs. LiCl) were analysed by two-way ANOVA. The table is based on data shown in Figs 9 and 10. Top numbers for each chemical relate to the main effect (genotype or conditioning) and bottom numbers to the interaction effect (genotype × concentration or conditioning × concentration). *P < 0.05, **P < 0.01, ***P < 0.001, ANOVA. Abbreviations are as for Table 4.
Figure 10. The effect of mGluR antagonists on lick responses to MSG.

Lick responses to 300 mm MSG with AIDA (A), CPPG (B) and AIDA + CPPG (C) in LiCl-injected (circles) and saline-injected groups (rectangles) of T1R1+/− (filled symbols; n= 6–7) and T1R1−/− mice (open symbols, n= 5). Values indicated are means ± SD. Statistical differences were analysed by ANOVA tests (see Tables 4 and 5) and Student's t test. Asterisks indicate significant differences between T1R1+/− and T1R1−/− mice in the LiCl-injected group (*P < 0.05, **P < 0.01, Student's t test).
In addition, we examined the effect of mGluR antagonists on taste cell responses. A recent study demonstrated that responses of MPG-best (M-type) CT fibres to glutamate were suppressed by addition of AIDA and CPPG (Yasumatsu et al. 2012). Using C57BL/6N mice, we randomly recorded taste responses from taste bud cells, searched for M-type taste cells and examined the effect of 1 mm AIDA or CPPG on responses to 300 mm MSG in M-type taste cells (Fig. 11). Addition of AIDA or CPPG inhibited responses to 300 mm MSG in some M-type taste cells. In summary, AIDA and CPPG significantly suppressed MSG responses of M-type taste cells (Fig. 11B and C; Student's t test, P < 0.05). These results suggest that mGluRs may function as umami taste receptors. The T1R1−/− mice might be able to sense the taste of MSG via mGluR receptors.
Discussion
The T1R1 taste receptor subunit acts as an umami taste receptor in combination with its partner, T1R3 (Nelson et al. 2001, 2002; Li et al. 2002). We demonstrated that mice lacking the entire Tas1r1 coding region showed reduced responses to glutamate (MSG and MPG) and severe loss of synergistic responses to glutamate and IMP in the CT nerve but not in the GL nerve (Figs 1 and 2). This is not consistent with a previous study using T1R1-KO and T1R3-KO mice showing complete loss of umami taste responses (Zhang et al. 2003), but similar to studies conducted by other groups using T1R3-KO mice (Damak et al. 2003; Delay et al. 2006). What might account for these differences? First, the strains of mice might differ in some important way; second, the techniques as carried out by each group differ; and third, the WT controls differ. In any case, the synergism between glutamate and IMP was considerably reduced in the anterior tongue of T1R1-KO (and T1R3-KO) mice. Recent studies demonstrated that the Venus fly trap domain of T1R1 is important for umami taste synergism (Zhang et al. 2008; Behrens et al. 2011). Thus, the T1R1 + T1R3 heterodimer would be the taste receptor particularly responsible for umami taste synergism. These studies also suggested the existence of separate binding sites for glutamate and the enhancers, such as IMP, within the same T1R1 Venus fly trap domain. Consistent with these reports, our study demonstrated that CT nerve responses to glutamate alone and IMP alone were also reduced in T1R1−/− mice, suggesting that the T1R1 + T1R3 heterodimer contributes to reception of glutamate and IMP in the anterior part of the tongue. However, GL nerve responses to umami compounds were not affected by deletion of the coding region of the Tas1r1 gene, and synergism between glutamate and IMP was observed but very small in the GL nerve. This may be due to a low expression level of T1R1 in the circumvallate taste buds (Hoon et al. 1999; Nelson 2001). We also confirmed low-level expression of mCherry in circumvallate taste buds of T1R1−/− and T1R1+/− mice. Therefore, T1R1 + T1R3 may not be a major umami receptor in the posterior part of the tongue.
The CT and GL nerve responses to MSG in both T1R1−/− and T1R1+/− mice were suppressed by addition of AIDA and CPPG (Fig. 8). In addition, lick responses to MSG in conditioned animals were increased by addition of AIDA and CPPG (Fig. 10). These neural and behavioural responses to MSG were elicited at high concentrations (1–1000 mm) and inhibited by high concentrations of antagonists (0.1–3 mm). Previous studies also reported that high concentrations (0.1–1 mm) of AIDA and CPPG inhibited taste cell responses, gustatory nerve responses and behavioural responses to glutamate (Lin & Kinnamon, 1999; Nakashima et al. 2001; Eschle et al. 2009; Yasumatsu et al. 2012). Therefore, we speculate that low-affinity types of mGluRs, namely the taste-type mGluR1 and mGluR4 (Chaudhari et al. 1996, 2000; San Gabriel et al. 2005, 2009), may be involved in umami taste detection. A recent study demonstrated that umami-sensitive CT nerve fibres in WT mice can be classified into two major groups, namely sucrose-best (S-type) and MPG-best (M-type), and each group can be further subdivided into two subtypes, with (S1- and M1-type) or without umami synergism (S2- and M2-type; Yasumatsu et al., 2012). Among them, responses of M1- or M2-type fibres to glutamate were inhibited by AIDA or CPPG, respectively, indicating that these fibres receive input from mGluR-expressing taste cells. At the taste-cell level, glutamate-sensitive taste cells were also classified into S1-, S2-, M1- and M2-types (Niki et al. 2011). In the present study, we found that AIDA or CPPG inhibits MSG responses in several M-type cells (Fig. 11), suggesting that these M-type cells transmit glutamate signals to M1- or M2-type gustatory nerve fibres. In addition, AIDA and CPPG are likely to suppress responses to MSG in the different set of M-type taste cells (Fig. 11), suggesting that taste cells expressing taste-mGluR1 may be different from those expressing taste-mGluR4. We also found that some mCherry-expressing cells in T1R1+/− mice showed M-type responses (Fig. 6C; cells 21–24), whereas mCherry-expressing cells in T1R1−/− mice did not show M-type responses (Fig. 6D). Therefore, MSG responses in some M-type cells may be mediated by T1R1 + T1R3 but not mGluRs. Taken together, these results suggest that glutamate-specific M-type responses may be mediated by both a T1R1-dependent pathway and an independent pathway; however, further studies are needed to address these points.
In addition to the reduction of umami taste responses, CT nerve responses to sweeteners were also reduced by deletion of the Tas1r1 gene, although Zhao et al. (2003) did not observe any reduction of sweet responses in their T1R1-KO mice. This was surprising because T1R1 forms the umami taste receptor in combination with T1R3 (Nelson et al. 2001, 2002; Li et al. 2002). We found that many mCherry-expressing cells in T1R1+/− mice responded to both sweet and umami tastants (Fig. 6C). This response profile is very similar to that of S1-type CT nerve fibres, which are absent in T1R3-KO mice (Yasumatsu et al. 2012). In T1R1−/− mice, mCherry-expressing cells still showed responses to sweeteners but did not respond to umami taste stimuli. The mean response of mCherry-expressing cells to sweeteners was lower in T1R1−/− mice, possibly because of the reduction of responsive cells in T1R1−/− mice. These results suggest that the responsiveness of T1R1-expressing cells to sweet taste stimuli was reduced by deletion of the Tas1r1 gene. The T1R1-expressing cells that respond to both sweet and umami taste stimuli may express both umami (T1R1 + T1R3) and sweet (T1R2 + T1R3) taste receptors (Nelson et al. 2001; Li et al. 2002). Indeed, some T1R1-expressing cells possess all three T1Rs (Fig. 7B), and similar results have been demonstrated in mouse circumvallate taste buds (Dando et al. 2012). Even though T1R1 is eliminated, T1R2 + T1R3 would be present (Fig. 7C) and function in these cells. Therefore, sweet taste responses mediated by T1R2 + T1R3 are not affected. In addition, the proportion of mCherry-expressing cells that expressed both T1R2 and T1R3 was not altered by deletion of the Tas1R1 gene (33% in T1R1+/− and 30% in T1R1−/−; Fig. 7B and C). Based on these data, we speculate that several mechanisms might account for the reduction of sweet responses in T1R1−/− mice, as follows: (i) sweet compounds may activate the umami taste receptor (T1R1 + T1R3) or a T1R1 homomer, although Li et al. (2002) did not observe any binding of sweeteners to human or rat T1R1 + T1R3 in a heterologous expression system; (ii) T1R1 may form a heteromer with T1R2, which may be activated by both sweet and umami compounds; (iii) expression of all T1R subunits may enhance lipid raft localization by receptor accessory protein 2, REEP2 (Ilegems et al. 2010); (iv) expression of T1R2, T1R3 or some other transduction component, such as gustducin (Wong et al. 1996), PLCβ2 or TRPM5 (Zhang et al. 2003), may be affected in T1R1−/− mice, although different expression patterns of these transduction components between T1R1+/− and T1R1−/− mice was not observed in our single-cell RT-PCR experiments (Fig. 7); and (v) excess expression of mCherry may be cytotoxic (Strack et al. 2008) and reduce responsiveness of mCherry-expressing cells in T1R1−/− mice, although some reports have demonstrated no toxic effect of mCherry expression (Fink et al. 2010; Sheridan et al. 2011) and we showed no significant difference in spontaneous firing activities of mCherry-expressing cells between T1R1+/− and T1R1−/− mice. Future experiments are necessary to reveal why sweet taste responses are reduced in T1R1−/− mice.
It was reported that rats conditioned to avoid MSG + amiloride showed generalization to sucrose (Yamamoto et al. 1991; Heyer et al. 2003), suggesting that the taste of glutamate mimics the taste of sucrose. However, we did not observe such generalization in both T1R1+/− and T1R1−/− mice (Fig. 9). The previous study (Sato et al. 1970) demonstrated that many S-type fibres that responded best to sucrose and showed large synergism between glutamate and nucleotides exist in the CT nerve of rats. Glossopharyngeal nerve responses to glutamate in rats were very small (Sako et al. 2000) compared with those in mice. In addition, rats with a combined transection of the CT and greater superficial petrosal nerves were not able to acquire CTAs to umami substances with amiloride (Sako et al. 2000). Taken together, these data suggest that rats mainly use information of glutamate taste from the CT nerve, which may contain many S-type fibres, but not from the GL nerve to perceive taste of glutamate. This may be a possible reason why rats generalize the taste of sucrose and glutamate. In mice, both the CT and the GL nerve may contain glutamate-specific M-type fibres, because AIDA and CPPG, which affected M-type but not other types of fibres (Yasumatsu et al. 2012), suppressed both CT and GL nerve responses to glutamate (Fig. 8). Furthermore, a previous study demonstrated the existence of M-type fibres in the GL nerve of mice (Ninomya & Funakoshi, 1989b). These glutamate-specific inputs, especially from the GL nerve, may give mice the ability to discriminate the tastes of sucrose and glutamate. However, further studies are required to explain why the taste of sucrose and glutamate is generalized in rats but not in mice.
Conclusion
In conclusion, we analysed the function of T1R1 in vivo using newly developed T1R1−/− mice that lack the entire coding region of the Tas1r1 gene. The T1R1−/− mice showed reduced responses to glutamate and severe loss of umami synergism in the CT nerve, suggesting that T1R1 + T1R3 functions as a glutamate receptor and is important for inducing umami synergism in the anterior part of the tongue. Residual responses to glutamate were suppressed by mGluR antagonists, suggesting that mGluRs may also be involved in umami taste detection. Furthermore, we found a reduction of sweet taste responses in T1R1−/− mice.
Acknowledgments
This work was supported by KAKENHI 18109013, 18077004, 23249081 (Y.N.) and 23689076 (R.Y.) for Scientific Research from the Japan Society for the Promotion of Science and a research grant by the Deutsche Forschungsgemeinschaft (BO1743/2 to U.B.).
Glossary
- AIDA
(RS)-1-aminoindan-1,5-dicarboxylic acid
- CPPG
(RS)-α-cyclopropyl-4- phosphonophenylglycine
- CS
conditioned stimulus
- CT
chorda tympani
- CTA
conditioned taste aversion
- DW
distilled water
- GAD67
glutamate decarboxylase 67
- GL
glossopharyngeal
- GLAST
glutamate/aspartate transporter
- IMP
inosine monophosphate
- KO
knock-out
- l-AP4
l(+)-2-amino-4-phosphonobutyrate
- mGluR
metabotropic glutamate receptor
- MPG
monopotassium glutamate
- MSG
monosodium glutamate
- PLCβ2
phospholipase C β2
- QHCl
quinine hydrocholoride
- QSO4
quinine sulfate
- SNAP25
synaptosomal-associated protein 25
- T1R1 (T1R2 or T1R3)
taste receptor family 1 member 1 (2 or 3)
- TRPM5
transient receptor potential cation channel subfamily M member 5
- US
unconditioned stimulus
- WT
wild-type
Author contributions
Y.N. conceived and designed the experiments. Y.K., R.Y., T.O., K.Y., U.B., A.V. and S.H. performed the experiments. Y.K., R.Y., K.M., W.M. and Y.N. analysed the data. A.V., U.B. and W.M. contributed reagents/materials/analysis tools. Y.K., R.Y., U.B., W.M. and Y.N. wrote the paper. All authors approved the final version of the manuscript.
Author's present address
Ulrich Boehm: Department of Pharmacology and Toxicology, University of Saarland School of Medicine, Homburg, Germany.
References
- Behrens M, Meyerhof W, Hellfritsch C, Hofmann T. Sweet and umami taste: natural products, their chemosensory targets, and beyond. Angew Chem Int Ed Engl. 2011;50:2220–2242. doi: 10.1002/anie.201002094. [DOI] [PubMed] [Google Scholar]
- Chaudhari N, Landin AM, Roper SD. A metabotropic glutamate receptor variant functions as a taste receptor. Nature Neurosci. 2000;3:113–119. doi: 10.1038/72053. [DOI] [PubMed] [Google Scholar]
- Chaudhari N, Yang H, Lamp C, Delay E, Cartford C, Than T, Roper SD. The taste of monosodium glutamate: membrane receptors in taste buds. J Neurosci. 1996;16:3817–3826. doi: 10.1523/JNEUROSCI.16-12-03817.1996. [DOI] [PMC free article] [PubMed] [Google Scholar]
- Damak S, Rong M, Yasumatsu K, Kokrashvili Z, Pérez CA, Shigemura N, Yoshida R, Mosinger B, Jr, Glendinning JI, Ninomiya Y, Margolskee RF. Trpm5 null mice respond to bitter, sweet, and umami compounds. Chem Senses. 2006;31:253–264. doi: 10.1093/chemse/bjj027. [DOI] [PubMed] [Google Scholar]
- Damak S, Rong M, Yasumatsu K, Kokrashvili Z, Varadarajan V, Zou S, Jiang P, Ninomiya Y, Margolskee RF. Detection of sweet and umami taste in the absence of taste receptor T1R3. Science. 2003;301:850–853. doi: 10.1126/science.1087155. [DOI] [PubMed] [Google Scholar]
- Dando R, Dvoryanchikov G, Pereira E, Chaudhari N, Roper SD. Adenosine enhances sweet taste through A2B receptors in the taste bud. J Neurosci. 2012;32:322–330. doi: 10.1523/JNEUROSCI.4070-11.2012. [DOI] [PMC free article] [PubMed] [Google Scholar]
- Delay ER, Hernandez NP, Bromley K, Margolskee RF. Sucrose and monosodium glutamate taste thresholds and discrimination ability of T1R3 knockout mice. Chem Senses. 2006;31:351–357. doi: 10.1093/chemse/bjj039. [DOI] [PubMed] [Google Scholar]
- Eschle BK, Eddy MC, Delay ER. Antagonism of metabotropic glutamate receptor 4 receptors by (RS)-α-cyclopropyl-4-phosphonophenylglycine alters the taste of amino acids in rats. Neuroscience. 2009;163:1292–1301. doi: 10.1016/j.neuroscience.2009.07.035. [DOI] [PubMed] [Google Scholar]
- Fink D, Wohrer S, Pfeffer M, Tombe T, Ong CJ, Sorensen PH. Ubiquitous expression of the monomeric red fluorescent protein mCherry in transgenic mice. Genesis. 2010;48:723–729. doi: 10.1002/dvg.20677. [DOI] [PubMed] [Google Scholar]
- He W, Yasumatsu K, Varadarajan V, Yamada A, Lem J, Ninomiya Y, Margolskee RF, Damak S. Umami taste responses are mediated by α-transducin and α-gustducin. J Neurosci. 2004;24:7674–7680. doi: 10.1523/JNEUROSCI.2441-04.2004. [DOI] [PMC free article] [PubMed] [Google Scholar]
- Heyer BR, Taylor-Burds CC, Tran LH, Delay ER. Monosodium glutamate and sweet taste: generalization of conditioned taste aversion between glutamate and sweet stimuli in rats. Chem Senses. 2003;28:631–641. doi: 10.1093/chemse/bjg056. [DOI] [PubMed] [Google Scholar]
- Hisatsune C, Yasumatsu K, Takahashi-Iwanaga H, Ogawa N, Kuroda Y, Yoshida R, Ninomiya Y, Mikoshiba K. Abnormal taste perception in mice lacking the type 3 inositol 1,4,5-trisphosphate receptor. J Biol Chem. 2007;282:37225–37231. doi: 10.1074/jbc.M705641200. [DOI] [PubMed] [Google Scholar]
- Hoon MA, Adler E, Lindemeier J, Battey JF, Ryba NJ, Zuker CS. Putative mammalian taste receptors: a class of taste-specific GPCRs with distinct topographic selectivity. Cell. 1999;96:541–551. doi: 10.1016/s0092-8674(00)80658-3. [DOI] [PubMed] [Google Scholar]
- Ilegems E, Iwatsuki K, Kokrashvili Z, Benard O, Ninomiya Y, Margolskee RF. REEP2 enhances sweet receptor function by recruitment to lipid rafts. J Neurosci. 2010;30:13774–13783. doi: 10.1523/JNEUROSCI.0091-10.2010. [DOI] [PMC free article] [PubMed] [Google Scholar]
- Kawai K, Sugimoto K, Nakashima K, Miura H, Ninomiya Y. Leptin as a modulator of sweet taste sensitivities in mice. Proc Natl Acad Sci U S A. 2000;97:11044–11049. doi: 10.1073/pnas.190066697. [DOI] [PMC free article] [PubMed] [Google Scholar]
- Li X, Staszewski L, Xu H, Durick K, Zoller M, Adler E. Human receptors for sweet and umami taste. Proc Natl Acad Sci U S A. 2002;99:4692–4696. doi: 10.1073/pnas.072090199. [DOI] [PMC free article] [PubMed] [Google Scholar]
- Lin W, Kinnamon SC. Physiological evidence for ionotropic and metabotropic glutamate receptors in rat taste cells. J Neurophysiol. 1999;82:2061–2069. doi: 10.1152/jn.1999.82.5.2061. [DOI] [PubMed] [Google Scholar]
- Maruyama Y, Pereira E, Margolskee RF, Chaudhari N, Roper SD. Umami responses in mouse taste cells indicate more than one receptor. J Neurosci. 2006;26:2227–2234. doi: 10.1523/JNEUROSCI.4329-05.2006. [DOI] [PMC free article] [PubMed] [Google Scholar]
- Nakashima K, Eddy MC, Katsukawa H, Delay ER, Ninomiya Y. Behavioral responses to glutamate receptor agonists and antagonists implicate the involvement of brain-expressed mGluR4 and mGluR1 in taste transduction for umami in mice. Physiol Behav. 2011;105:709–719. doi: 10.1016/j.physbeh.2011.09.028. [DOI] [PubMed] [Google Scholar]
- Nakashima K, Katsukawa H, Sasamoto K, Ninomiya Y. Behavioral taste similarities and differences among monosodium L-glutamate and glutamate receptor agonists in C57BL mice. J Nutr Sci Vitaminol. 2001;47:161–166. doi: 10.3177/jnsv.47.161. [DOI] [PubMed] [Google Scholar]
- Nelson G, Chandrashekar J, Hoon MA, Feng L, Zhao G, Ryba NJ, Zuker CS. An amino-acid taste receptor. Nature. 2002;416:199–202. doi: 10.1038/nature726. [DOI] [PubMed] [Google Scholar]
- Nelson G, Hoon MA, Chandrashekar J, Zhang Y, Ryba NJ, Zuker CS. Mammalian sweet taste receptors. Cell. 2001;106:381–390. doi: 10.1016/s0092-8674(01)00451-2. [DOI] [PubMed] [Google Scholar]
- Niki M, Takai S, Kusuhara Y, Ninomiya Y, Yoshida R. Responses to apical and basolateral application of glutamate in mouse fungiform taste cells with action potentials. Cell Mol Neurobiol. 2011;31:1033–1040. doi: 10.1007/s10571-011-9702-5. [DOI] [PMC free article] [PubMed] [Google Scholar]
- Niki M, Yoshida R, Takai S, Ninomiya Y. Gustatory signaling in the periphery: detection, transmission, and modulation of taste information. Biol Pharm Bull. 2010;33:1772–1777. doi: 10.1248/bpb.33.1772. [DOI] [PubMed] [Google Scholar]
- Ninomiya Y, Funakoshi M. Behavioral discriminati-on between glutamate and the four basic taste substances in mice. Comp Biochem Physiol A Comp Physiol. 1989a;92:365–370. doi: 10.1016/0300-9629(89)90577-x. [DOI] [PubMed] [Google Scholar]
- Ninomiya Y, Funakoshi M. Peripheral neural basis for behavioural discrimination between glutamate and the four basic taste substances in mice. Comp Biochem Physiol A Comp Physiol. 1989b;92:371–376. doi: 10.1016/0300-9629(89)90578-1. [DOI] [PubMed] [Google Scholar]
- Sako N, Harada S, Yamamoto T. Gustatory information of umami substances in three major taste nerves. Physiol Behav. 2000;71:193–198. doi: 10.1016/s0031-9384(00)00342-5. [DOI] [PubMed] [Google Scholar]
- San Gabriel A, Maekawa T, Uneyama H, Torii K. Metabotropic glutamate receptor type 1 in taste tissue. Am J Clin Nutr. 2009;90:743S–746S. doi: 10.3945/ajcn.2009.27462I. [DOI] [PubMed] [Google Scholar]
- San Gabriel A, Uneyama H, Yoshie S, Torii K. Cloning and characterization of a novel mGluR1 variant from vallate papillae that functions as a receptor for l-glutamate stimuli. Chem Senses. 2005;30:i25–i26. doi: 10.1093/chemse/bjh095. [DOI] [PubMed] [Google Scholar]
- Sato M, Yamashita S, Ogawa H. Potentiation of gustatory response to monosodium glutamate in rat chorda tympani fibers by addition of 5′-ribonucleotides. Jpn J Physiol. 1970;20:444–464. doi: 10.2170/jjphysiol.20.444. [DOI] [PubMed] [Google Scholar]
- Sheridan JT, Worthington EN, Yu K, Gabriel SE, Hartzell HC, Tarran R. Characterization of the oligomeric structure of the Ca2+-activated Cl− channel Ano1/TMEM16A. J Biol Chem. 2011;286:1381–1388. doi: 10.1074/jbc.M110.174847. [DOI] [PMC free article] [PubMed] [Google Scholar]
- Shigemura N, Shirosaki S, Sanematsu K, Yoshida R, Ninomiya Y. Genetic and molecular basis of individual differences in human umami taste perception. PLoS ONE. 2009;4:e6717. doi: 10.1371/journal.pone.0006717. [DOI] [PMC free article] [PubMed] [Google Scholar]
- Strack RL, Strongin DE, Bhattacharyya D, Tao W, Berman A, Broxmeyer HE, Keenan RJ, Glick BS. A noncytotoxic DsRed variant for whole-cell labeling. Nat Methods. 2008;5:955–957. doi: 10.1038/nmeth.1264. [DOI] [PMC free article] [PubMed] [Google Scholar]
- Toyono T, Seta Y, Kataoka S, Harada H, Morotomi T, Kawano S, Shigemoto R, Toyoshima K. Expression of the metabotropic glutamate receptor, mGluR4a, in the taste hairs of taste buds in rat gustatory papillae. Arch Histol Cytol. 2002;65:91–96. doi: 10.1679/aohc.65.91. [DOI] [PubMed] [Google Scholar]
- Toyono T, Seta Y, Kataoka S, Kawano S, Shigemoto R, Toyoshima K. Expression of metabotropic glutamate receptor group I in rat gustatory papillae. Cell Tissue Res. 2003;313:29–35. doi: 10.1007/s00441-003-0740-2. [DOI] [PubMed] [Google Scholar]
- Voigt A, Hübner S, Lossow K, Hermans-Borgmeyer I, Boehm U, Meyerhof W. Genetic labeling of Tas1r1 and Tas2r131 taste receptor cells in mice. Chem Senses. 2012;37:897–911. doi: 10.1093/chemse/bjs082. [DOI] [PubMed] [Google Scholar]
- Wong GT, Gannon KS, Margolskee RF. Transduction of bitter and sweet taste by gustducin. Nature. 1996;381:796–800. doi: 10.1038/381796a0. [DOI] [PubMed] [Google Scholar]
- Yamaguchi S. The synergistic taste effect of monosodium glutamate and disodium 5′-inosinate. J Food Sci. 1970;32:473–478. [Google Scholar]
- Yamamoto T, Matsuo R, Fujimoto Y, Fukunaga I, Miyasaka A, Imoto T. Electrophysiological and behavioral studies on the taste of umami substances in the rat. Physiol Behav. 1991;49:919–925. doi: 10.1016/0031-9384(91)90204-2. [DOI] [PubMed] [Google Scholar]
- Yang H, Wanner IB, Roper SD, Chaudhari N. An optimized method for in situ hybridization with signal amplification that allows the detection of rare mRNAs. J Histochem Cytochem. 1999;47:431–446. doi: 10.1177/002215549904700402. [DOI] [PubMed] [Google Scholar]
- Yasumatsu K, Ogiwara Y, Takai S, Yoshida R, Iwatsuki K, Torii K, Margolskee RF, Ninomiya Y. Umami taste in mice uses multiple receptors and transduction pathways. J Physiol. 2012;590:1155–1170. doi: 10.1113/jphysiol.2011.211920. [DOI] [PMC free article] [PubMed] [Google Scholar]
- Yoshida R, Miyauchi A, Yasuo T, Jyotaki M, Murata Y, Yasumatsu K, Shigemura N, Yanagawa Y, Obata K, Ueno H, Margolskee RF, Ninomiya Y. Discrimination of taste qualities among mouse fungiform taste bud cells. J Physiol. 2009;587:4425–4439. doi: 10.1113/jphysiol.2009.175075. [DOI] [PMC free article] [PubMed] [Google Scholar]
- Yoshida R, Sanematsu K, Shigemura N, Yasumatsu K, Ninomiya Y. Taste receptor cells responding with action potentials to taste stimuli and their molecular expression of taste related genes. Chem Senses. 2005;30:i19–i20. doi: 10.1093/chemse/bjh092. [DOI] [PubMed] [Google Scholar]
- Yoshida R, Shigemura N, Sanematsu K, Yasumatsu K, Ishizuka S, Ninomiya Y. Taste responsiveness of fungiform taste cells with action potentials. J Neurophysiol. 2006;96:3088–3095. doi: 10.1152/jn.00409.2006. [DOI] [PubMed] [Google Scholar]
- Zhang F, Klebansky B, Fine RM, Xu H, Pronin A, Liu H, Tachdjian C, Li X. Molecular mechanism for the umami taste synergism. Proc Natl Acad Sci U S A. 2008;105:20930–20934. doi: 10.1073/pnas.0810174106. [DOI] [PMC free article] [PubMed] [Google Scholar]
- Zhang Y, Hoon MA, Chandrashekar J, Mueller KL, Cook B, Wu D, Zuker CS, Ryba NJ. Coding of sweet, bitter, and umami tastes: different receptor cells sharing similar signaling pathways. Cell. 2003;112:293–301. doi: 10.1016/s0092-8674(03)00071-0. [DOI] [PubMed] [Google Scholar]
- Zhao GQ, Zhang Y, Hoon MA, Chandrashekar J, Erlenbach I, Ryba NJ, Zuker CS. The receptors for mammalian sweet and umami taste. Cell. 2003;115:255–266. doi: 10.1016/s0092-8674(03)00844-4. [DOI] [PubMed] [Google Scholar]