

Abstract
PARACEST (PARAmagnetic Chemical Exchange Saturation Transfer) agents offer the ability to generate “contrast on demand”, negating the need to image before contrast agent injection. Perfluorocarbon (PFC) nanoparticles can deliver very large payloads of PARACEST agents, lowering the effective detection limit for molecular imaging of sparse biomarkers. Also, the PFC core provides a quantitative 19F signal for measuring particle binding with high signal intensity and no background signal. 19F quantization coupled with mathematical modeling of the PARACEST signal showed that incorporating PARACEST chelates onto the nanoparticle surface reduces the bound water lifetime and diminishes the available contrast to noise ratio compared to the parent small molecule PARACEST chelate. PARACEST nanoparticles were targeted to fibrin, an early biomarker for atherosclerotic plaque rupture, and bound to the surface of in vitro clots, 2 yielding a detection limit of 2.30 nM at 11.7T. When the particles bind to a target surface the image contrast is higher than predicted from phantom experiments, perhaps due to improved water exchange kinetics. We have demonstrated that PARACEST PFC nanoparticles can provide two unique signatures, 19F and PARACEST, for quantitative targeted molecular imaging of fibrin.
Keywords: PARACEST, fluorine, nanoparticle, fibrin
INTRODUCTION
PARACEST (PARAmagnetic Chemical Exchange Saturation Transfer) agents offer an advantage over other paramagnetic or superparamagnetic MRI contrast agents due to the ability to selectively turn the contrast on and off “on demand” (1). This capability is especially valuable in molecular imaging applications, where the contrast agent targets biological receptors that are expressed at very low concentrations. Definitive identification of standard MRI agents, such as Gd3+ chelates and iron oxide particles, can be difficult because of innate variations in proton relaxation times within the body. The sparse molecular targets often result in only minimal changes in the proton signal intensity, requiring imaging before and after injection of the contrast agent to accurately 0 localize accumulation. However, utilizing PARACEST agents with negligible relaxivities, such as Eu3+ chelates, the image contrast can be turned on and off by adjusting the pulse sequence parameters (1), allowing detection of contrast agent binding at a single imaging timepoint. This novel mechanism minimizes the delay between the acquisition of baseline and contrast-enhanced images, allowing detection of the agent by image subtraction without the need for spatial registration of images acquired hours or days apart.
The main disadvantage of PARACEST agents, however, is the lack of sensitivity, which greatly hinders the ability to image molecular targets. For instance, the most sensitive PARACEST chelate to date, Yb3+-DOTAM, exhibits a threshold of detection of 0.5 mM at 7T (2). One method of increasing the sensitivity of PARACEST agents is to incorporate a multiplicity of metal chelates into a macromolecular scaffold. With this approach, polymer and dendrimer agents have been synthesized, which display detection limits in the μM range (2-5). In a similar fashion, we have reported the use of perfluorocarbon (PFC) nanoparticles in the first targeted PARACEST imaging application (6). This first generation PARACEST nanoparticle agent, however, introduced a large cationic charge on the particle surface. Cationic particles can cause significant in vivo toxicity and are not suitable for biomedical applications.
Perfluorocarbon nanoparticles have several advantages over other particulate structures, including prolonged circulatory half-life and large surface area to volume ratio, which permits loading of numerous copies of the imaging agent (typically tens of thousands) and targeting molecule (typically hundreds) on each particle. In addition, the perfluorocarbon core of these nanoparticles can be exploited for 19F MRI, yielding a quantitative signature with high signal intensity and no background signal from biological tissues (7). The combination of PARACEST and quantitative 19F imaging could be used to corroborate identification of the targeted biomarkers. In conjunction with mathematical modeling of PARACEST signals, PARACEST and 19F imaging could also provide valuable insight into the water exchange kinetics that are vital for the design and testing of more effective PARACEST agents.
Fibrin is an abundant component of thrombi and an early marker of ruptured atherosclerotic plaques, which are the major cause of myocardial ischemia and stroke. Identification of fibrin could help detect ruptured plaques and direct therapeutic interventions to prevent or ameliorate the consequences of a heart attack or stroke. Currently, there is no clinical method that can noninvasively detect fibrin deposition. Molecular imaging with highly sensitive and molecularly targeted MRI agents could provide serial and anatomical identification of plaque rupture and monitoring of 1 therapeutic efficacy.
In this study, a neutral lipid-conjugated PARACEST chelate was incorporated onto the surface of PFC nanoparticles and the surface charge (i.e., zeta potential) and PARACEST contrast of the resulting agent was evaluated. The water exchange kinetics of the parent small molecule PARACEST chelate and the PARACEST nanoparticles were compared. Fibrin-targeted PARACEST particles were applied to in vitro clots to demonstrate molecular imaging with both PARACEST and 19F MRI. Quantification of the nanoparticles bound to the clot surface allowed estimation of the bound water lifetime, which may permit further optimization of the chemical structure and exchange kinetics for improved molecular imaging sensitivity.
MATERIALS AND METHODS
Chelate synthesis and nanoparticle formulation
A water soluble PARACEST chelate based on the 1,4,7,10-tetraaza macrocycle was synthesized with a benzyl moiety on one pendent arm (Macrocyclics, Dallas, TX), forming Eu3+-DOTA-4AMC-benzyl (Fig. 1, Left). PARACEST z-spectra were acquired from this chelate at 11.7 T (Inova, Varian, Inc., Palo Alto, CA). Addition of the benzyl group provided a conjugation site to couple a lipophilic pendant, phosphatidylethanolamine (Avanti Polar Lipids, Inc., Alabaster, AL), to the PARACEST chelate through a thiourea linkage, forming Eu3+-DOTA-4AMC-benzyl-PE (Fig. 1, Right). Lipid-conjugation is required for incorporating the chelate onto the surface of perfluorocarbon nanoparticles.
Figure 1.
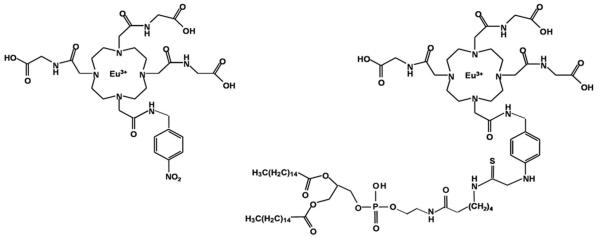
The chemical structures of the water soluble PARACEST chelate (Left), Eu3+-DOTA-4AMC-benzyl, and the lipid-conjugated PARACEST chelate (Right), Eu3+-DOTA-4AMC-benzyl-PE, that was incorporated onto the nanoparticle surface.
Fibrin-targeted PARACEST perfluorocarbon nanoparticles were prepared as described previously (8,9). In brief, the nanoparticles were formulated by emulsifying 20% (v/v) perfluorooctyl bromide (PFOB, Minnesota Manufacturing and Mining, St. Paul, MN), 2% (w/v) surfactant comixture, 2% (v/v) glycerol and water for the balance in a Microfluidizer M-110S processor (Microfluidics Corp., Newton, MA) for 4 min at 17,000 psi. The PARACEST nanoparticle surfactant was comprised of purified egg phosphatidylcholine (Avanti Polar Lipids, Inc.), biotinyl-cap-phosphatidylethanolamine (Avanti Polar Lipids Inc.), and Eu3+-DOTA-4AMC-benzyl-PE at a molar ratio of 69:1:30, respectively.
Particle size, using quasi-elastic light scattering, and zeta potential, based on an electrophoretic light-scattering/laser Doppler velocimetry method, were measured in deionized water at 25°C with a Brookhaven ZetaPlus analyzer (Brookhaven Instrument Corp., Holtsville, NY). The europium content of the emulsion was determined with standard inductively coupled plasma mass spectroscopy (ICP-MS, West Coast Analytical Service, Inc., Santa Fe Springs, CA).
PARACEST Z-Spectrum acquisition
The water soluble PARACEST chelate, Eu3+-DOTA-4AMC-benzyl, was diluted in deionized water to the same Eu3+ concentration as the PARACEST nanoparticle formulation, 3.33 mM. Z-spectra of both the water soluble chelate and nanoparticles were acquired on a 11.7 T Varian Inova horizontal bore scanner using a custom-built single-turn solenoid coil at room temperature and a pH of 7. Proton spectra were collected using a 2 second presaturation pulse of 15.4 μT, applied at frequencies ranging from −80 to 100 ppm in 1 ppm increments. The bulk water peak was integrated and plotted against the presaturation offset frequency to form the Z-spectrum. T1 and T2 relaxation times were measured based on spectra acquired with an inversion recovery sequence (11 inversion times from 12.5 ms to 16 s) or spin echo sequence (12 echo times from 1 ms to 5 s), respectively. The relaxation data was fitted to standard exponential recovery and decay equations with MATLAB 7.0 (The MathWorks, Inc., Natick, MA).
Mathematical modeling
PARACEST contrast relies on the chemical exchange of protons between two different environments or “pools”: bulk water (pool A) and bound water (pool B). This chemical exchange transfers the X, Y, and Z magnetizations (MX, MY, MZ) from one pool to another. The Bloch equations can be modified for chemical exchange (10) and reorganized as a general ordinary differential equation (ODE) in the form of dM/dt=A*M+B (Equation 1).
| Equation 1. |
where ; ; ; ; T1 and T2 (in seconds) are the longitudinal and transversal relaxation times; MZ0 is the thermal equilibrium Z magnetization; CA is the exchange rate (in 1/second) for the free water leaving pool A and entering pool B, and vice versa forCB; ωA and ωB (in Hz) are the Larmor frequencies of pool A and B; ω and ω1 (in Hz) indicate the RF irradiation frequency and power, respectively; and mass balance requires .
These equations were solved analytically with MATLAB 7.0. Utilizing the known experimental conditions, including presaturation duration, RF power, chemical shifts and relaxation times, Z spectra were fitted with a constrained nonlinear optimization routine in MATLAB 7.0 to determine the bound water lifetime for the water soluble and nanoparticle agents. In addition, these equations were used to model PARACEST Z-spectra over a range of bound water lifetime values.
Preparation of fibrin clots and quantification phantoms
Fibrin clots were prepared as described previously (6). Briefly, fresh dog plasma was combined with 100 mM calcium chloride (3:1 v/v) and 5 U thrombin around a 4-0 silk suture inside a 5-mm-diameter plastic mold. Targeted clots (n=4) were serially incubated with 1.0 nmol of biotinylated anti-fibrin antibodies (1H10) overnight at 4°C, followed by 0.76 nmol of avidin for 1 hr at 25°C, and then 28.5 pmol of PARACEST nanoparticles for 1 hr at 25°C to complete the binding. The clots were rinsed three times with sterile saline after each incubation step to remove unbound reactants. Control clots (n=4) were not incubated with nanoparticles. The pH of each clot was adjusted to 7 using HCl or NaOH.
A quantification phantom was constructed from PARACEST nanoparticles diluted to concentrations of 1.8, 3.6, 7.1, 14.2, 28.5 and 56.9 nM (corresponding to Eu3+ concentrations of 0.053, 0.105, 0.208, 0.415, 0.834 and 1.66 mM). The pH of each dilution was adjusted to 7 and 100 μL of each was placed in small vials surrounded by phosphate buffered saline (PBS).
PARACEST and 19F MRI
PARACEST and 19F images were acquired of the quantification phantom and the clots with a 11.7 T Varian Inova horizontal bore scanner using a custom-built single-turn solenoid coil that can be manually tuned to either the proton frequency (500 MHz) or the fluorine frequency (470 MHz).
PARACEST images were obtained using a gradient echo sequence with a 2 second presaturation RF pulse (15.4 μT) at a resolution of 187.5 μm by 187.5 μm by 4.0 mm, with TR = 2.01 second, TE = 2.5 millisecond, 12 mm by 12 mm field of view, 64 by 64 matrix, 4 signal averages, and an imaging time of 8 minutes and 35 seconds. This sequence was repeated two times (once with presaturation at 51 ppm and once with presaturation at −51 ppm), yielding a total PARACEST imaging time of 17 minutes and 10 seconds. 19F imaging was performed on the same imaging slice using a spin echo sequence with identical resolution as the PARACEST sequence, TR = 1 second, TE = 9 milliseconds, and 32 signal averages to achieve the same imaging time of 17 minutes and 10 seconds. The frequency of the 19F imaging pulses was centered on the CF3 peak of PFOB, based on 19F spectra collected before each imaging experiment. The bandwidth of the excitation and refocusing pulses was 5600 Hz, limiting chemical shift artifacts arising from the other PFOB peaks, which were at least 8500 Hz away from the CF3 peak.
Clots were imaged with a 19F reference (PARACEST nanoparticles diluted to 28.5 nM) within the field of view (FOV) for quantification. 19F T1 and T2 relaxation times of the phantom and treated clot samples were measured with inversion recovery (10 inversion times from 10 ms to 10 s) and spin echo (12 echo times from 1 ms to 5 s) spectroscopy sequences. The relaxation data was fitted to standard exponential recovery and decay equations with MATLAB 7.0.
Regions of interest (ROIs) were manually traced for each chamber of the quantification phantom and the clot surface. The PARACEST images collected at the two presaturation frequencies were subtracted and the contrast to noise ratio (CNR) was calculated based on the standard deviation of the image intensity from an ROI in the air, i.e., (image with saturation at −51 ppm minus image with saturation at +51 ppm) divided by the noise. The 19F image intensity was converted to nanoparticle concentration based on the signal intensity of the 19F reference. To obtain a measurement of the PARACEST contrast on the clots that is independent of the noise characteristics of our experimental setup, we also measured the normalized percent change in PARACEST signal intensity, i.e., (signal with saturation at −51 ppm minus signal with saturation at +51 ppm) divided by the signal with saturation at −51 ppm. This equation provides a metric that is comparable from one imaging site to another and does not rely on the pulse sequences and imaging systems employed in a particular research lab.
Statistics
One-way analysis of variance (ANOVA) was performed in MATLAB 7.0 to compare treated and control clots. All values are reported as mean ± standard error. Group differences were considered to be significant at p<0.05.
RESULTS
PARACEST chelate and nanoparticle characteristics
PARACEST nanoparticles formulated with Eu3+-DOTA-4AMC-benzyl-PE (Fig. 1, Right) yielded a mean particle size of 183 nm and zeta potential of −57.86 mV. The Eu3+ concentration measured by ICP-MS was 3.33 mM and the particle concentration was 113.85 nM, based on the particle size and PFOB content (9).
Z-spectra of the water soluble PARACEST chelate, Eu3+-DOTA-4AMC-benzyl, and Eu3+-DOTA-4AMC-benzyl-PE nanoparticles showed a clear bound water peak at 51 ppm (Fig. 2), consistent with a previously reported symmetric PARACEST chelate (6). The small molecule agent displayed 65% higher PARACEST effect compared to the nanoparticles. However, the proton T1 and T2 relaxation times were similar for the water soluble chelate (T1 = 3.03 s, T2 = 76.54 ms) and the PARACEST nanoparticles (T1 = 2.85 s, T2 = 55.83 ms). Simulation of the modified Bloch equations (Fig. 3) indicated that the optimum bound water lifetime was 976 μs. Fitting the experimental Z-spectra to the modified Bloch equations revealed that the bound water lifetime for both the water soluble chelate (290 μs) and nanoparticle agent (108 μs) was much lower than the optimal value. The decreased bound water lifetime for the PARACEST nanoparticles compared to the water soluble chelate is consistent with the reduced PARACEST effect seen with this agent.
Figure 2.

Z-spectra (data points) acquired from the water soluble and nanoparticle PARACEST agents show the presence of a bound water peak at +51 ppm. The water soluble chelate produces a stronger PARACEST effect than the nanoparticles at equivalent Eu3+ concentrations. Fitting the experimental data to the modified Bloch equations (solid lines) shows excellent agreement and allows calculation of the bound water lifetime for each agent.
Figure 3.

Mathematical simulation of PARACEST MRI signal versus bound water lifetime. The bound water lifetime for the dilute nanoparticle agent (red triangle) is lower than for the water soluble chelate (blue circle), decreasing the available PARACEST contrast. When the particles bind to a target surface, the bound water lifetime increases, making the exchange kinetics more optimal and increasing the image contrast (green square).
Quantitative molecular imaging of fibrin clots
PARACEST and 19F MRI of diluted nanoparticles (Fig. 4) showed a linear increase in both PARACEST CNR and the 19F signal with increasing nanoparticle concentration (r2 > 0.99). The nanoparticle detection limits (SNR or CNR = 5) under these imaging conditions was 4.13 nM for PARACEST and 4.60 nM for 19F. Clots treated with targeted nanoparticles showed PARACEST contrast only along the clot boundary and not the clot interior or the surrounding saline (Fig. 5), similar to the pattern of enhancement with gadolinium containing nanoparticles (11). The PARACEST CNR along the clot surface was 17.70 ± 2.77 for the targeted clots but below the detection limit (CNR < 5) for control clots (Fig. 6). The average percent change in the PARACEST signal intensity at the surface of the targeted clots was 9.83% ± 0.94. The 19F images also showed signal only at the clot surface, yielding an SNR of 7.34 ± 0.59 for the targeted clots, but less than 5 for the control clots. The 19F T1 and T2 relaxation times were equivalent for the diluted nanoparticle phantoms (T1 = 0.95 ± 0.07 s, T2 = 85.75 ± 5.12 ms) and targeted clots (T1 = 0.96 ± 0.03 s, T2 = 49.77 ± 17.06 ms, p > 0.05), allowing direct calculation of nanoparticle concentrations without correcting for partial saturation effects. Converting the 19F signal to nanoparticle concentration showed that the average concentration of particles per voxel at the clot surface was 8.13 ± 1.59 nM for the targeted clots. Overlaying the color-mapped nanoparticle concentration onto the PARACEST subtraction image showed co-localization of the PARACEST and 19F signals.
Figure 4.

Both the PARACEST CNR and 19F MRI signal increased linearly with the nanoparticle concentration. The detection limit for PARACEST (CNR = 5) and 19F (SNR = 5) imaging were similar, 4.13 and 4.60 nM, respectively.
Figure 5.
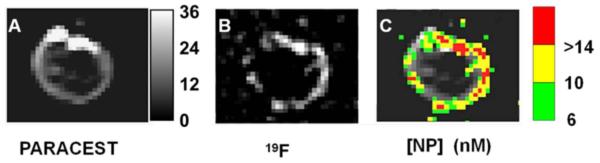
Dual PARACEST and 19F imaging of a clot treated with fibrin-targeted PARACEST nanoparticles. PARACEST CNR map (A) and 19F image (B) collaboratively show nanoparticles bound to the surface of the clot. The grayscale color bar represents the PARACEST CNR depicted in (A). (C) The nanoparticle concentration (nM) is color-coded and overlaid onto the PARACEST subtraction image to demonstrate co-localization of these two definitive signals.
Figure 6.

Clots treated with fibrin-targeted PARACEST nanoparticles showed higher PARACEST CNR (Left) and higher concentration of bound nanoparticles (Right) compared to control clots (* p < 0.05). When bound to the clot, the PARACEST minimum detection limit (CNR = 5) is reduced to 2.30 nM, presumably due to alteration of the bound water lifetime. The error bars represent the standard error of the mean for each group of clots.
On the clot surface, a nanoparticle concentration of 8.13 nM produced a PARACEST CNR of 17.7. However, the same concentration of nanoparticles in the quantification phantoms would have yielded a PARACEST CNR of only 7.99. Based on quantification of the nanoparticles bound to the clot surface, the detection limit (CNR = 5) for bound PARACEST nanoparticles was calculated as 2.30 nM. This limit of detection is 44% lower than was measured with diluted nanoparticles, indicating that binding the nanoparticles onto a biological target actually improves the PARACEST mechanism, perhaps due to an increase in the bound water lifetime. Mathematical simulation under these experimental conditions suggests that the bound water lifetime of the bound nanoparticles was around 600 μs, which is an improvement over the diluted nanoparticles (108 μs) (Fig. 3).
DISCUSSION
PARACEST PFC nanoparticles provide a unique platform for dual PARACEST and 19F MR molecular imaging. Unlike other paramagnetic or superparamagnetic MRI contrast agents, PARACEST agents offer contrast on demand. In comparison, typical MRI contrast agents must produce sufficient contrast to overcome the native variations in the MRI signal intensity. 19F MRI is also an attractive choice for unambiguous imaging, due to the lack of endogenous 19F signal in biological tissues. The combination of these two techniques could provide a convenient 1H signal as well as a quantitative 19F signal for detecting and characterizing biomarkers with molecular imaging. In this study, we demonstrated that targeted PARACEST nanoparticles can detect fibrin associated with clots by either PARACEST or 19F imaging with detection limits below 5 nM. Dual PARACEST and 19F MR molecular imaging of fibrin with this nanoparticle agent could be used to precisely and sensitively detect rupturing atherosclerotic plaques, directing therapeutic interventions to prevent or ameliorate the consequences of a heart attack or stroke.
The available contrast from a PARACEST agent depends primarily upon the chemical properties of the metal chelate. PARACEST agents rely on slow to intermediate exchange between two distinct pools of water, a metal coordinated water pool and the bulk water pool (12). Through modeling the modified Bloch equations, we have evaluated the water exchange kinetics of a water soluble parent PARACEST agent, Eu3+-DOTA-4AMC-benzyl, and the exchange kinetics of a lipid-conjugated derivative, Eu3+-DOTA-4AMC-benzyl-PE, incorporated onto the surface of nanoparticles. The lipid-conjugated agent displayed a shorter bound water lifetime than the parent structure, 108 μs vs. 290 μs, respectively. This may reflect destabilization of water binding to the metal center due to the coupling of a large phospholipid group near the PARACEST chelate, causing the bound water lifetime to decrease (13). Others have demonstrated similar effects with gadolinium agents when various chemical groups are grafted onto the chelate backbone and the exchange kinetics of the coordinated water are altered (14-17). Since the lipid-conjugated PARACEST chelate was not water soluble, the water exchange kinetics of the chelate alone were not studied. Therefore, the observed decreased in the bound water lifetime could reflect the combined effects of both alterations to the chelate chemical structure as well as anchoring the agent into the phospholipid membrane on the nanoparticle surface.
Other researchers have studied the water exchange kinetics of PARACEST chelates when bound to large macromolecular structures, such as albumin or monoclonal antibodies (18,19). Modification of a PARACEST chelate with serine residues that bind to human serum albumin caused the bound water lifetime to increase from 380 μs to 1000 μs (18). On the other hand, PARACEST agents designed to covalently couple to albumin or antibodies displayed much lower bound water lifetimes after modification of either the carbon backbone (53 μs) or one pendant arm of the chelate (73 μs) (19). Several researchers have shown that binding traditional gadolinium chelates to albumin increases the bound water lifetime (20-24), similar to the apparent increase we observed when PARACEST nanoparticles were bound to the surface of clots (increase from 108 μs to 600 μs). However, the serine modified PARACEST chelate displayed a significant decrease in bound water lifetime from 1000 μs to approximately 600 μs when bound to albumin (18), while covalent coupling of PARACEST chelates to albumin or antibodies had only minor effects on the bound water lifetime (from 53 μs and 73 μs to 77 μs and 75 μs) (19). These dramatic differences in water exchange kinetics indicate that binding PARACEST agents to large structures or surfaces can have diverse effects on water interaction with the metal chelate that probably depend upon a wide range of factors including the target topography, chelate structure and binding ligands utilized.
Since the nanoparticle agent can be directly imaged with the quantitative 19F signal arising from the PFC core, the concentration of bound nanoparticles was determined in this study. When bound to the clot surface, the PARACEST nanoparticles produce more than 2 times higher PARACEST contrast than when in suspension. We hypothesize that adhering to a biological target, such as the fibrin clot, reduces nanoparticle mobility and slows the water exchange kinetics. In order for the particles to produce the amount of contrast observed on the clot surface, the bound water lifetime would need to increase nearly six-fold, from 108 μs to 600 μs. The increased bound water lifetime results in an improvement in the lower detection limit from 4.13 nM for nanoparticles in suspension down to 2.30 nM for nanoparticles bound to a target.
The conclusion that the bound water lifetime increases when nanoparticles bind to the clot surface, however, is based only on subtraction images and not a complete PARACEST profile. Therefore, we cannot definitively calculate the water exchange kinetics. In order to use the mathematical fitting routine to estimate the bound water lifetime of the agent on the clot surface, a pixel-by-pixel PARACEST profile needs to be collected, similar to the data shown in Figure 2. The imaging sequence would have to be repeated 181 times to generate one image for each presaturation frequency, yielding a total imaging time of 25.6 hours. Alternatively, lower resolution imaging could be performed, but this would increase partial volume averaging and would not accurately reflect the water exchange observed in a 187.5 by 187.5 μm voxel at the clot surface. In addition, the PARACEST sensitivity to bound water lifetime does not provide a unique value based on the observed PARACEST CNR. Bound water lifetimes of both 600 μs and 1660 μs could generate a CNR of 17.7. We assume that the lower value is more reasonable, but without direct measurement of the water exchange, this is merely an assumption.
There are other factors that could alter the PARACEST contrast in addition to changes in the water exchange kinetics. Both the water content and proton relaxation times of the clot samples could influence the PARACEST effect. Previous publications have demonstrated that these in vitro clot preparations have a very high water content and are indistinguishable from surrounding PBS when imaged with MRI or ultrasound 8,9,11). To verify that the water content of the clots and the quantitation phantoms used in this study were identical, a separate cohort of treated and untreated clots (n=3 per group) were imaged with an inversion recovery MRI pulse sequence to determine the relative water content of the clots with respect to the surrounding PBS. The three regions had identical signal magnitudes (treated clots = 2078 ± 110, untreated clots = 1841 ± 109, PBS = 1969 ± 109 arbitrary units, p>0.05), indicating that the clot interior had the same water content as PBS. However, since variations in the bulk water content from one sample to another or between two tissues affect the PARACEST contrast, water content should be quantified to calculate accurate bound water exchange kinetics. While Eu3+ does not reduce T1 to the same degree as other lanthanide metals, such as gadolinium, the inversion recovery data showed that the T1 of the clot interior was 10-15% lower than the surrounding PBS in agreement with previous publications at other field strengths (9). Mathematical simulation of the modified Bloch equations show that lowering the T1 by 15% leads to only a slight decrease in the PARACEST contrast 4%). Furthermore, the T1 relaxation times reported in this study were measured without a presaturation pulse. Since the bulk water spins are exchanging with a pool in close proximity to Eu3+, the T1 relaxation times may be different with and without a presaturation pulse. These T1 relaxation effects could be sufficient to alter the PARACEST contrast, which would impact the accuracy of our estimate of the bound water exchange rates.
We quantified the water exchange kinetics of the PARACEST nanoparticles at room temperature (~25°C), but the in vivo application of these agents would be performed at 37°C. Other researchers have described the effects of temperature on PARACEST chelates (25,26). Typically, the bound water peak shifts by 0.3-0.4 ppm/°C, resulting in a 3-5 ppm shift towards the bulk water resonance from room temperature to body temperature. The water exchange rate for these chelates also increases at higher temperatures, although the exact relationship has not been reported. To evaluate the utility of this PARACEST nanoparticle formulation for in vivo imaging, further studies will be needed to determine the bound water chemical shift, optimum bound water lifetime and bound water exchange rates at 37°C.
In this study, the PARACEST contrast was linearly correlated with the agent concentration. This condition only holds true for relatively low concentrations of the agent, such as the range depicted in Figure 4. The highest concentration studied was 56.9 nM of nanoparticles, which is equivalent to 1.66 mM Eu3+. Simulation of the PARACEST signal in Matlab shows that the contrast deviates from the linear prediction by only 1% at 4 mM Eu3+ and by 5% at 7.5 mM Eu3+, well below the concentrations measured in these experiments. Other investigators have previously described this nonlinear phenomenon for PARACEST agents based on Eu3+ and Yb3+ chelates at concentrations ranging from 5 to 10 mM (2,25,27).
Comparing the efficacy of different PARACEST agents is complicated by the use of different field strengths, pulse sequence parameters and definitions of minimum detection limit. The PARACEST detection limit is often defined as a 5% change in the MR signal, which neglects the influence of contrast to noise ratio on the conspicuity of image enhancement. Using the 5% change in signal benchmark, the detection limit of Yb3+-DO3A-oAA has been reported as 2.9 mM at 9.4T (28), while 0.3 mM was reported as the lower limit of Yb3+-DOTAM at 7T (2). Incorporating PARACEST chelates on a macromolecular backbone or a nanoparticle structure would be expected to lower the detection limit due to the large payload of paramagnetic metal on each molecule. Typically, these concentration limits are calculated per macromolecular unit, such as per dendrimer or polymer. For instance, a Yb3+-DOTAM chelate with a 0.3 mM detection limit can be formulated into a third generation dendrimer, causing the detection limit to drop to 20 μM of the dendrimer (2). Similarly, polymers consisting of Eu3+ or Tm3+ chelates have been described with detection limits of 65 μM (11.75T) or 1.7 μM (7.05T), respectively (3,5). Using a somewhat different definition of detection limit (3% change in MR signal), a fifth generation dendrimer with Eu3+ chelates provided a minimum detection limit of 45 μM at 9.4T (4). While these macromolecular constructs effectively lower the PARACEST detection limit, the improvements were rather modest due to the limited number of metal chelates, approximately 15 to 40, incorporated onto each molecule. The PARACEST nanoparticles utilized in this study, however, carry a payload of almost 30,000 Eu3+ chelates per particle, lowering the minimum detection limit to below 5 nM. For molecular imaging applications, the ability to deliver a large number of imaging agents to each target site is essential for detecting biomarkers that occur at low concentrations.
Quantitative 19F MRI of fibrin targeted PFC nanoparticles has previously been validated by destructive chemical analysis of the PFC (by gas chromatography) and the paramagnetic Gd3+ chelate (by neutron activation) (7). This earlier study found that nanoparticles bound to the surface of human carotid endarterectomy samples at a concentration of ~1.5 nM. Although similar in magnitude, these previous results are lower than the 8.13 nM concentration of bound nanoparticles observed in the current study. The differences in particle binding are likely a consequence of disparities in the samples (vulnerable plaque specimens vs. fibrin clots prepared in vitro) and variations in the voxel sizes (projection image covering entire sample vs. a single 4 mm slice).
CONCLUSIONS
We have demonstrated that targeted PARACEST nanoparticles can be used for molecular imaging of fibrin with both PARACEST and 19F MRI at 11.7T. 19F MRI not only corroborated detection of the biological marker, but also provided a quantitative measurement of nanoparticle binding. The PARACEST contrast observed on the clot surface was more than 2 times higher than was expected from the concentration of bound nanoparticles, presumably due to an increase in the bound water lifetime. Thus, when the particles bind to a target, the PARACEST exchange kinetics are slowed and the PARACEST efficacy increases. The detection limit for the PARACEST nanoparticles when bound to a target was 2.30 nM.
Acknowledgements
The authors thank Ralph Fuhrhop and Dr. Dipanjan Pan for their assistance in nanoparticle formulation and chemical analysis; Jacob Myerson for providing the 11.7T MR coil; Kevin MacDonald for improvements to the PARACEST simulation and curve fitting programs; Dr. Dean Sherry for guidance and suggestions; Dr. Joseph Ackerman and the Biomedical Magnetic Resonance Laboratory at Washington University for the use of the high-field research MRI scanner.
Grant sponsors: National Institutes of Health: R01 HL073646; U54 CA119342; RO1 EB01704; American Heart Association: 10GRNT4000018.
Abbreviations used
- PARACEST
paramagnetic chemical exchange saturation transfer
- PFC
perfluorocarbon
- PFOB
perfluorooctyl bromide
- ICP-MS
inductively coupled plasma mass spectroscopy
- ODE
ordinary differential equation
- PBS
phosphate buffered saline
- FOV
field of view
- ROI
region of interest
- CNR
contrast to noise ratio
- ANOVA
one-way analysis of variance
- SNR
signal to noise ratio
REFERENCES
- 1.Ward KM, Aletras AH, Balaban RS. A new class of contrast agents for MRI based on proton chemical exchange dependent saturation transfer (CEST) J Magn Reson. 2000;143(1):79–87. doi: 10.1006/jmre.1999.1956. [DOI] [PubMed] [Google Scholar]
- 2.Pikkemaat JA, Wegh RT, Lamerichs R, van de Molengraaf RA, Langereis S, Burdinski D, Raymond AY, Janssen HM, de Waal BF, Willard NP, Meijer EW, Grull H. Dendritic PARACEST contrast agents for magnetic resonance imaging. Contrast Media Mol Imaging. 2007;2(5):229–239. doi: 10.1002/cmmi.149. [DOI] [PubMed] [Google Scholar]
- 3.Aime S, Delli Castelli D, Terreno E. Supramolecular adducts between poly-L-arginine and [TmIIIdotp]: a route to sensitivity-enhanced magnetic resonance imaging-chemical exchange saturation transfer agents. Angew Chem Int Ed Engl. 2003;42(37):4527–4529. doi: 10.1002/anie.200352132. [DOI] [PubMed] [Google Scholar]
- 4.Ali MM, Yoo B, Pagel MD. Tracking the relative in vivo pharmacokinetics of nanoparticles with PARACEST MRI. Mol Pharm. 2009;6(5):1409–1416. doi: 10.1021/mp900040u. [DOI] [PMC free article] [PubMed] [Google Scholar]
- 5.Wu Y, Zhou Y, Ouari O, Woods M, Zhao P, Soesbe TC, Kiefer GE, Sherry AD. Polymeric PARACEST agents for enhancing MRI contrast sensitivity. J Am Chem Soc. 2008;130(42):13854–13855. doi: 10.1021/ja805775u. [DOI] [PMC free article] [PubMed] [Google Scholar]
- 6.Winter PM, Cai K, Chen J, Adair CR, Kiefer GE, Athey PS, Gaffney PJ, Buff CE, Robertson JD, Caruthers SD, Wickline SA, Lanza GM. Targeted PARACEST nanoparticle contrast agent for the detection of fibrin. Magn Reson Med. 2006;56(6):1384–1388. doi: 10.1002/mrm.21093. [DOI] [PMC free article] [PubMed] [Google Scholar]
- 7.Morawski AM, Winter PM, Yu X, Fuhrhop RW, Scott MJ, Hockett F, Robertson JD, Gaffney PJ, Lanza GM, Wickline SA. Quantitative “magnetic resonance immunohistochemistry” with ligand-targeted (19)F nanoparticles. Magn Reson Med. 2004;52(6):1255–1262. doi: 10.1002/mrm.20287. [DOI] [PubMed] [Google Scholar]
- 8.Lanza GM, Wallace KD, Scott MJ, Cacheris WP, Abendschein DR, Christy DH, Sharkey AM, Miller JG, Gaffney PJ, Wickline SA. A novel site-targeted ultrasonic contrast agent with broad biomedical application. Circulation. 1996;94(12):3334–3340. doi: 10.1161/01.cir.94.12.3334. [DOI] [PubMed] [Google Scholar]
- 9.Winter PM, Caruthers SD, Yu X, Song SK, Chen J, Miller B, Bulte JW, Robertson JD, Gaffney PJ, Wickline SA, Lanza GM. Improved molecular imaging contrast agent for detection of human thrombus. Magn Reson Med. 2003;50(2):411–416. doi: 10.1002/mrm.10532. [DOI] [PubMed] [Google Scholar]
- 10.Woessner DE, Zhang S, Merritt ME, Sherry AD. Numerical solution of the Bloch equations provides insights into the optimum design of PARACEST agents for MRI. Magn Reson Med. 2005;53(4):790–799. doi: 10.1002/mrm.20408. [DOI] [PubMed] [Google Scholar]
- 11.Flacke S, Fischer S, Scott MJ, Fuhrhop RJ, Allen JS, McLean M, Winter P, Sicard GA, Gaffney PJ, Wickline SA, Lanza GM. Novel MRI contrast agent for molecular imaging of fibrin: implications for detecting vulnerable plaques. Circulation. 2001;104(11):1280–1285. doi: 10.1161/hc3601.094303. [DOI] [PubMed] [Google Scholar]
- 12.Terreno E, Castelli DD, Cravotto G, Milone L, Aime S. Ln(III)-DOTAMGly complexes: a versatile series to assess the determinants of the efficacy of paramagnetic chemical exchange saturation transfer agents for magnetic resonance imaging applications. Invest Radiol. 2004;39(4):235–243. doi: 10.1097/01.rli.0000116607.26372.d0. [DOI] [PubMed] [Google Scholar]
- 13.Woods M, Sherry AD. Engineering lanthanide complexes with controlled water exchange rates for magnetic resonance imaging. Conf Proc IEEE Eng Med Biol Soc. 2004;7:5254–5257. doi: 10.1109/IEMBS.2004.1404468. [DOI] [PubMed] [Google Scholar]
- 14.Jaszberenyi Z, Sour A, Toth E, Benmelouka M, Merbach AE. Fine-tuning water exchange on Gd(III) poly(amino carboxylates) by modulation of steric crowding. Dalton Trans. 2005;16:2713–2719. doi: 10.1039/b506702b. [DOI] [PubMed] [Google Scholar]
- 15.Kotek J, Lebduskova P, Hermann P, Vander Elst L, Muller RN, Geraldes CF, Maschmeyer T, Lukes I, Peters JA. Lanthanide(III) complexes of novel mixed carboxylic-phosphorus acid derivatives of diethylenetriamine: a step towards more efficient MRI contrast agents. Chemistry. 2003;9(23):5899–5915. doi: 10.1002/chem.200305155. [DOI] [PubMed] [Google Scholar]
- 16.Laus S, Ruloff R, Toth E, Merbach AE. GdIII complexes with fast water exchange and high thermodynamic stability: potential building blocks for high-relaxivity MRI contrast agents. Chemistry. 2003;9(15):3555–3566. doi: 10.1002/chem.200204612. [DOI] [PubMed] [Google Scholar]
- 17.Rudovsky J, Kotek J, Hermann P, Lukes I, Mainero V, Aime S. Synthesis of a bifunctional monophosphinic acid DOTA analogue ligand and its lanthanide(III) complexes. A gadolinium(III) complex endowed with an optimal water exchange rate for MRI applications. Org Biomol Chem. 2005;3(1):112–117. doi: 10.1039/b410103k. [DOI] [PubMed] [Google Scholar]
- 18.Ali MM, Woods M, Suh EH, Kovacs Z, Tircso G, Zhao P, Kodibagkar VD, Sherry AD. Albumin-binding PARACEST agents. J Biol Inorg Chem. 2007;12(6):855–865. doi: 10.1007/s00775-007-0240-z. [DOI] [PMC free article] [PubMed] [Google Scholar]
- 19.Vasalatiy O, Zhao P, Woods M, Marconescu A, Castillo-Muzquiz A, Thorpe P, Kiefer GE, Dean Sherry A. Strategies for labeling proteins with PARACEST agents. Bioorg Med Chem. 2010 doi: 10.1016/j.bmc.2010.06.026. [DOI] [PMC free article] [PubMed] [Google Scholar]
- 20.Aime S, Botta M, Crich SG, Giovenzana GB, Pagliarin R, Piccinini M, Sisti M, Terreno E. Towards MRI contrast agents of improved efficacy. NMR relaxometric investigations of the binding interaction to HSA of a novel heptadentate macrocyclic triphosphonate Gd(III)-complex. J Biol Inorg Chem. 1997;2:470–479. [Google Scholar]
- 21.Aime S, Botta M, Fasano M, Crich SG, Terreno E. Gd(III) complexes as contrast agents for magnetic resonance imaging: a proton relaxation enhancement study of the interaction with human serum albumin. J Biol Inorg Chem. 1996;1:312–319. [Google Scholar]
- 22.Aime S, Chiaussa M, Digilio G, Gianolio E, Terreno E. Contrast agents for magnetic resonance angiographic applications: 1H and 17O NMR relaxometric investigations on two gadolinium(III) DTPA-like chelates endowed with high binding affinity to human serum albumin. J Biol Inorg Chem. 1999;4(6):766–774. doi: 10.1007/s007750050349. [DOI] [PubMed] [Google Scholar]
- 23.Aime S, Gianolio E, Longo D, Pagliarin R, Lovazzano C, Sisti M. New insights for pursuing high relaxivity MRI agents from modelling the binding interaction of Gd(III) chelates to HSA. Chembiochem. 2005;6(5):818–820. doi: 10.1002/cbic.200400364. [DOI] [PubMed] [Google Scholar]
- 24.Caravan P, Cloutier NJ, Greenfield MT, McDermid SA, Dunham SU, Bulte JW, Amedio JC, Jr., Looby RJ, Supkowski RM, Horrocks WD, Jr., McMurry TJ, Lauffer RB. The interaction of MS-325 with human serum albumin and its effect on proton relaxation rates. J Am Chem Soc. 2002;124(12):3152–3162. doi: 10.1021/ja017168k. [DOI] [PubMed] [Google Scholar]
- 25.Li AX, Wojciechowski F, Suchy M, Jones CK, Hudson RH, Menon RS, Bartha R. A sensitive PARACEST contrast agent for temperature MRI: Eu3+-DOTAM-glycine (Gly)-phenylalanine (Phe) Magn Reson Med. 2008;59(2):374–381. doi: 10.1002/mrm.21482. [DOI] [PubMed] [Google Scholar]
- 26.Zhang S, Malloy CR, Sherry AD. MRI thermometry based on PARACEST agents. J Am Chem Soc. 2005;127(50):17572–17573. doi: 10.1021/ja053799t. [DOI] [PMC free article] [PubMed] [Google Scholar]
- 27.Aime S, Barge A, Delli Castelli D, Fedeli F, Mortillaro A, Nielsen FU, Terreno E. Paramagnetic lanthanide(III) complexes as pH-sensitive chemical exchange saturation transfer (CEST) contrast agents for MRI applications. Magn Reson Med. 2002;47(4):639–648. doi: 10.1002/mrm.10106. [DOI] [PubMed] [Google Scholar]
- 28.Liu G, Li Y, Pagel MD. Design and characterization of a new irreversible responsive PARACEST MRI contrast agent that detects nitric oxide. Magn Reson Med. 2007;58(6):1249–1256. doi: 10.1002/mrm.21428. [DOI] [PubMed] [Google Scholar]