

Abstract
Introduction
The proximal humerus is relatively under investigated despite being the fourth most common site for osteoporotic fracture.
Methods
A cross-sectional study was performed to assess age-related changes in dual-energy x-ray absorptiometry (DXA) and peripheral quantitative computed tomography (pQCT) properties of the proximal humerus in a cohort of 170 healthy, white males.
Results
Regression models estimated considerable age-related loss of DXA measured bone quantity at the proximal humerus, with areal bone mineral density modeled to decline by 29% (95%CI, 17.5–35.0%) in the 50 years between ages 30 and 80 years (p<0.001). pQCT measures indicated aging was associated with progressive periosteal and endosteal expansion, with the later occurring more rapidly as indicated by age-related declines in cortical bone mass, area and thickness (all p<0.01). The net result of the density, mass and structural changes was a 26% (95%CI, 13.5–38.0%) decline in pQCT estimated proximal humerus bone strength in the 50 years between ages 30 and 80 years (p<0.001).
Conclusion
Aging is associated with considerable declines in proximal humeral bone health which, when coupled with a traumatic event such as a fall, may contribute to osteoporotic fracture at this site.
Keywords: cortical bone, fracture, osteoporosis, trabecular bone, upper extremity
INTRODUCTION
Osteoporosis remains a significant cause of morbidity and mortality, with low trauma fractures stemming from age-related bone loss and structural decay contributing to 1.5–2 million fractures annually in the United States (1). Fractures of the proximal femur, vertebrae and distal radius account for the majority of osteoporotic fractures; however, age-related reductions in bone health also contribute to low trauma fractures at other sites. The proximal humerus is the fourth most common site for osteoporotic fracture (2–4) and fractures at this site account for up to 8% of all osteoporotic fractures (5). Proximal humerus fractures are a concern as they result in ongoing morbidity and because one-quarter of those afflicted die within the first 3 years following fracture (2, 6, 7). Heightening concern is the anticipated tripling in the number of proximal humerus fractures over the next decades resulting from the progressive aging of the population (8).
The proximal humerus is relatively under investigated as an osteoporotic site. Falls are the leading risk factor for fracture of the proximal humerus (9), with falls resulting in direct impact of the shoulder/upper arm region accounting for over three quarters of fractures at this site (10). However, falls do not always result in fracture. Consequently, other factors such as localized bone density, mass and structure likely contribute to osteoporotic fracture risk at the proximal humerus (11, 12). Few studies have explored age-related changes in bone properties at the proximal humerus (13–17). Initial data suggest DXA-derived areal bone mineral density (aBMD) at the proximal humerus declines with age (14), and that there is cortical thinning and microarchitectural deterioration within the humeral head in aged individuals (13, 16, 17). The aim of the current study was to explore the rate of age-related changes in DXA- and pQCT-derived properties of the proximal humerus in healthy, white males.
METHODS
Study design and participants
A cross-sectional study design was performed to assess bone properties of the proximal humerus in the non-dominant upper extremity of a cohort of 170 white males. Data were acquired as part of a broader study investigating upper extremity bone health. Arm dominance was determined as the arm with which subjects would throw a ball. Subjects were eligible to participate if they were aged >30 years and in good general health. Subjects were excluded if they had a: 1) known metabolic bone disease; 2) history of taking pharmacological agents known to influence skeletal metabolism; 3) previous fracture of the humerus, or; 4) previous shoulder surgery resulting in implantation of metal within the proximal humerus. The study was approved by the Institutional Review Board of Indiana University and all subjects provided written informed consent prior to participation.
Anthropometric measures
Height (to the nearest 0.1 cm) and mass (to the nearest 0.1 kg) were measured without shoes using a wall-mounted stadiometer and electronic balance scale, respectively. Humeral length (to the nearest 1 mm) was measured using a sliding anthropometer as the distance between the lateral border of the acromion and the radiohumeral joint line.
Dual-energy x-ray absorptiometry (DXA)
DXA was performed using a Hologic Discovery-W machine (Hologic, Inc., Waltham, MA, USA) equipped with Hologic Apex v2.3 software. Whole-body and dual hip scans were performed using the manufacturer’s standard scan and positioning protocol to acquire whole-body and total hip aBMD (g/cm2), and whole-body lean (kg) and percent fat (%) mass. Bone properties of the proximal humerus were obtained by performing a regional scan using the manufacturer’s lumbar spine protocol. The subject’s shoulder was positioned centrally on the table with care taken to position the humerus vertically within the scan field. Bone area (cm2), BMC (g), and aBMD (g/cm2) of the proximal humerus were obtained by placing a region of interest over the proximal 25% of the bone with a set width of 80 lines [80.64 mm] (Figure 1). Short-term precision for the DXA scanning procedure on five healthy individuals scanned five times with interim repositioning showed root mean square coefficients of variation (RMS-CVs) of 1.6%, 3.0%, and 2.8% for proximal humerus bone area, BMC, and aBMD, respectively.
Figure 1.
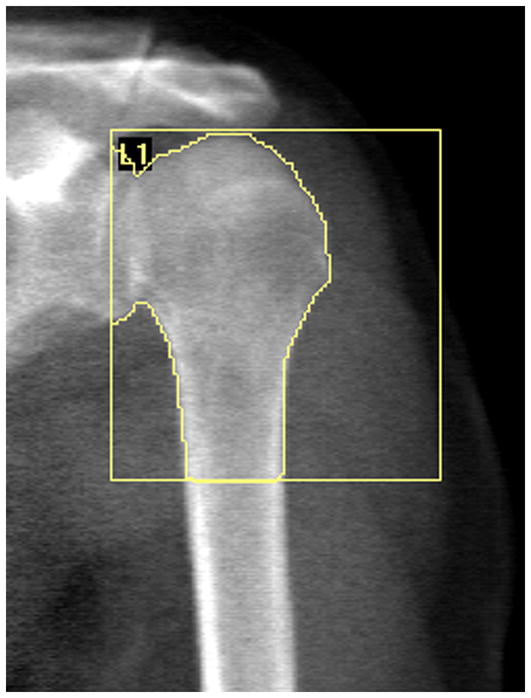
Representative DXA image and analysis of the proximal humerus. The upper and medial borders of the region of interest (ROI) box were positioned on the superior and medial most portions of the humeral head, while the inferior border was positioned at 25% of humeral length distal from the superior most portion of the humeral head. Positioning of the inferior line was aided by knowing anthropometer assessed humeral length and the line spacing of the spine scanning protocol (1.008 mm/line). The lateral border of the ROI was positioned so ROI width was held constant at 80 lines (80.64 mm) across all participants.
Peripheral quantitative computed tomography (pQCT)
pQCT of the proximal humerus was performed using a Stratec XCT 3000 machine (Stratec Medizintechnik GmbH, Pforzheim, Germany) equipped with Stratec software version 6.20C. Subjects were positioned in supine with their arm in 90° shoulder abduction and centered within the gantry of the machine. An initial scout scan was performed to visualize the radiohumeral joint and a reference line was placed through the joint at the distal edge of the humeral capitulum. A tomographic slice (thickness = 2.3 mm; voxel size 300 μm; scan speed = 20 mm/s) was taken at 80% of humeral length proximal from this reference line, which approximates the surgical neck of the proximal humerus and is also a common site for osteoporotic fractures of the proximal humerus (18).
Tomographic slices were analyzed for bone density, mass, structure, and estimated strength. Total area (Tt.Ar, mm2), total volumetric bone mineral density (Tt.vBMD, mg/cm3), periosteal perimeter (Ps.Pm, mm), endosteal perimeter (Es.Pm, mm), cortical thickness (Ct.Th, mm), and trabecular bone mineral content (Tb.BMC, mg/mm) were obtained by analyzing the slices using contour mode 3 (threshold = 710 mg/cm3) to define the outer bone edge and peel mode 2 (threshold = 400 mg/cm3) to separate the cortical and trabecular compartments. Cort mode 1 (threshold = 710 mg/cm3) was used to obtain cortical volumetric BMD (Ct.vBMD) and cortical BMC (Ct.BMC).
Estimated strength of the proximal humerus was obtained by calculating the bone strength index for compression (BSIc, mg2/mm4) and polar strength-strain index (SSIP, mm3). BSIc predicts failure load at skeletal sites loaded in compression (19), and was calculated as the product of Tt.Ar and the square of Tt.vBMD (20). Tt.Ar and Tt.vBMD were obtained as outlined above. SSIP represents the density-weighted section modulus and has been validated as a non-invasive measure of bone strength (21). It was obtained in a separate analysis using cort mode 2 (threshold = 400 mg/cm3), and was calculated as the section modulus multiplied by the ratio of Ct.vBMD and normal physiologic density (1200 mg/mm3), as previously described (22, 23).
Short-term precision for the pQCT scanning procedure on five healthy individuals scanned five times with interim repositioning showed root mean square coefficients of variation (RMS-CVs) of <1%, <2.5% and <4% for bone density, mass and estimated strength measures, respectively.
Statistical analyses
Statistical analyses were performed with the Predictive Analytics SoftWare (PASW) Statistics 18 (Statistical Package for Social Sciences [SPSS] Inc., Chicago, IL, USA). One-way ANOVA followed by Fisher’s protected least significant difference for pairwise comparisons was used to compare demographic and anthropometric characteristics of those in older decades of life to those in the youngest decade recruited (30–39 years). Linear regression models were used to examine the change in proximal humerus properties with age. The functional forms of the relationship between age and proximal humerus properties were explored graphically by fitting linear, quadratic, cubic, exponential, and logarithmic curves to the data. Age-related changes in proximal humerus properties were obtained, with body mass and height included in models of bone mass and size/estimated strength, respectively. Body mass and height were included as Pearson’s bivariate correlations revealed their strong association with proximal humerus bone properties (data not shown). Only one of body mass and height was included with age in each model as mass and height were collinear. Absolute and percent changes (and 95% confidence intervals) in measures of the proximal humerus per decade beyond age 30 years were based on predicted values from regression models. All analyses were considered significant at p≤0.05.
RESULTS
Participant characteristics
Participants ranged in age from 30.2 to 87.5 years with a spread of participants across decades of age (Table 1). There were differences in whole-body composition between age groups, with individuals aged 80+ years having 17.7% less lean mass and 22.0% greater percent fat than those aged 30–39 years (all p<0.05). Whole-body aBMD did not differ between age groups (all p>0.05); however, individuals aged 80+ years had 10.3% less hip aBMD than those aged 30–39 years (p<0.05).
Table 1.
Participant characteristics
| Age range (years)a
|
||||||
|---|---|---|---|---|---|---|
| 30–39 | 40–49 | 50–59 | 60–69 | 70–79 | 80+ | |
| n | 33 | 35 | 34 | 23 | 32 | 13 |
| Height (m) | 1.82 (0.09) | 1.85 (0.08) | 1.82 (0.09) | 1.79 (0.09) | 1.79 (0.09) | 1.76 (0.07)* |
| Mass (kg) | 89.6 (17.4) | 101.2 (17.1)* | 96.8 (22.2) | 99.5 (25.5) | 92.6 (14.8) | 85.1 (14.3) |
| BMI (kg/m2) | 27.0 (4.1) | 29.4 (4.6)* | 28.9 (5.1) | 30.7 (5.6)† | 28.8 (3.2) | 27.4 (3.8) |
| Lean mass (kg) | 60.6 (11.3) | 65.1 (14.7) | 61.6 (10.3) | 57.6 (10.5) | 55.2 (9.4) | 49.9 (8.6)* |
| Fat (%) | 26.8 (5.9) | 28.3 (4.2) | 29.2 (5.5) | 33.9 (5.6)‡ | 33.4 (4.8)‡ | 32.7 (4.2)† |
| Whole-body aBMD (g/cm2) | 1.32 (0.11) | 1.35 (0.12) | 1.36 (0.17) | 1.25 (0.30) | 1.27 (0.12) | 1.25 (0.11) |
| Hip aBMD (g/cm2) | 1.07 (0.15) | 1.04 (0.11) | 1.06 (0.18) | 1.05 (0.14) | 0.99 (0.14)* | 0.96 (0.09)* |
Values indicate mean (SD), except for frequency data
p <0.05 vs. age group 30–39 years
p <0.01 vs. age group 30–39 years
p <0.001 vs. age group 30–39 years
Age-related changes in DXA measures of the proximal humerus
The association between DXA measures of the proximal humerus and age was best described as a linear function (Figure 2). There was progressive enlargement of the proximal humerus with age as indicated by a 1.9% increase in projected bone area per decade beyond age 30–39 years (p<0.001) (Table 2). The gradual increase in bone area coupled with a 4.8% decline in BMC per decade (p<0.001) resulted in a 5.8% decline in DXA-derived aBMD per decade beyond age 30–39 years (p<0.001).
Figure 2.

Scatterplots illustrating the relationship between age and DXA measures of proximal humerus: A) bone area, B) bone mineral content [BMC], and C) areal bone mineral density [aBMD]. Curve fitting revealed age and DXA measures of proximal humerus bone health were linearly related, as opposed to quadratic, cubic, exponential or logarithmic.
Table 2.
Age-related changes in DXA measures of the proximal humerus
| Mean (SD) 30–39 years |
Predicted change per decadea
|
Age correl.b | ||
|---|---|---|---|---|
| Absolute change (95% CI) | Percent change (95% CI) | |||
| Area (cm2) | 30.6 (3.5) | 0.58 (0.36, 0.79)‡ | 1.9 (1.2, 2.6)‡ | 0.74 |
| BMC (g) | 26.5 (6.7) | −1.26 (−1.86, −0.66)‡ | −4.8 (−7.0, −2.5)‡ | −0.51 |
| aBMD (g/cm2) | 0.86 (0.16) | −0.05 (−0.06, −0.03)‡ | −5.8 (−7.0, −3.5)‡ | −0.44 |
Change with age while holding height (area) or body mass (BMC and aBMD) constant
Pearson’s correlation coefficient while holding height (area) or body mass (BMC and aBMD) constant
p <0.001 for predicted change per decade
BMC = bone mienral content; aBMD = areal bone mineral density
Age-related changes in pQCT measures of the proximal humerus
Representative pQCT images of the proximal humerus are shown in Figure 3. pQCT measures of the proximal humerus were linearly related with age (Figure 4). There was a small (−0.8%), yet significant decline in Ct.vBMD with advancing age which contributed to a 2.9% loss of Ct.BMC with each decade of aging beyond age 30–39 years (all p<0.001) (Table 3). Tb.BMC accounted for only 11.7% of total BMC in individuals aged 30–39 years and there was no significant change in Tb.BMC with advancing age (p=0.22). There was expansion of the proximal humerus with age as indicated by 3.0% and 1.7% increases in Tt.Ar and Ps.Pm with each decade of aging beyond age 30–39 years, respectively (p<0.05). The increase in bone size with age was coupled with progressive endosteal resorption, as indicated by a 2.9% per decade increase in Es.Pm (p<0.01). The more rapid loss of bone on the endosteal surface relative to gain on the periosteal surface resulted in 1.6% and 3.3% per decade declines in Ct.Ar and Ct.Th beyond age 30–39 years, respectively (all p<0.01). The net result of proximal humerus density, mass and structural changes with aging was progressive loss of bone strength, with BSIc decreasing at a rate of 5.2% per decade beyond age 30–39 years.
Figure 3.

Representative pQCT images of the proximal humerus in a: A) 33-year-old and B) 81-year-old participant. Images of these participants were chosen as their data approximated regression lines describing the association between proximal humerus pQCT measures and age. Note the general absence of trabecular bone at the region assessed in both images, and the larger total cross sectional area and reduced cortical thickness in B.
Figure 4.

Scatterplots illustrating the relationship between age and pQCT measures of proximal humerus: A) cortical volumetric BMD [Ct.vBMD], B) cortical BMC [Ct.BMC], C) trabecular BMC [Tb.BMC], D) total area [Tt.Ar], E) cortical area [Ct.Ar], F) periosteal perimeter [Ps.Pm], G) endosteal perimeter [Es.Pm]; H) cortical thickness [Ct.Th], I) polar strength-strain index [SSIP], and J) bone strength index [BSI]. Curve fitting revealed age and pQCT measures of proximal humerus bone health were linearly related, as opposed to quadratic, cubic, exponential or logarithmic.
Table 3.
Age-related changes in pQCT measures of the proximal humerus
| Mean (SD) 30–39 years |
Predicted change per decadea
|
Age correl.b | ||
|---|---|---|---|---|
| Absolute change (95% CI) | Percent change (95% CI) | |||
| Density | ||||
| Ct.vBMD (mg/cm3) | 1129.3 (18.3) | −8.80 (−12.4, −5.23)‡ | −0.78 (−1.1, −0.46)‡ | −0.36 |
| Mass | ||||
| Ct.BMC (mg/mm) | 216.0 (26.4) | −6.17 (−8.95, −3.39)‡ | −2.9 (−4.1, −1.6)‡ | −0.48 |
| Tb.BMC (mg/mm) | 28.7 (16.0) | −0.90 (−2.32, 0.53) | −3.1 (−8.1, 1.8) | −0.32 |
| Structure | ||||
| Tt.Ar (mm2) | 502.9 (112.6) | 15.0 (2.9, 27.2)* | 3.0 (0.58, 5.4)* | 0.32 |
| Ct.Ar (mm2) | 191.3 (23.1) | −3.05 (−5.34, −0.77)† | −1.6 (−2.8, −0.40)† | −0.47 |
| Ps.Pm (mm) | 75.6 (8.5) | 1.30 (0.31, 2.29)* | 1.7 (0.41, 3.0)* | 0.35 |
| Es.Pm (mm) | 61.7 (10.3) | 1.77 (0.66, 2.87)† | 2.9 (1.1, 4.7)† | 0.31 |
| Ct.Th (mm) | 2.75 (0.40) | −0.09 (−0.14, −0.05)‡ | −3.3 (−5.1, −1.8)‡ | −0.32 |
| Strength | ||||
| SSIP (mm3) | 1834.5 (381.3) | 0.49 (−31.3, 32.2) | 0.03 (−1.7, 1.8) | 0.50 |
| BSIC (mg2/mm4) | 105.6 (24.1) | −5.45 (−8.03, −2.86)‡ | −5.2 (−7.6, −2.7)‡ | 0.40 |
Change with age while holding body mass (mass measures) or height (structure and strength measures) constant
Pearson’s correlation coefficient while holding height (area) or body mass (BMC and aBMD) constant
p <0.05;
p <0.01;
p <0.001 for predicted change per decade
Ct.vBMD = cortical volumetric bone mineral density; Ct.BMC = cortical bone mineral content; Tb.BMC = trabecualr bone mineral content; Tt.Ar = total area; Ct.Ar = cortical area; Ps.Pm = periosteal perimeter; Es.Pm = endosteal perimeter; Ct.Th = cortical thickness; SSIP = polar strength-strain index; BSIC = bone strength index for compression
DISCUSSION
This cross-sectional study used predictions from regression models to estimate age-related bone changes at the proximal humerus in healthy, white males. Measures of proximal humerus bone health were obtained using a combination of DXA and pQCT techniques. DXA provided a global picture of bone quantity within the proximal humerus, including the humeral head, greater tubercle, and anatomical and surgical necks. Measures represented a composite of cortical and trabecular bone changes because the planar nature of DXA limits its ability to segregate bone tissue into compartments. Regression models estimated considerable age-related loss of DXA measured bone quantity at the proximal humerus, with aBMD modeled to decline by 29% (95% CI, 17.5–35.0%) in the 50 years between ages 30 and 80 years. The magnitude of decline is comparable, but higher than data reported by Doetsch et al. (14) who showed healthy Danish women aged 56–81 years had 17% lower DXA measured aBMD at the proximal humerus compared to a cohort aged 30–39 years. The reason for the higher estimated magnitude of decline in the current study may relate to the older age of subjects in our oldest (80+ years) cohort.
Age-related changes in proximal humerus DXA measures in the current study likely resulted from a combination of cortical and trabecular bone changes. Cortical bone changes were confirmed by pQCT measures. pQCT has the benefit of being able to distinguish between cortical and trabecular bone compartments, as well as providing measures of bone structure and estimated bone strength. pQCT measures at the site assessed indicated aging was associated with both proximal humerus intracortical bone loss (as modeled by an age-related decline in Ct.vBMD) and bone loss from the endosteal surface (as modeled by an age-related increase in Es.Pm). Periosteal bone apposition occurred with aging (as modeled by age-related increases in Tt.Ar and Ps.Pm), but the rate of periosteal expansion was unable to match the rate of endosteal expansion. The latter was indicated by the modeled age-related decline in proximal humerus Ct.Ar and Ct.Th. The net result of the density, mass and structural changes was a 26% (95% CI, 13.5–38.0%) decline in pQCT estimated bone strength (BSIc) in the 50 years between ages 30 and 80 years at the proximal humerus site assessed.
pQCT was able to estimate age-related changes in cortical bone properties at a site within the proximal humerus, with cortical bone being an important determinant of fracture at sites prone to osteoporotic fracture (24). However, pQCT was not useful in the current study in modeling age-related changes in trabecular bone. We took tomographic slices at 80% of humeral length proximal from its distal end, which approximates the surgical neck of the proximal humerus. Forty percent of displaced fractures of the proximal humerus occur at the surgical neck in individuals aged over 75 years (25), with this site being assessed as it was the most accessible proximal site in all subjects. pQCT is principally designed to assess distal peripheral sites, with the physical constraints of the pQCT machine making it difficult to position the upper extremity of subjects any further within the instrument’s gantry so as to assess sites more proximal than that assessed. The surgical neck of the humerus is principally constructed of cortical bone with the preponderance of trabecular bone in the proximal humerus being located more proximally within the humeral head (13, 26). Reflecting the lack of trabecular bone at the assessed site, trabecular bone accounted for less than 12% of total bone mass in individuals aged 30–39 years in the current study. The low amount of trabecular bone in our youngest cohort, combined with any trabecularization of cortical bone on the endosteal surface with advancing age (27), likely explains the absence of an age-related change in Tb.BMC in the current study.
Although we were unable to reveal age-related changes in trabecular bone properties within the proximal humerus, others have shown that such changes occur (13, 15, 17). Most noteably, data from Krappinger et al. (15) indicated trabecular BMD within the humeral head declined by 46% in the 50 years between ages 30 and 80 years, as assessed by conventional CT imaging. Meanwhile, Barvencik et al. (13) demonstrated age-related reductions in trabecular bone fraction, number and thickness within the humeral head, anatomical neck and greater tubercle regions, as assessed by histomorphometric measures in cadaver humerii. These microarchitectural changes likely contribute to osteoporotic fracture risk in the proximal humerus, and are also important to consider with regard to stabilizing proximal humerus fractures with internal fixation.
The age-related changes in proximal humerus bone health are consistent with those observed at other osteoporotic prone sites. In particular, recent studies utilizing high-resolution pQCT reported similar rates of age-related bone changes at the distal radius in men, with progressive cortical thinning combined with overall bone expansion (22, 28). The similar rates of change observed at multiple sites raises the question of the relationship between bone status at each site. There is a clear relationship between proximal humerus bone health and bone health at other sites. For instance, there was a linear relationship between DXA-measured hip and proximal humerus aBMD in the current study (r2 = 0.26, p<0.001 [data not shown]), similar to previously reported by Doetsch et al. (14). This relationship may explain why femoral neck aBMD is an independent risk factor for proximal humerus fracture (11, 12, 29). It also may explain why proximal humerus fracture is predictive of subsequent hip, forearm and spine fracture (30).
The current study extends knowledge regarding age-related changes in bone health at the proximal humerus; however, the data are not without limitations. The most obvious limitation is the cross-sectional nature of the study which limits the ability to determine true age-related changes in proximal humerus bone health. In the absence of performing longitudinal assessments, it is possible that predicted changes in proximal humerus bone health based on our regression analyses were influenced by secular variations across ages. We controlled for secular trends in body and bone size (31) by including body mass and height in our models. This approach may not have been sufficient to control all secular variations; however, previous work reported good agreement between the rate of bone loss predicted from cross-sectional data and true rate of bone loss determined from 16 years of longitudinal data (32).
A second limitation of the current study is its investigation of a discrete population. White males were investigated as data were acquired as part of a broader study investigating this population. Bone health is important to assess in males as they account for 1-in-3 osteoporotic fractures (5) and are underrepresented in osteoporosis research. However, the data are not directly translatable to females who have differing rates of age-related bone loss, particularly during the menopausal transition (33). Similarly, the current data are not directly translatable to individuals of other racial or ethnic backgrounds, with previous data suggesting rates of age-related bone loss may differ between races and ethnicities (34, 35).
A further potential limitation is the use of pQCT to assess a site with a relatively thin cortical shell. pQCT measures of thin cortices increases the potential for partial volume effects whereby voxels at the periosteal and endocortical borders are incompletely filled and contain both bone and soft tissue. The result is underestimation of vBMD at sites with thin cortices. However, we do not believe partial volume effects substantially influenced conclusions in the current study. Previous studies demonstrated accurate CT-acquired density and thickness measures for cortical thicknesses of ≥2 mm when using a voxel resolution of 400 μm (36–38). The majority of our cortical thickness measures were above this threshold and we used a higher voxel resolution (300 μm). The higher resolution further minimized partial volume effects, with Prevrhal et al. (38) showing accurate cortical density measures with cortical thicknesses larger than four times the resolution (≥1.2 mm in our case).
Final limitations of the current study include the lack of regional assessment of the pQCT scans and the DXA protocol used to assess proximal humerus bone health. It is possible age-related changes within the proximal humerus vary in different polar regions of the bone cross-section, as has been demonstrated in the femoral neck (39). Such regional variation may have implications for proximal humerus fracture risk. In terms of DXA outcomes, we used a fan-beam instrument and spine scan protocol to assess the proximal humerus. It is possible age-related changes in DXA measures were impacted by varying body weights/sizes between age groups as DXA measurements on fan-beam instruments are sensitive to bone height above the table. Similarly, our DXA measures may have been influenced by the use of a spine scan protocol combined with an analysis approach that included regions devoid of tissue (i.e. containing only air). The protocol and analysis approach utilized allows for large variations in soft tissue thickness along the horizontal scan lines potentially influencing beam hardening and subsequent aBMD measures.
The current cross-sectional study used predictions from regression models to estimate age-related bone changes at the proximal humerus in healthy, white males. DXA measures provided a global picture of bone quantity within the proximal humerus, including the humeral head, greater tubercle, and anatomical and surgical necks, whereas pQCT provided measures of cortical bone density, mass, structure and estimated bone strength at the surgical neck. The data suggest that aging is associated with considerable loss of bone mass, structural deterioration and reduced bone strength at the proximal humerus. The declines modeled may contribute to osteoporotic fracture at the proximal humerus during aging, especially when coupled with a traumatic event such as a fall.
Summary.
The proximal humerus is a common site for osteoporotic fracture. The current study demonstrates the rate of age-related decline in proximal humerus bone health. The data suggest aging is associated with considerable loss of bone mass, structural deterioration and reduced bone strength at the proximal humerus.
Acknowledgments
This contribution was made possible by support from the National Institutes of Health (R01 AR057740 and R15 AR056858 [S.J.W.]; K01 AR054408 [R.K.F.]).
Footnotes
Statement of competing interests: No competing interests
The authors have no conflicts of interest.
References
- 1.Burge R, Dawson-Hughes B, Solomon DH, Wong JB, King A, Tosteson A. Incidence and economic burden of osteoporosis-related fractures in the United States, 2005–2025. J Bone Miner Res. 2007;22:465–475. doi: 10.1359/jbmr.061113. [DOI] [PubMed] [Google Scholar]
- 2.Calvo E, Morcillo D, Foruria AM, Redondo-Santamaria E, Osorio-Picorne F, Caeiro JR. Nondisplaced proximal humeral fractures: high incidence among outpatient-treated osteoporotic fractures and severe impact on upper extremity function and patient subjective health perception. J Shoulder Elbow Surg. 2011;20:795–801. doi: 10.1016/j.jse.2010.09.008. [DOI] [PubMed] [Google Scholar]
- 3.Lauritzen JB, Schwarz P, Lund B, McNair P, Transbol I. Changing incidence and residual lifetime risk of common osteoporosis-related fractures. Osteoporos Int. 1993;3:127–132. doi: 10.1007/BF01623273. [DOI] [PubMed] [Google Scholar]
- 4.Seeley DG, Browner WS, Nevitt MC, Genant HK, Scott JC, Cummings SR. Which fractures are associated with low appendicular bone mass in elderly women? The Study of Osteoporotic Fractures Research Group. Ann Intern Med. 1991;115:837–842. doi: 10.7326/0003-4819-115-11-837. [DOI] [PubMed] [Google Scholar]
- 5.Johnell O, Kanis JA. An estimate of the worldwide prevalence and disability associated with osteoporotic fractures. Osteoporos Int. 2006;17:1726–1733. doi: 10.1007/s00198-006-0172-4. [DOI] [PubMed] [Google Scholar]
- 6.Johnell O, Kanis JA, Oden A, Sernbo I, Redlund-Johnell I, Petterson C, De Laet C, Jonsson B. Mortality after osteoporotic fractures. Osteoporos Int. 2004;15:38–42. doi: 10.1007/s00198-003-1490-4. [DOI] [PubMed] [Google Scholar]
- 7.Olsson C, Nordquist A, Petersson CJ. Long-term outcome of a proximal humerus fracture predicted after 1 year: a 13-year prospective population-based follow-up study of 47 patients. Acta Orthop. 2005;76:397–402. [PubMed] [Google Scholar]
- 8.Kannus P, Palvanen M, Niemi S, Parkkari J, Jarvinen M, Vuori I. Osteoporotic fractures of the proximal humerus in elderly Finnish persons: sharp increase in 1970–1998 and alarming projections for the new millennium. Acta Orthop Scand. 2000;71:465–470. doi: 10.1080/000164700317381144. [DOI] [PubMed] [Google Scholar]
- 9.Chu SP, Kelsey JL, Keegan TH, Sternfeld B, Prill M, Quesenberry CP, Sidney S. Risk factors for proximal humerus fracture. Am J Epidemiol. 2004;160:360–367. doi: 10.1093/aje/kwh224. [DOI] [PubMed] [Google Scholar]
- 10.Palvanen M, Kannus P, Parkkari J, Pitkajarvi T, Pasanen M, Vuori I, Jarvinen M. The injury mechanisms of osteoporotic upper extremity fractures among older adults: a controlled study of 287 consecutive patients and their 108 controls. Osteoporos Int. 2000;11:822–831. doi: 10.1007/s001980070040. [DOI] [PubMed] [Google Scholar]
- 11.Lee SH, Dargent-Molina P, Breart G. Risk factors for fractures of the proximal humerus: results from the EPIDOS prospective study. J Bone Miner Res. 2002;17:817–825. doi: 10.1359/jbmr.2002.17.5.817. [DOI] [PubMed] [Google Scholar]
- 12.Nguyen TV, Center JR, Sambrook PN, Eisman JA. Risk factors for proximal humerus, forearm, and wrist fractures in elderly men and women: the Dubbo Osteoporosis Epidemiology Study. Am J Epidemiol. 2001;153:587–595. doi: 10.1093/aje/153.6.587. [DOI] [PubMed] [Google Scholar]
- 13.Barvencik F, Gebauer M, Beil FT, Vettorazzi E, Mumme M, Rupprecht M, Pogoda P, Wegscheider K, Rueger JM, Pueschel K, Amling M. Age- and sex-related changes of humeral head microarchitecture: histomorphometric analysis of 60 human specimens. J Orthop Res. 2010;28:18–26. doi: 10.1002/jor.20957. [DOI] [PubMed] [Google Scholar]
- 14.Doetsch AM, Faber J, Lynnerup N, Watjen I, Bliddal H, Danneskiold-Samsoe B. Bone mineral density measurement over the shoulder region. Calcif Tissue Int. 2002;71:308–314. doi: 10.1007/s00223-001-2082-y. [DOI] [PubMed] [Google Scholar]
- 15.Krappinger D, Roth T, Gschwentner M, Suckert A, Blauth M, Hengg C, Kralinger F. Preoperative assessment of the cancellous bone mineral density of the proximal humerus using CT data. Skeletal Radiol. 2011 doi: 10.1007/s00256-011-1174-7. (in press) [DOI] [PubMed] [Google Scholar]
- 16.Tingart MJ, Apreleva M, von Stechow D, Zurakowski D, Warner JJ. The cortical thickness of the proximal humeral diaphysis predicts bone mineral density of the proximal humerus. J Bone Joint Surg Br. 2003;85:611–617. doi: 10.1302/0301-620x.85b4.12843. [DOI] [PubMed] [Google Scholar]
- 17.Yamada M, Briot J, Pedrono A, Sans N, Mansat P, Mansat M, Swider P. Age- and gender-related distribution of bone tissue of osteoporotic humeral head using computed tomography. J Shoulder Elbow Surg. 2007;16:596–602. doi: 10.1016/j.jse.2007.01.006. [DOI] [PubMed] [Google Scholar]
- 18.Neer CS., 2nd Displaced proximal humeral fractures. I. Classification and evaluation. J Bone Joint Surg Am. 1970;52:1077–1089. [PubMed] [Google Scholar]
- 19.Kontulainen SA, Johnston JD, Liu D, Leung C, Oxland TR, McKay HA. Strength indices from pQCT imaging predict up to 85% of variance in bone failure properties at tibial epiphysis and diaphysis. J Musculoskelet Neuronal Interact. 2008;8:401–409. [PubMed] [Google Scholar]
- 20.Kontulainen S, Sievanen H, Kannus P, Pasanen M, Vuori I. Effect of long-term impact-loading on mass, size, and estimated strength of humerus and radius of female racquet-sports players: a peripheral quantitative computed tomography study between young and old starters and controls. J Bone Miner Res. 2002;17:2281–2289. doi: 10.1359/jbmr.2002.17.12.2281. [DOI] [PubMed] [Google Scholar]
- 21.Wilhelm G, Felsenberg D, Bogusch G, Willnecker J, Thaten J, Gummert P. Biomechanical examinations for validation of the bone strength strain index SSI, calculated by peripheral quantitative computed tomography. In: Lyritis G, editor. Musculoskeletal Interactions. Hylonome, Athens; 2001. pp. 105–110. [Google Scholar]
- 22.Macdonald H, Kontulainen S, Petit M, Janssen P, McKay H. Bone strength and its determinants in pre- and early pubertal boys and girls. Bone. 2006;39:598–608. doi: 10.1016/j.bone.2006.02.057. [DOI] [PubMed] [Google Scholar]
- 23.Rauch F, Schoenau E. Peripheral quantitative computed tomography of the proximal radius in young subjects--new reference data and interpretation of results. J Musculoskelet Neuronal Interact. 2008;8:217–226. [PubMed] [Google Scholar]
- 24.Burr DB. Cortical bone: a target for fracture prevention? Lancet. 2010;375:1672–1673. doi: 10.1016/S0140-6736(10)60444-8. [DOI] [PubMed] [Google Scholar]
- 25.Bengner U, Johnell O, Redlund-Johnell I. Changes in the incidence of fracture of the upper end of the humerus during a 30-year period. A study of 2125 fractures. Clin Orthop Relat Res. 1988:179–182. [PubMed] [Google Scholar]
- 26.Tingart MJ, Bouxsein ML, Zurakowski D, Warner JP, Apreleva M. Three-dimensional distribution of bone density in the proximal humerus. Calcif Tissue Int. 2003;73:531–536. doi: 10.1007/s00223-002-0013-9. [DOI] [PubMed] [Google Scholar]
- 27.Zebaze RM, Ghasem-Zadeh A, Bohte A, Iuliano-Burns S, Mirams M, Price RI, Mackie EJ, Seeman E. Intracortical remodelling and porosity in the distal radius and post-mortem femurs of women: a cross-sectional study. Lancet. 2010;375:1729–1736. doi: 10.1016/S0140-6736(10)60320-0. [DOI] [PubMed] [Google Scholar]
- 28.Khosla S, Riggs BL, Atkinson EJ, Oberg AL, McDaniel LJ, Holets M, Peterson JM, Melton LJ., 3rd Effects of sex and age on bone microstructure at the ultradistal radius: a population-based noninvasive in vivo assessment. J Bone Miner Res. 2006;21:124–131. doi: 10.1359/JBMR.050916. [DOI] [PMC free article] [PubMed] [Google Scholar]
- 29.Nguyen TV, Center JR, Eisman JA. Femoral neck bone loss predicts fracture risk independent of baseline BMD. J Bone Miner Res. 2005;20:1195–1201. doi: 10.1359/JBMR.050215. [DOI] [PubMed] [Google Scholar]
- 30.Johnell O, Kanis JA, Oden A, Sernbo I, Redlund-Johnell I, Petterson C, De Laet C, Jonsson B. Fracture risk following an osteoporotic fracture. Osteoporos Int. 2004;15:175–179. doi: 10.1007/s00198-003-1514-0. [DOI] [PubMed] [Google Scholar]
- 31.Cole TJ. The secular trend in human physical growth: a biological view. Econ Hum Biol. 2003;1:161–168. doi: 10.1016/S1570-677X(02)00033-3. [DOI] [PubMed] [Google Scholar]
- 32.Melton LJ, 3rd, Atkinson EJ, O’Connor MK, O’Fallon WM, Riggs BL. Determinants of bone loss from the femoral neck in women of different ages. J Bone Miner Res. 2000;15:24–31. doi: 10.1359/jbmr.2000.15.1.24. [DOI] [PubMed] [Google Scholar]
- 33.Riggs BL, Wahner HW, Seeman E, Offord KP, Dunn WL, Mazess RB, Johnson KA, Melton LJ., 3rd Changes in bone mineral density of the proximal femur and spine with aging. Differences between the postmenopausal and senile osteoporosis syndromes. J Clin Invest. 1982;70:716–723. doi: 10.1172/JCI110667. [DOI] [PMC free article] [PubMed] [Google Scholar]
- 34.Cauley JA, Lui LY, Stone KL, Hillier TA, Zmuda JM, Hochberg M, Beck TJ, Ensrud KE. Longitudinal study of changes in hip bone mineral density in Caucasian and African-American women. J Am Geriatr Soc. 2005;53:183–189. doi: 10.1111/j.1532-5415.2005.53101.x. [DOI] [PubMed] [Google Scholar]
- 35.Luckey MM, Wallenstein S, Lapinski R, Meier DE. A prospective study of bone loss in African-American and white women--a clinical research center study. J Clin Endocrinol Metab. 1996;81:2948–2956. doi: 10.1210/jcem.81.8.8768857. [DOI] [PubMed] [Google Scholar]
- 36.Binkley TL, Specker BL. pQCT measurement of bone parameters in young children: validation of technique. J Clin Densitom. 2000;3:9–14. doi: 10.1385/jcd:3:1:009. [DOI] [PubMed] [Google Scholar]
- 37.Hangartner TN, Gilsanz V. Evaluation of cortical bone by computed tomography. J Bone Miner Res. 1996;11:1518–1525. doi: 10.1002/jbmr.5650111019. [DOI] [PubMed] [Google Scholar]
- 38.Prevrhal S, Engelke K, Kalender WA. Accuracy limits for the determination of cortical width and density: the influence of object size and CT imaging parameters. Phys Med Biol. 1999;44:751–764. doi: 10.1088/0031-9155/44/3/017. [DOI] [PubMed] [Google Scholar]
- 39.Poole KE, Mayhew PM, Rose CM, Brown JK, Bearcroft PJ, Loveridge N, Reeve J. Changing structure of the femoral neck across the adult female lifespan. J Bone Miner Res. 2010;25:482–491. doi: 10.1359/jbmr.090734. [DOI] [PubMed] [Google Scholar]