Figure 6.
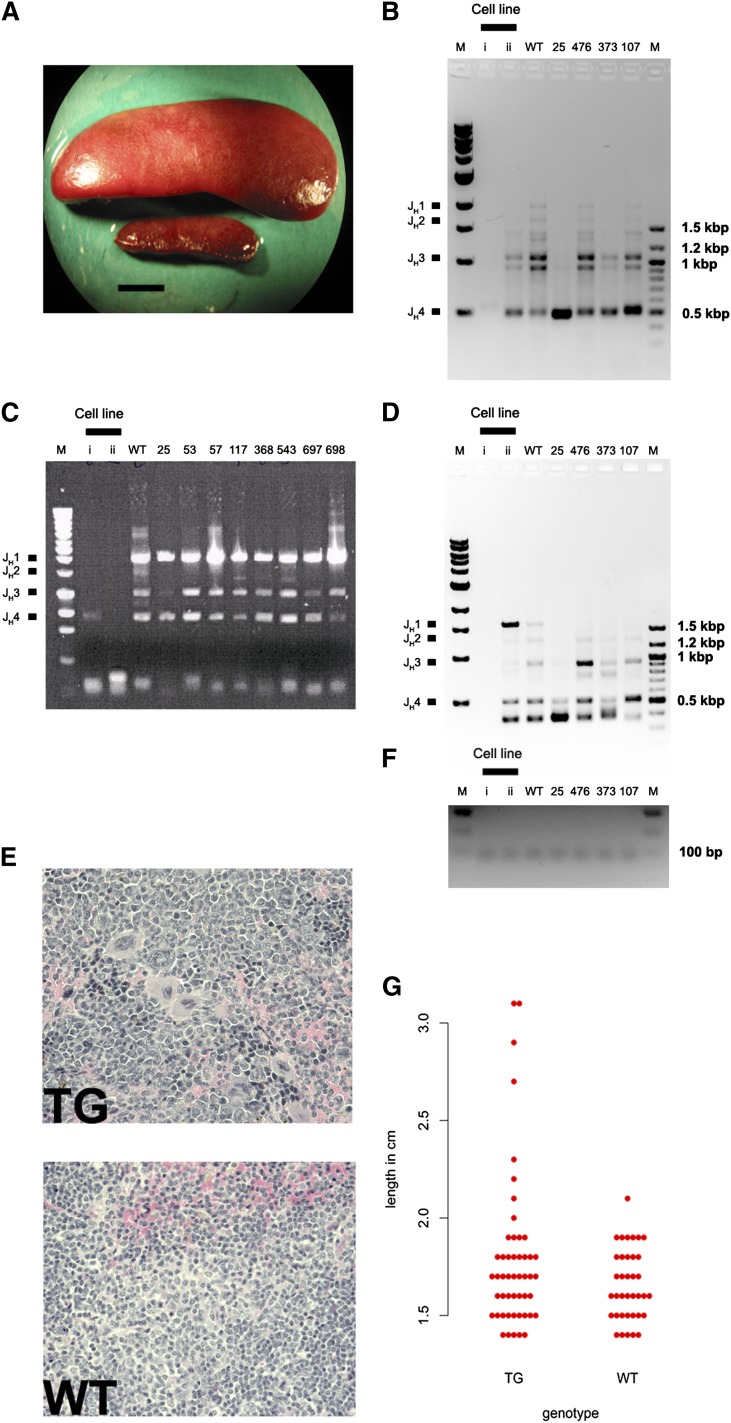
Monoclonal IgH rearrangement in tumors from KSHV latency locus transgenic mice was evaluated using PCR. (A) Splenomegaly found in a KSHV latency locus transgenic mouse with the spleen of a wild-type (WT) mouse. Bar represents 0.5 cm. (B-D) PCR products of splenic genomic DNAs from latency transgenic mice, 2 mouse lymphoma cell lines (i and ii), and 1 C57BL/6 mouse (WT) were resolved on a 1% Tris-acetate-EDTA-agarose gel. The WT lane shows 4 rearrangements of VDJH1, VDJH2, VDJH3, and VDJH4 (B-D) using DH5 (B), Dq52 (C), or VH7183 primers (D). ApoB was amplified to demonstrate an equal amount of genomic DNA was used for PCR (F). Cell lines i and ii mean mouse lymphoma cell lines; K46 and M12. M; 1-kb or 100-bp DNA ladder. Spleen architectures of the same mouse as in Figure 6A (E, TG) and littermate control mouse (E, WT) revealed by hematoxylin and eosin staining. Magnification ×400. (G) Spleen sizes of the KSHV latency transgenic (TG) and littermate control mice (WT) were plotted.

