Abstract
Background
Participation and performance trends for athletes by age group have been investigated for marathoners and ultramarathoners competing in races up to 161 km, but not for longer distances of more than 200 km.
Methods
Participation and performance trends in athletes by age group in the Badwater (217 km) and Spartathlon (246 km) races were compared from 2000 to 2012.
Results
The number of female and male finishers increased in both races across years (P < 0.05). The age of the annual five fastest men decreased in Badwater from 42.4 ± 4.2 years to 39.8 ± 5.7 years (r2 = 0.33, P = 0.04). For women, the age remained unchanged at 42.3 ± 3.8 years in Badwater (P > 0.05). In Spartathlon, the age of the annual five fastest finishers was unchanged at 39.7 ± 2.4 years for men and 44.6 ± 3.2 years for women (P > 0.05). In Badwater, running speed increased in men from 7.9 ± 0.7 km/hour to 8.7 ± 0.6 km/hour (r2 = 0.51, P < 0.01) and in women from 5.4 ± 1.1 km/hour to 6.6 ± 0.5 km/hour (r2 = 0.61, P < 0.01). In Spartathlon, running speed remained unchanged at 10.8 ± 0.7 km/hour in men and 8.7 ± 0.5 km/hour in women (P > 0.05). In Badwater, the number of men in age groups 30–34 years (r2 = 0.37, P = 0.03) and 40–44 years (r2 = 0.75, P < 0.01) increased. In Spartathlon, the number of men increased in the age group 40–44 years (r2 = 0.33, P = 0.04). Men in age groups 30–34 (r2 = 0.64, P < 0.01), 35–39 (r2 = 0.33, P = 0.04), 40–44 (r2 = 0.34, P = 0.04), and 55–59 years (r2 = 0.40, P = 0.02) improved running speed in Badwater. In Spartathlon, no change in running speed was observed.
Conclusion
The fastest finishers in ultramarathons more than 200 km in distance were 40–45 years old and have to be classified as “master runners” by definition. In contrast to reports of marathoners and ultramarathoners competing in races of 161 km in distance, the increase in participation and the improvement in performance by age group were less pronounced in ultramarathoners competing in races of more than 200 km.
Keywords: ultra-endurance, master runner, running speed, sex difference
Introduction
Endurance running became a mass phenomenon starting in the 1980s.1 The common running distances range from 10 km2,3 to ultramarathons between 100 miles4–6 and several thousand kilometers.7 An ultramarathon is defined as a running event involving a distance longer than the classical distance of 42.195 km for a marathon. The common ultramarathon distances are 50 km, 100 km, 50 miles, and 100 miles.8 There are also famous ultramarathons with distances longer than 200 km, such as the Spartathlon in Greece,9 or the Badwater held in Death Valley, CA, USA.10 Furthermore, running races may be held in cities,11 in mountains,12 and in the desert.13 While in earlier years mostly non-masters (younger than 35 years) competed in marathon races,14 the number of finishers of higher ages called “master athletes” is increasing.11 Master athletes are defined as athletes typically older than 35 years of age and systematically training for, and competing in organized forms of sport specifically designed for older adults.15
A few studies have investigated participation and performance trends of master runners mostly for distances up to marathon distance.11,14,16–18 Jokl et al examined the participation of master runners in the New York City Marathon over the 1983–1999 period.14 They showed for both sexes that the number of master runners increased at a greater rate than their younger counterparts. Furthermore, running times for the top 50 male and female finishers over the past two decades from 1983 to 1999, showed a significantly greater improvement in the master age groups than in the younger age groups, whose performance levels plateaued.14
Lepers and Cattagni reported an increase in participation and an improvement in performance in master runners in the New York City Marathon to a greater extent for women compared to men in the period 1980–2009.11 The running speed of master runners older than 64 years for men and 44 years for women increased significantly during the 1980–2009 period.11 For 100 km ultramarathoners, Knechtle et al reported an increase of the number of master finishers with an age-related decline in running speed at 60–64 years for both sexes.19
Besides participation trends in master runners, the age of peak running speed in marathoners20 and ultramarathoners12 was recently investigated. While the age of peak running speed was found to be at around 30 years in marathoners,20 it increased with the length (ie, duration) of the event to approximately 34–37 years in ultramarathoners.12 Generally, the age of peak performance in most endurance sports is maintained until the age of ~30–35 years, followed by a moderate decrease until between 35 and 70 years and then a progressively steeper decline after the age of ~70–75 years.3,21,22 This age of peak performance with an age-related decrease in performance has been shown to be independent of the distance and the sports discipline.16,17,23–25
The age of peak running speed was found to be higher in ultramarathoners6,12,19 compared to marathoners.20 For ultramarathoners, Knechtle et al recently showed for male and female 100 km ultramarathoners that the fastest runners were 30–40 years old for men and 30–54 years old for women.19 Hoffman and Wegelin reported that the fastest average running times in a 161 km ultramarathon, the Western States 100-Mile Endurance Run, were achieved by athletes aged 35–40 years.6 Reaburn and Dascombe hypothesized that maintaining both high-intensity and high-volume training could minimize the age-related decrease in running speed.15 Therefore, the definition used by Reaburn and Dascombe15 and World Masters Athletics26 that master runners were older than 35 years contradicts recent findings that the age of peak performance seemed to be above 35 years in ultramarathon races. Reaburn and Dascombe defined master athletes as athletes systematically training for and competing in a sport specifically designed for those over 35 years, but not for elite athletes.15 Although the exact age of peak ultrarunning speed has not been determined, running speed beyond the age of 55 years decreases in both sexes, with a more pronounced effect in women than in men.27
The participation and performance trends in master runners competing in ultramarathons longer than 161 km, such as Badwater and Spartathlon that cover distances of more than 200 km, are not known. The aim of the study was to analyze participation and performance trends in two major ultramarathons, Badwater and Spartathlon, held in North America and Europe, respectively, from 2000 to 2012, with a special emphasis on the age groups of the runners. Based upon present findings in the literature for marathoners and ultramarathoners, we hypothesized that (1) the number of athletes by age group would increase and (2) the performance of athletes by age group would improve over time in ultramarathons of more than 200 km in distance.
Methods
Performance and age were analyzed for all finishers in the Badwater and Spartathlon races between 2000 and 2012. The data set for this study was obtained from the race websites of Spartathlon9 and Badwater.10 This study was approved by the institutional review board of St Gallen, Switzerland, with a waiver of the requirement for informed consent given that the study involved the analysis of publicly available data.
Badwater
Badwater covers 217 km (135 miles) of highway nonstop across the Death Valley in California, USA. The event was first established as an official foot race in 1987 with five successful US participants. Since 1989, the race starts at Badwater, the lowest elevation in the western hemisphere at 85 m below sea level and finishes at the Mt Whitney Portals at 2530 m above sea level. The course includes a total of 3962 m of cumulative vertical ascent and 1433 m of cumulative descent. In Death Valley in mid-July the average daily highs reach approximately 47°C and temperatures over 50°C are common.28 There are no aid stations along the course and runners need to rely on their own support crew. The number of participants is limited to 90 competitors.
Spartathlon
Spartathlon, started in 1982, is a nonstop foot race covering 246 km (152 miles) from Athens to Sparta in Greece. Since 1983, the race has been held annually, each September. The course includes elevations that range from sea level to 1200 m above sea level. The cumulative gain of elevation is approximately 1650 m and the route runs on tarmac road, trail, or mountain footpath.9 The weather conditions during the race typically change between warm temperatures of about 27°C during the day and cold temperatures of about 5°C during the night. Aid stations are placed every 3–5 km and provide competitors with water and food. Each of the 75 race control points has its own time limitations and runners arriving later than the official closing time will be eliminated from the race. The number of starters is limited to 350.
Data analysis
Due to low participation in both races prior to 2000, only data between 2000 and 2012 were considered. Since we intended to analyze the change in age-related performance, all finishers who were ranked without age were excluded from the analysis. In order to compare performance between the two races, running speed was calculated as:
| (1) |
The changes in running performance and in the age of peak performance of the top five overall men and women runners were analyzed for both races. The sex-based effects on running performance were also analyzed. Sex difference was calculated as:
| (2) |
To facilitate reading, all sex differences were converted to absolute values. To analyze the changes in age-related performance, athletes were separated into age groups of 18–24, 25–29, 30–34, 35–39, 40–44, 45–49, 50–54, 55–59, 60–64, 65–69, 70–74, and 75–79 years. Since the absolute participation per age group was very low, we decided to analyze only the best annual performance (ie, fastest annual running speed) per age group, sex, and race.
Statistical analysis
In order to increase the reliability of the data analyses, each set of data was tested for normal distribution as well as for homogeneity of variances prior to statistical analyses. Normal distribution was tested using D’Agostino and Pearson omnibus normality tests and homogeneity of variances was tested using Levene’s test in the case of two groups and with Bartlett’s test in the case of more than two groups. To find significant changes in the development of a variable across years, linear regression analysis was used. To find significant differences between two groups, Student’s t-test was used in the case of normally distributed data (with additional Welch’s correction in the case of significantly different variances between the analyzed groups) and a Mann–Whitney test was used in the case of non-normally distributed data. Statistical analyses were performed using IBM SPSS Statistics (Version 19; IBM Corporation, Armonk, NY, USA) and GraphPad Prism (Version 5; GraphPad Software, La Jolla, CA, USA). Significance was accepted at P < 0.05 (two-sided for t-tests). Data in the text are given as mean ± standard deviation.
Results
Between 2000 and 2012, 663 men and 183 women finished Badwater and 1157 men and 141 women finished Spartathlon. The completion rate was higher in Badwater compared to Spartathlon (Table 1).
Table 1.
Starters, finishers, non-finishers, and non-finishers as a percentage of starters for both Badwater and Spartathlon
| Badwater
|
Spartathlon
|
|||||||
|---|---|---|---|---|---|---|---|---|
| Starters | Finishers | Non-finishers | Non-finishers as a % of starters | Starters | Finishers | Non-finishers | Non-finishers as a % of starters | |
| 2012 | 96 | 89 | 7 | 7.3 | 350 | 72 | 278 | 79.4 |
| 2011 | 94 | 81 | 13 | 13.8 | 350 | 143 | 207 | 59.1 |
| 2010 | 80 | 73 | 7 | 8.8 | 350 | 128 | 222 | 63.4 |
| 2009 | 86 | 75 | 11 | 12.8 | 350 | 133 | 217 | 62.0 |
| 2008 | 82 | 75 | 7 | 8.5 | 350 | 154 | 196 | 56.0 |
| 2007 | 84 | 78 | 6 | 7.1 | 350 | 125 | 225 | 64.3 |
| 2006 | 85 | 67 | 18 | 21.2 | 350 | 97 | 253 | 72.3 |
| 2005 | 81 | 67 | 14 | 17.3 | 350 | 102 | 248 | 70.9 |
| 2004 | 72 | 57 | 15 | 20.8 | 350 | 73 | 277 | 79.1 |
| 2003 | 73 | 46 | 27 | 37.0 | 350 | 84 | 266 | 76.0 |
| 2002 | 78 | 58 | 20 | 25.6 | 350 | 89 | 261 | 74.6 |
| 2001 | 71 | 55 | 16 | 22.5 | 350 | 82 | 268 | 76.6 |
| 2000 | 69 | 49 | 20 | 29.0 | 350 | 88 | 262 | 74.9 |
Change in participation
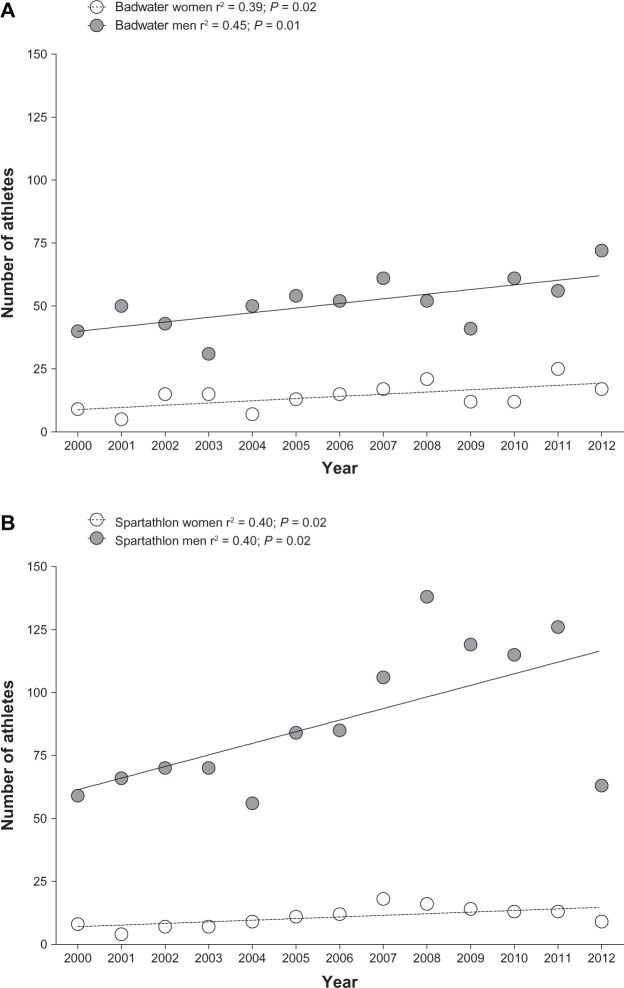
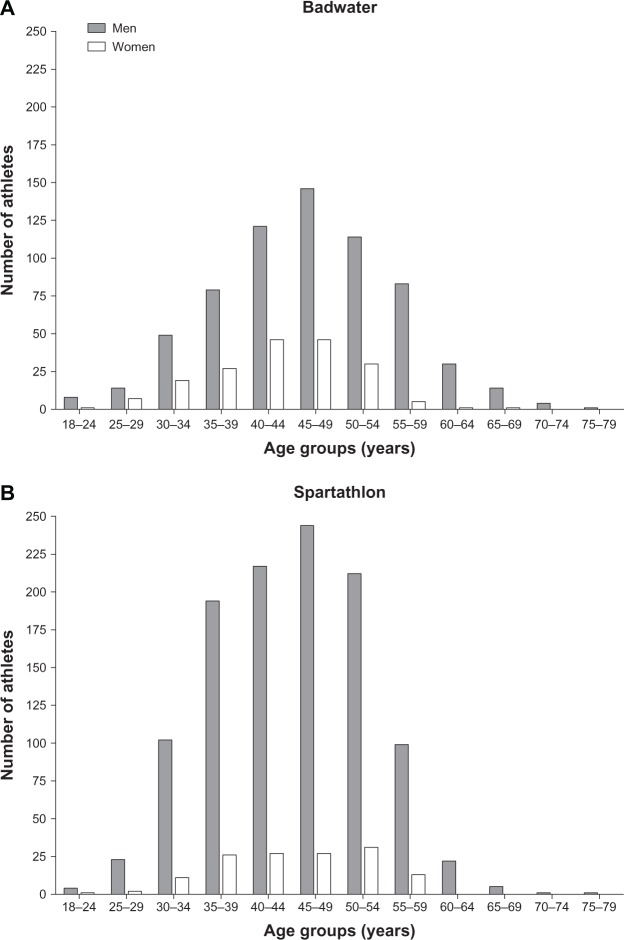
The number of both female and male finishes increased in both Badwater (Figure 1A) and Spartathlon (Figure 1B) across years. The age distribution of finishers is presented in Figure 2 for Badwater (Panel A) and Spartathlon (Panel B). In men the largest participation was in athletes in the age group 45–49 years in both races. For women, the largest participation was in age groups 40–44 and 45–49 years in Badwater, while in Spartathlon the largest participation was in the age group 50–54 years.
Figure 1.
Change in the number of female and male finishers in Badwater (Panel A) and Spartathlon (Panel B) across years.
Note: For both women and men, the number of finishers increased in both races.
Figure 2.
Number of male and female finishers in Badwater (A) and Spartathlon (B) sorted by age group.
Notes: In men the highest participation was in the age group 45–49 years in both races. For women, the highest participation was in the age groups 40–44 and 45–49 years in Badwater, while in Spartathlon the highest participation was in the age group 50–54 years.
Change in age of the annual top five finishers
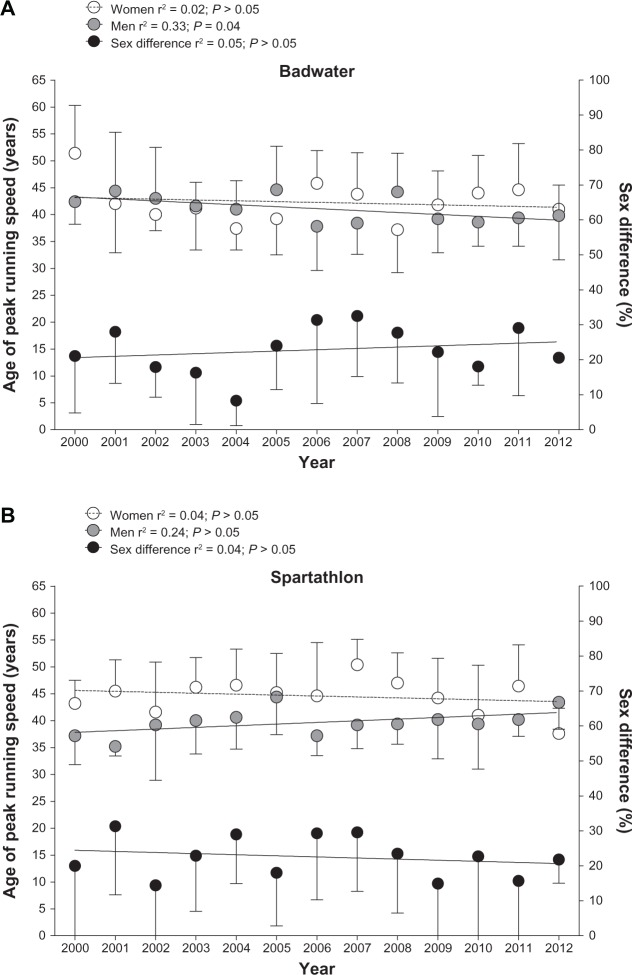
Over the years, the age of the annual five fastest men decreased in Badwater from 42.4 ± 4.2 years in 2002 to 39.8 ± 5.7 years in 2012 (Figure 3A). For women, the mean age of the annual five fastest finishers remained unchanged at 42.3 ± 3.8 years in Badwater. In Spartathlon (Figure 3B), the age of the annual five fastest finishers was unchanged at 39.7 ± 2.4 years for men and 44.6 ± 3.2 years for women.
Figure 3.
Age of the annual top five women and men in Badwater (Panel A) and in Spartathlon (Panel B).
Note: The age of the top five men decreased in Badwater over the years.
Change in running speed of the annual top five finishers
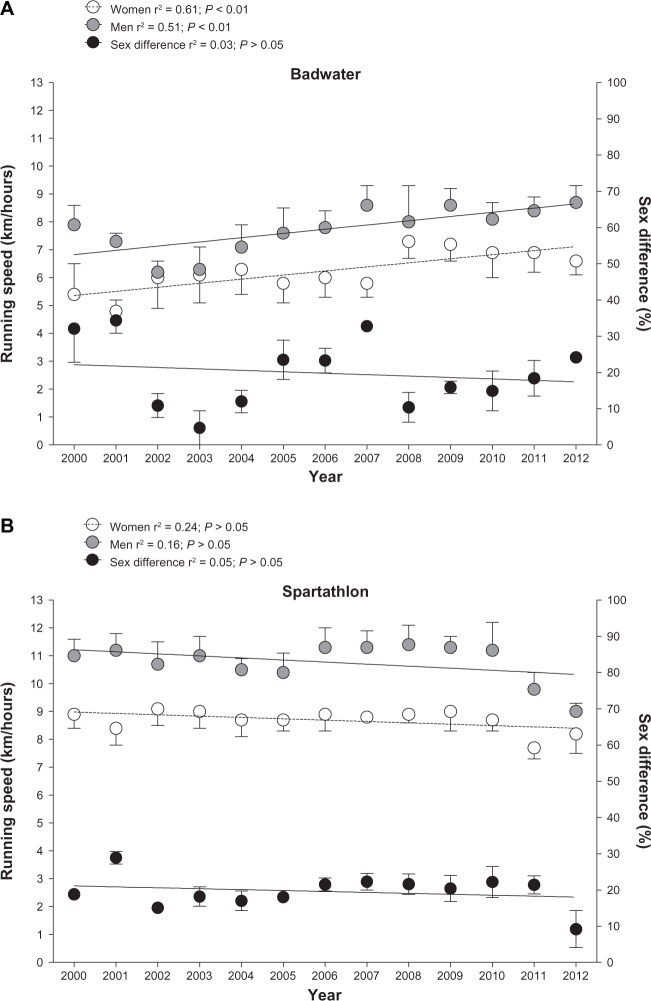
In Badwater, both women and men became faster over years (Figure 4A). The running speed in men increased from 7.9 ± 0.7 km/hour in 2000 to 8.7 ± 0.6 km/hour in 2012. In women, running speed increased from 5.4 ± 1.1 km/hour to 6.6 ± 0.5 km/hour. The sex difference in running speed remained stable at 19.8% ± 4.8%. In Spartathlon, running speed remained unchanged at 10.8 ± 0.7 km/hour for men and 8.7 ± 0.5 km/hour for women (Figure 4B). The sex difference in running speed remained unaltered at 19.6% ± 2.5%.
Figure 4.
Running speed of the annual top five women and men in Badwater (Panel A) and in Spartathlon (Panel B).
Note: Women and men became faster in Badwater, but not in Spartathlon.
Participation and performance trends for age group athletes
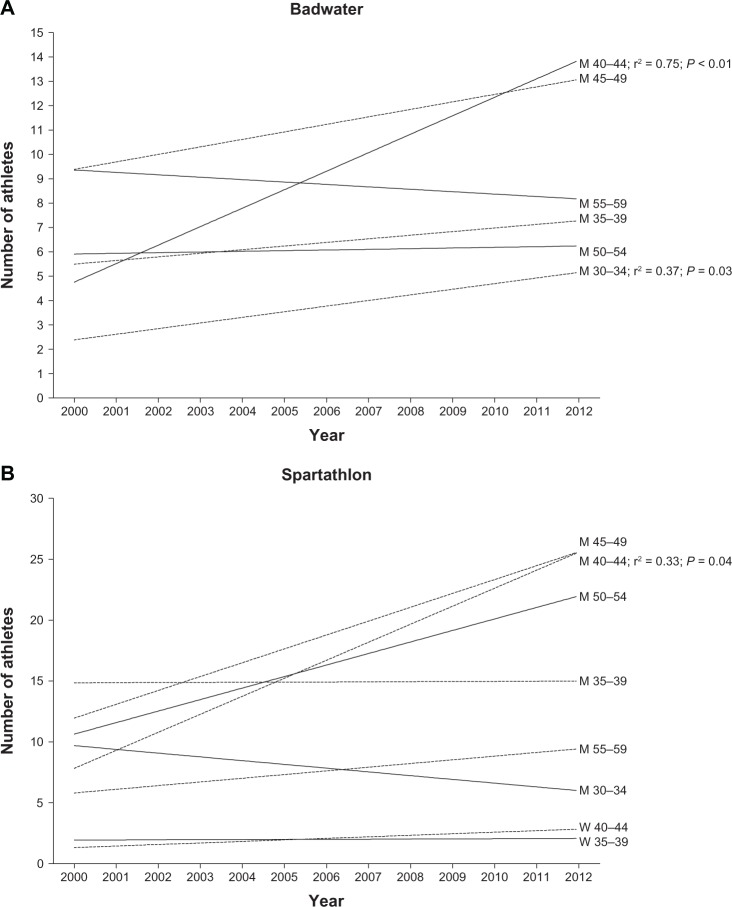
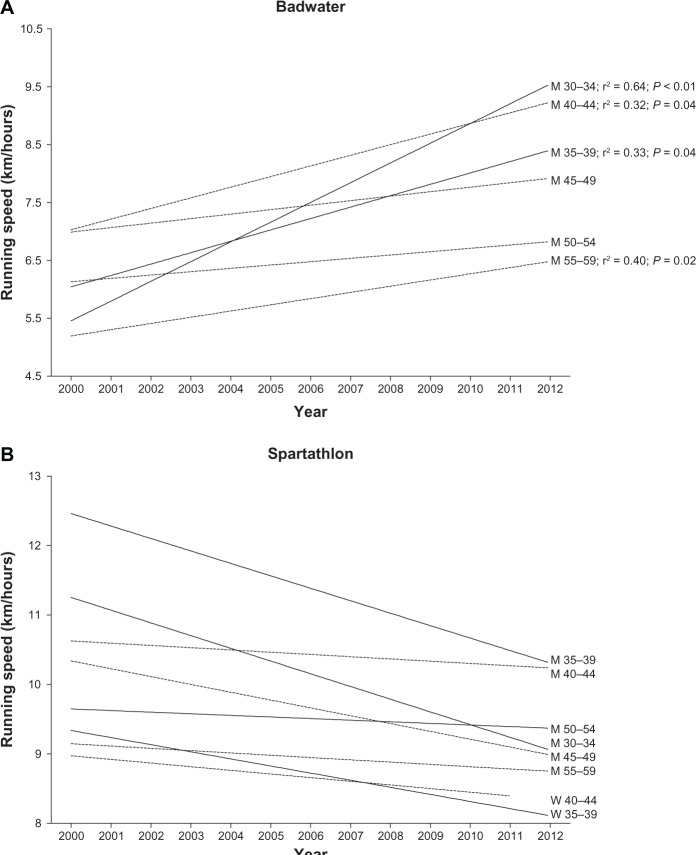
In Badwater, the number of male finishers in the age groups 30–34 and 40–44 years increased (Figure 5A). In Spartathlon, the number of male finishers increased in the age group 40–44 years (Figure 5B). Male athletes in the age groups 30–34, 35–39, 40–44, and 55–59 years improved running speed in Badwater (Figure 6A). In Spartathlon, however, no change in running speed was observed for either women or men (Figure 6B).
Figure 5.
Changes in the number of age group finishers in Badwater (Panel A) and Spartathlon (Panel B).
Notes: In Badwater, the number of men in the age groups 30–34 and 40–44 years increased. In Spartathlon, the number of men in the age group 40–44 years increased.
Figure 6.
Changes in running speed for finishers by age group in Badwater (Panel A) and Spartathlon (Panel B).
Notes: Men in the age groups 30–34, 35–39, 40–44, and 55–59 years improved running speed in Badwater. In Spartathlon, however, no change in running speed was observed for either women or men.
Discussion
This study intended to analyze participation and performance trends in Badwater and Spartathlon with a special emphasis on runners by age group. Based upon the present literature on marathoners and ultramarathoners, we hypothesized that (1) the number of athletes by age group would increase, and (2) the performance of athletes by age group would improve over time. The main findings were that (1) the fastest finishers were 40–45 years old in both races: (2) participation increased in age groups 30–34 and 40–44 years in Badwater and 40–44 years in Spartathlon: and (3) men in the age groups 30–34, 35–39, 40–44, and 55–59 years improved running speed in Badwater but not in Spartathlon.
Increased number of finishers in Badwater and Spartathlon across years
Both competitions showed a significant increase in the overall number of finishers. Both competitions limit the maximum number of participants and require participants to submit previous accomplishments, such as finishes in other ultramarathons, to qualify. Therefore, both competitions need a high level of performance in the interested participants or to increase the maximum number of participants. The number of master finishers aged 40–54 years in Spartathlon and 40–44 years in Badwater increased, while all other age groups showed no increase or rather a decrease in the number of finishers. For marathoners, Jokl et al showed that number of master participants increased at a greater rate than their younger counterparts for both sexes in the New York City Marathon, which is consistent with our findings.14 The age group of 45–49 years old had the largest number of finishers in Badwater and Spartathlon for men and in Badwater for women. For women the age group of 50–54 years old had the largest number of finishers in Spartathlon, but due to the low numbers of female finishers, the age groups of 35–39, 40–44, 45–49, and 50–54 years had a similar number of finishers. Eichenberger et al12 found that the Swiss Alpine Marathon, a 78 km mountain ultramarathon, had the highest number of finishers in the 40–44 years age group for both sexes, while Lepers and Cattagni11 found that the New York City Marathon had the largest number of finishers in the 30–39 years age group. It therefore seems that there could be an interaction between the age of the age group with the largest number of finishers and the length of the running race.
Running speed of the overall top five runners increased in Badwater
Running speed of the annual top five runners improved in Badwater but not in Spartathlon in both sexes. Although both races were established in the 1980s, the development of running speed seemed to be limited in the Spartathlon but not in the Badwater.
The Badwater is one of the most demanding races on earth, with temperatures well above 45°C and no aid stations along the course. It can be compared only to a few other official competitions, such as the Marathon des Sables29 in terms of weather and temperature conditions. Air temperature varies between 17°C–29°C for the lowest daily temperature and 37°C–43°C for the highest daily temperature (Table 2).30
Table 2.
Lowest and highest temperatures in Death Valley, California, USA during Badwater races41
| Race dates | Lowest temperature (°C) | Highest temperature (°C) | |
|---|---|---|---|
| 2012 | July 16–18 | 19.0 | 37.8 |
| 2011 | July 11–13 | 17.8 | 38.3 |
| 2010 | July 12–14 | 24.0 | 41.0 |
| 2009 | July 13–15 | 22.8 | 41.1 |
| 2008 | July 14–16 | 21.7 | 36.7 |
| 2007 | July 23–25 | 24.1 | 41.1 |
| 2006 | July 24–26 | 28.9 | 43.3 |
| 2005 | July 10–12 | 21.1 | 37.8 |
| 2004 | July 12–14 | 21.0 | 41.0 |
| 2003 | July 22–24 | 21.1 | 41.1 |
| 2002 | July 23–25 | 20.0 | 39.4 |
| 2001 | July 25–27 | 17.2 | 37.2 |
| 2000 | July 27–29 | 20.5 | 41.2 |
In Greece during July, the temperatures are more moderate, with an average of 26°C–28°C as the daily maximum.31 The Spartathlon covers fewer changes in altitude than Badwater and has moderate temperatures and weather conditions. It has been shown that moderate environmental conditions lead to a lower impairment of endurance performance.32–34 These more favorable weather conditions may lead to the Spartathlon becoming a more popular ultramarathon.8 Generally, each of these individual factors seems to be tougher in the Badwater compared to the Spartathlon.
Pacing strategy,35 fluid intake,36 and nutrition37 are of utmost importance in ultra-endurance disciplines and could be a major reason for the difference in development of running speed in the Badwater and the Spartathlon. The most demanding task for competitors in Spartathlon is the sharp cut-off at the time stations. Athletes who are not able to reach a time station within the time limit are taken out of the race.
Male athletes in age groups 30–34 to 55–59 improved running speed in Badwater
Men improved overall running speed in age groups 30–34 to 55–59 years in Badwater. In Spartathlon, however, men were not able to improve running speed regarding overall and age group performance. The fact that younger, but not master, runners improved at Badwater, while master runners maintained running speed at Spartathlon is a new phenomenon. Lepers and Cattagni reported improvements, especially in master marathoners, which are the contrary to our findings.11 At Badwater, older master athletes in the age group of 55–59 years improved their running speed too, which is consistent with the findings of Lepers and Cattagni for marathoners.11 These authors reported that the running speed of male master runners within the 40–64 years age range plateaued while men older than 64 years and women older than 44 years improved running speed from 1980–2009. In Spartathlon, the mean running speed was not improved by runners of any age group even though participation dramatically increased over the years. It can be argued that the world’s elite athletes from each age group consistently participated and finished over the years and therefore the number of finishers had no influence on the increase in the running speed of the top runners in an age group. Spartathlon’s rich history makes it unique, which could explain why the world’s elite runners of each age group in this kind of distance running participate in and finish this race.
Comparison of running speed between Badwater and Spartathlon for women and men
An important finding was that the sex difference in performance was constant across years in both races, indicating that women seemed not to be able to close the sex gap in single stage ultramarathons of more than 200 km in length. The present findings suggest that women could soon match their running speed in Badwater with their speed in Spartathlon. Since men increased their running speed in Badwater as well and remained constant in Spartathlon, a closure of the gap in running speed between the races could be expected as well, but at a later date than the women. These results were fairly unexpected and surprising since many factors, such as change in altitude or temperatures, differ much between the two races. Although Badwater covers a shorter distance than Spartathlon (217 km versus 246 km), the change in altitude is more than twice as much (4000 m versus 1700 m). The American College of Sports Medicine reported a formula to calculate the effect of change in altitude (ie, elevation gain) on running speed.38 Furthermore, the temperature for Badwater, taking place in Death Valley (part of the Mojave desert), reaches much higher temperatures30 than Spartathlon.31 Parise and Hoffman described the influence of hot weather on running speed in a 160 km ultramarathon and showed that extreme heat impaired all runners ability to perform.39 A possible explanation for the closing of the running speed gap between the two races could be the human learning curve; ie, experience, which is of utmost importance in running, under such strenuous and above all unique conditions.40 Even so, a simple extrapolation of what up to now seemed curvilinear slopes is dangerous and could lead to false predictions.
The age of peak running speed
The age of peak running performance was found to be at ~42 years in Badwater for both sexes and at ~39 years for men and ~45 years for women in Spartathlon. Therefore, the fastest finishers in both races were classified as master runners.15,26 The age of the fastest runners showed no changes across years in both races. Although the number of finishers in both races constantly increased over time, the age of peak running speed was constant in both races. In Badwater, the age of the annual top five men and the annual top five women was ~42 years of age. In Spartathlon, however, the annual top five women were ~45 years old and therefore older than the annual top five men who were ~39 years of age. The top runners in both races had a higher age of peak running speed than the top runners in other well-known races such as the New York City Marathon11 or the Swiss Alpine Marathon.12 With increasing length and duration of an event, the age of peak performance seems to increase. Hunter et al found the age of peak running speed in flat city marathons to be ~30 years for both sexes.20 Eichenberger et al12 described in the 78 km Swiss Alpine Marathon an age of peak running speed of ~34–37 years from 1998–2011 and Hoffman and Wegelin6 found the age of peak running speed to be between 35–40 years in the Western States 100-Mile Endurance Run. Considering these findings, Badwater and Spartathlon, with distances approximately one third longer than a 100 mile race, could be expected to have an even higher age of peak running speed.
Conclusion
Both Badwater and Spartathlon have increased in interest as the number of finishers constantly grew in both races from 2000 to 2012. While the running speed of the best runners plateaued in Spartathlon, it increased in Badwater for both men and women during this time period. The age of peak running performance was ~42 years in Badwater for both sexes and ~39 years for men and ~45 years for women in Spartathlon. The fastest finishers in both races were classified as master runners. Reaburn and Dascombe15 defined master athletes as athletes systematically training for and competing in a sport specifically designed for older adults, but not for elite athletes. However if to win a race means that the athlete is of an elite level the definition of master athlete needs to be re-evaluated for ultramarathoners competing in ultramarathons of more than 200 km. A possible new definition for ultra-endurance master athlete could be the age of 40 years and higher.6,12
We need to explain why older athletes are able to perform at this high level at an age beyond the normal age for optimal athletic performance.41 Future studies need to investigate where the limit of the interaction between ages of peak running speed and length (ie, duration) of a competition is. The comparison of recent studies seems to show that the age of peak ultrarunning performance increases with the increasing length of the race.6,12 Furthermore, the question must be raised if the definition of a master athlete should not only include the physical condition,41 but also experience of an athlete.40 The motivations of the runners competing in ultramarathons and the origins of these athletes needs further investigation.42
Footnotes
Disclosure
The authors report no other conflicts of interest in this work.
References
- 1.Burfoot A. The history of the marathon: 1976-present. Sports Med. 2007;37(4–5):284–287. doi: 10.2165/00007256-200737040-00003. [DOI] [PubMed] [Google Scholar]
- 2.Rittweger J, di Prampero PE, Maffulli N, Narici MV. Sprint and endurance power and ageing: an analysis of master athletic world records. Proc Biol Sci. 2009;276(1657):683–689. doi: 10.1098/rspb.2008.1319. [DOI] [PMC free article] [PubMed] [Google Scholar]
- 3.Tanaka H, Seals DR. Endurance exercise performance in masters athletes: age-associated changes and underlying physiological mechanisms. J Physiol. 2008;586(1):55–63. doi: 10.1113/jphysiol.2007.141879. [DOI] [PMC free article] [PubMed] [Google Scholar]
- 4.Hoffman MD. Performance trends in 161-km ultramarathons. Int J Sports Med. 2010;31(1):31–37. doi: 10.1055/s-0029-1239561. [DOI] [PubMed] [Google Scholar]
- 5.Hoffman MD, Lebus DK, Ganong AC, Casazza GA, Van Loan M. Body composition of 161-km ultramarathoners. Int J Sports Med. 2010;31(2):106–109. doi: 10.1055/s-0029-1241863. [DOI] [PubMed] [Google Scholar]
- 6.Hoffman MD, Wegelin JA. The Western States 100-Mile Endurance Run: participation and performance trends. Med Sci Sports Exerc. 2009;41(12):2191–2198. doi: 10.1249/MSS.0b013e3181a8d553. [DOI] [PMC free article] [PubMed] [Google Scholar]
- 7.Schütz UH, Schmidt-Trucksäss A, Knechtle B, et al. The Transeurope Footrace Project: longitudinal data acquisition in a cluster randomized mobile MRI observational cohort study on 44 endurance runners at a 64-stage 4,486 km transcontinental ultramarathon. BMC Med. 2012;10:78. doi: 10.1186/1741-7015-10-78. [DOI] [PMC free article] [PubMed] [Google Scholar]
- 8.ULTRAmarathon Running [homepage on the Internet] Buckingham: ULTRAmarathon Running; 2013Available from: http://www.ultramarathonrunning.comAccessed January 20, 2013 [Google Scholar]
- 9.Spartathlon [homepage on the Internet] Spartathlon: 2013Available from: http://spartathlon.grAccessed December 12, 2012 [Google Scholar]
- 10.Adventure CORPS Presents the Badwater Ultramarathon [homepage on the Internet] Oak Park: AdventureCORPS, Inc; Available from: http://badwater.comAccessed December 12, 2012 [Google Scholar]
- 11.Lepers R, Cattagni T. Do older athletes reach limits in their performance during marathon running? Age (Dordr) 2012;34(3):773–781. doi: 10.1007/s11357-011-9271-z. [DOI] [PMC free article] [PubMed] [Google Scholar]
- 12.Eichenberger E, Knechtle B, Rüst CA, Rosemann T, Lepers R. Age and sex interactions in mountain ultramarathon running – the Swiss Alpine Marathon. Open Access J Sports Med. 2012;3:73–80. doi: 10.2147/OAJSM.S33836. [DOI] [PMC free article] [PubMed] [Google Scholar]
- 13.Zouhal H, Groussard C, Vincent S, et al. Athletic performance and weight changes during the “Marathon of Sands” in athletes well-trained in endurance. Int J Sports Med. 2009;30(7):516–521. doi: 10.1055/s-0029-1202350. [DOI] [PubMed] [Google Scholar]
- 14.Jokl P, Sethi PM, Cooper AJ. Master’s performance in the New York City Marathon 1983–1999. Br J Sports Med. 2004;38(4):408–412. doi: 10.1136/bjsm.2002.003566. [DOI] [PMC free article] [PubMed] [Google Scholar]
- 15.Reaburn P, Dascombe B. Endurance performance in masters athletes. Eur Rev Aging Phys Act. 2008;5(1):31–42. [Google Scholar]
- 16.Leyk D, Erley O, Ridder D, et al. Age-related changes in marathon and half-marathon performances. Int J Sports Med. 2007;28(6):513–517. doi: 10.1055/s-2006-924658. [DOI] [PubMed] [Google Scholar]
- 17.Leyk D, Erley O, Gorges W, et al. Performance, training and lifestyle parameters of marathon runners aged 20–80 years: results of the PACE-study. Int J Sports Med. 2009;30(5):360–365. doi: 10.1055/s-0028-1105935. [DOI] [PubMed] [Google Scholar]
- 18.Trappe S. Marathon runners: how do they age? Sports Med. 2007;37(4–5):302–305. doi: 10.2165/00007256-200737040-00008. [DOI] [PubMed] [Google Scholar]
- 19.Knechtle B, Rüst CA, Rosemann T, Lepers R. Age-related changes in 100-km ultra-marathon running performance. Age (Dordr) 2012;34(4):1033–1045. doi: 10.1007/s11357-011-9290-9. [DOI] [PMC free article] [PubMed] [Google Scholar]
- 20.Hunter SK, Stevens AA, Magennis K, Skelton KW, Fauth M. Is there a sex difference in the age of elite marathon runners? Med Sci Sports Exerc. 2011;43(4):656–664. doi: 10.1249/MSS.0b013e3181fb4e00. [DOI] [PubMed] [Google Scholar]
- 21.Baker AB, Tang YQ, Turner MJ. Percentage decline in masters superathlete track and field performance with aging. Exp Aging Res. 2003;29(1):47–65. doi: 10.1080/03610730303706. [DOI] [PubMed] [Google Scholar]
- 22.Tanaka H, Seals DR. Invited Review: Dynamic exercise performance in masters athletes: insight into the effects of primary human aging on physiological functional capacity. J Appl Physiol. 2003;95(5):2152–2162. doi: 10.1152/japplphysiol.00320.2003. [DOI] [PubMed] [Google Scholar]
- 23.Balmer J, Bird S, Davison R. Indoor 16.1-km time-trial performance in cyclists aged 25–63 years. J Sports Sci. 2008;26(1):57–62. doi: 10.1080/02640410701348651. [DOI] [PubMed] [Google Scholar]
- 24.Donato AJ, Tench K, Glueck DH, Seals DR, Eskurza I, Tanaka H. Declines in physiological functional capacity with age: a longitudinal study in peak swimming performance. J Appl Physiol. 2003;94(2):764–769. doi: 10.1152/japplphysiol.00438.2002. [DOI] [PMC free article] [PubMed] [Google Scholar]
- 25.Wright VJ, Perricelli BC. Age-related rates of decline in performance among elite senior athletes. Am J Sports Med. 2008;36(3):443–450. doi: 10.1177/0363546507309673. [DOI] [PubMed] [Google Scholar]
- 26.World Masters Athletics [webpage on the Internet] World Masters Athletics; 2013Available from: http://www.world-masters-athletics.org/about-usAccessed January 20, 2013 [Google Scholar]
- 27.Easthope CS, Hausswirth C, Louis J, Lepers R, Vercruyssen F, Brisswalter J. Effects of a trail running competition on muscular performance and effciency in well-trained young and master athletes. Eur J Appl Physiol. 2010;110(6):1107–1116. doi: 10.1007/s00421-010-1597-1. [DOI] [PubMed] [Google Scholar]
- 28.Western US Climate Historical Summaries Weather [webpage on the Internet] Reno: Western Regional Climate Center; 2013Available from: http://www.wrcc.dri.edu/cgi-bin/cliMAIN.pl?ca2319Accessed January 20, 2013 [Google Scholar]
- 29.Knoth C, Knechtle B, Rüst CA, Rosemann T, Lepers R. Participation and performance trends in multistage ultramarathons – the ‘Marathon des Sables’ 2003–2012. Extreme Physiol Med. 2012;1(1):13. doi: 10.1186/2046-7648-1-13. [DOI] [PMC free article] [PubMed] [Google Scholar]
- 30.Local weather in Death Valley [webpage on the Internet] Dublin: Yankee Publishing, Inc; 2013Available from: http://www.almanac.com/weather/history/zipcode/92328Accessed February 16, 2013 [Google Scholar]
- 31.Weather in Greece [webpage on the Internet] Greeka.com; Available from: http://www.greeka.com/greece-weather.htmAccessed February 16, 2013 [Google Scholar]
- 32.Ely MR, Cheuvront SN, Roberts WO, Montain SJ. Impact of weather on marathon-running performance. Med Sci Sports Exerc. 2007;39(3):487–493. doi: 10.1249/mss.0b013e31802d3aba. [DOI] [PubMed] [Google Scholar]
- 33.Trapasso LM, Cooper JD. Record performances at the Boston Marathon: Biometeorological factors. Int J Biometeorol. 1989;33(4):233–237. doi: 10.1007/BF01051083. [DOI] [PubMed] [Google Scholar]
- 34.Vihma T. Effects of weather on the performance of marathon runners. Int J Biometeorol. 2010;54(3):297–306. doi: 10.1007/s00484-009-0280-x. [DOI] [PubMed] [Google Scholar]
- 35.March DS, Vanderburgh PM, Titlebaum PJ, Hoops ML. Age, sex, and finish time as determinants of pacing in the marathon. J Strength Cond Res. 2011;25(2):386–391. doi: 10.1519/JSC.0b013e3181bffd0f. [DOI] [PubMed] [Google Scholar]
- 36.Williams J, Tzortziou Brown V, Malliaras P, Perry M, Kipps C. Hydration strategies of runners in the London Marathon. Clin J Sport Med. 2012;22(2):152–156. doi: 10.1097/JSM.0b013e3182364c45. [DOI] [PubMed] [Google Scholar]
- 37.Maughan RJ, Shirreffs SM. Nutrition for sports performance: issues and opportunities. Proc Nutr Soc. 2012;71(1):112–119. doi: 10.1017/S0029665111003211. [DOI] [PubMed] [Google Scholar]
- 38.American College of Sports Medicine [homepage on the Internet] Indianapolis: American College of Sports Medicine; 2013Available from: http://www.acsm.org/Accessed January 20, 2013 [Google Scholar]
- 39.Parise CA, Hoffman MD. Infuence of temperature and performance level on pacing a 161 km trail ultramarathon. Int J Sports Physiol Perform. 2011;6(2):243–251. doi: 10.1123/ijspp.6.2.243. [DOI] [PubMed] [Google Scholar]
- 40.Hoffman MD, Fogard K. Demographic characteristics of 161-km ultramarathon runners. Res Sports Med. 2012;20(1):59–69. doi: 10.1080/15438627.2012.634707. [DOI] [PubMed] [Google Scholar]
- 41.Mujika I. Too young to vote, old enough to be an Olympic champion. Int J Sports Physiol Perfom. 2012;7(4):307. doi: 10.1123/ijspp.7.4.307. [DOI] [PubMed] [Google Scholar]
- 42.Knechtle B. Ultramarathon runners: nature or nurture? Int J Sports Physiol Perfom. 2012;7(4):310–312. doi: 10.1123/ijspp.7.4.310. [DOI] [PubMed] [Google Scholar]


