

Abstract
Insulin-like growth factor 2 (IGF2) is an important fetal growth factor. Its expression is dramatically down-regulated in multiple organs after birth but is frequently up-regulated in cancers. The mechanisms that drive down-regulation of IGF2 in postnatal tissues or the up-regulation in malignancy are unclear. We found evidence that E2F transcription factor 3 (E2F3) drives these changes in expression. E2f3 mRNA expression, protein expression, and binding to the Igf2 promoter all decreased with age postnatally in multiple mouse organs. In late juvenile hepatocytes, restoration of high E2f3 expression restored high Igf2 expression, indicating a causal relationship, but this induction did not occur in fetal hepatocytes, which already have high E2f3 and Igf2 expression. Transient expression of E2f3 in both HEK293 cells and in late juvenile hepatocytes were able to activate reporter constructs containing the mouse Igf2 promoter P2, which includes consensus E2F-binding sites. In humans, microarray data revealed declines in E2F3 and IGF2 expression with age similar to the mouse. In addition, E2F3-overexpressing human prostate and bladder cancers showed increased IGF2 expression, and levels of E2F3 and IGF2 mRNA in these cancers were positively correlated. Taken together, the findings suggest that down-regulation of E2f3 with age helps drive the dramatic decline in Igf2 expression in postnatal organs, and E2F3 overexpression in human cancers induces IGF2 overexpression.
Keywords: childhood growth, genetic program, growth deceleration, cell proliferation, body size
Insulin-like growth factor 2 (IGF2) is a major growth factor in fetal life. Mice with targeted Igf2 disruption exhibit severe growth retardation at birth (1), indicating that this growth factor is critical for normal somatic growth. In both mice and humans, IGF2 is an imprinted gene expressed only by the paternal allele (2), and alterations of IGF2 imprinting are associated with childhood diseases that affect growth. Relaxation of IGF2 imprinting is observed in Beckwith–Wiedemann syndrome (3), which leads to biallelic IGF2 expression, overgrowth, and predisposition to tumors. Conversely, impaired intrauterine growth is associated with decreased IGF2 expression due to imprinting abnormalities in subjects with and without Silver–Russell syndrome (4, 5) and due to translocation of IGF2 enhancers (6).
In the mouse, Igf2 is highly expressed in a variety of tissues during fetal life but then is dramatically down-regulated shortly after birth (7). For example, Igf2 mRNA is down-regulated by more than 100-fold from embryonic day (E) 19 to 4 wk of age in mouse liver, kidney, and lung (7). This postnatal down-regulation in multiple tissues occurs not only for Igf2, but for a large set of growth-promoting genes, suggesting that Igf2 down-regulation is part of an extensive juvenile genetic program that causes body growth to slow with age (8). In humans, temporal changes in IGF2 expression have been studied in few tissues. As in the mouse, mRNA expression is down-regulated postnatally in kidney and liver (9–11). However, in the adult human, there is still residual IGF2 expression in liver due to P1 (10, 11), a promoter which is not present in rodents (12, 13), and probably as a result, in humans, substantial IGF2 protein circulates postnatally (14, 15). Imprinting of IGF2, which has been studied extensively over the past two decades, does not appear to be responsible for this sharp postnatal down-regulation; IGF2 expression is monoallelic both before and after birth in most tissues (13). Thus, the mechanisms responsible for the dramatic postnatal down-regulation remain unknown.
Understanding the molecular mechanisms responsible for the potent postnatal down-regulation of IGF2 may yield important insights into the deregulation of IGF2 in malignancy. Overexpression of IGF2 is commonly observed in childhood malignancies, such as Wilms tumor (16), medulloblastoma (17), and rhabdomyosarcoma (17, 18), as well as many cancers of adulthood, including lung cancer, breast cancer, colorectal cancer, bladder cancer, ovarian cancer, and liver cancer (19). Thus, the high-level expression of IGF2 that occurs in fetal tissues and supports normal rapid body growth is often reestablished in many malignant cells, perhaps contributing to their rapid proliferation.
In the current study, we show evidence that the physiological postnatal down-regulation of Igf2, and of other genes in the juvenile multiorgan program, results from decreasing E2f activity. The E2F family of transcription factors was first described as a key regulator of cell-cycle progression. Subsequently, E2Fs were also found to regulate genes involved in a variety of biological processes, including apoptosis, DNA repair, differentiation, and development (20, 21). We first found evidence that the E2f family of transcription factors helps coordinate the down-regulation of many genes in the juvenile multiorgan program in mice. We then focused on the regulation of Igf2, finding evidence that E2f transcription factor 3 (E2f3) is a positive regulator of Igf2 and that decreasing E2f3 expression and E2f3 binding to the Igf2 promoter drives the postnatal down-regulation of Igf2. Finally, using microarray expression data, we found that, in E2F3-overexpressing prostate and bladder cancers, IGF2 expression is elevated and positively correlated with E2F3 expression, providing evidence that the regulation of IGF2 by E2F3 may be an important mechanism for supporting rapid proliferation in cancer cells.
Results
E2f Regulates Many Growth-Promoting Genes That Are Down-Regulated with Age.
We previously identified a postnatal genetic program that contributes to the normal postnatal slowing of body growth in mice and rats (8). This program involves the down-regulation of a large set of growth-promoting genes with age in multiple organs, including liver, kidney, lung, and heart. One of the genes in this program is Igf2 (7, 8). To explore the molecular mechanisms that orchestrate this genetic program, a bioinformatic program, Distant Regulatory Elements of coregulated genes (DiRE) (22), was used to determine the transcription factor binding sites that are enriched among the genes in the program. Comparing the 235 genes that are down-regulated with age in multiple organs (8) with a random set of 5,000 genes in the genome suggested that E2F is the most strongly overrepresented transcription factor governing this genetic program (Fig. 1A).
Fig. 1.

E2fs regulate many growth-promoting genes that are down-regulated with age. (A) Analysis of transcription factor binding sites using a bioinformatic program, DiRE (22). The analysis compared a previously reported set of 235 genes that are down-regulated with age (8) in multiple organs during juvenile life to a random set of 5,000 genes to determine the most enriched binding sites. Top shows the request ID and a permanent link to the analysis. Middle shows the genomic distribution of the 135 potential regulatory elements identified from the 235 age–down-regulated genes. Bottom shows the top 10 candidate transcription factors implicated by the enriched regulatory elements, ranked by importance. Occurrence indicates the percentage of candidate regulatory elements containing a conserved binding site for a particular transcription factor, and importance is the product of occurrence and weight, which in turn is a measure of the association of a transcription factor with the overall input gene set. (B) Western blot of E2f family of transcription factors in 1-, 4-, and 8-wk-old mouse kidney, lung, and liver. (C) Western blot of primary hepatocytes from 5-wk-old mice transfected with empty vector or vectors expressing E2f1, E2f3a, or E2f3b. (D) Effect of E2f3 on expression of 15 genes that are down-regulated with age in multiple organs during juvenile life. Hepatocytes from 5-wk-old mice were transfected with vectors expressing E2f1, E2f3a, or E2f3b. The effects on mRNA expression of the 15 genes were assessed by quantitative real-time PCR analysis. Expression levels were normalized to those of hepatocytes transfected with empty vector and shown as mean ± SEM; *P < 0.05, ANOVA.
E2F is a family of transcription factors that interacts with E2F dimerization partner (DP) 1 or DP2 to alter expression of target genes. It consists of nine members, of which E2f1, E2f2, and E2f3a are activators and E2f4, E2f5, E2f6, E2f7, and E2f8 are repressors of transcription. E2f3b was initially described as a repressor (23) but was subsequently shown to have an in vivo function similar to activator E2f3a (24, 25). Our bioinformatic analysis suggested the hypothesis that E2f transactivation might decline with age, driving the down-regulation of a large set of genes. Therefore, we investigated the expression levels of different E2f members in liver, kidney, and lung from 1-, 4-, and 8-wk-old mice. By Western blot, only E2f1, E2f3a, and E2f3b showed a consistent pattern of declining expression from 1 to 4 and 8 wks of age in all three organs (Fig. 1B). Real-time PCR and analysis of our previous microarray data showed a similar, although less dramatic, decline of E2f1 and E2f3 expression at the mRNA level from 1 to 4 and 8 wk of age in mouse kidney and lung (Fig. S1). Further analysis of our previous microarray data of mouse lung, kidney, and heart indicated an overall down-regulation of known E2f target genes with age (Figs. S2 and S3). Taken together, these findings support the concept that expression of activator E2fs decreases with age, causing a broad decline in E2f transactivation.
If postnatal down-regulation of multiple genes participating in a postnatal genetic program is in fact driven by decreasing E2f1, E2f3a, and E2f3b expression, then restoration of high E2f activity in adult cells should restore higher expression of genes in the program. We therefore isolated primary hepatocytes from 5-wk-old mice, at which age expression of these E2fs has been down-regulated, and transiently transfected the cells with E2f1, E2f3a, or E2f3b expression vectors (Fig. 1C). Using real-time PCR, we examined expression of 15 genes that are involved in cell proliferation and/or body growth and are down-regulated with age in multiple organs of mice and rats (7, 8). Of these 15 genes, 10 were significantly up-regulated by E2f1, 3a, or 3b overexpression, including many that were not previously known to be E2f targets (Fig. 1D and Table S1). In contrast, transient transfection of these late juvenile murine hepatocytes with E2f4 or 6, which are repressor E2fs and were not down-regulated with age (Fig. 1B), did not induce expression of any of the 15 genes studied (Fig. S4). These observations therefore validate the bioinformatic predictions and support the hypothesis that postnatal down-regulation of activator E2fs drives the down-regulation of genes in the juvenile multiorgan program.
Expression of Igf2 Variants Decline with Age in Liver, Kidney, and Lung.
One of the genes most strongly induced by E2f is Igf2, which showed more than a 30-fold induction by E2f1, E2f3a, or E2f3b (Fig. 1D and Table S1). Because Igf2 is a key regulator of both normal body growth and malignant growth, we chose to investigate further its regulation by E2fs. Both the human and mouse Igf2 gene contains multiple promoters and transcript variants (Fig. S5). In humans, promoters P2, P3, and P4 are active in many fetal tissues and then are down-regulated postnatally (9, 11, 12). P1 drives a low level of IGF2 expression in the adult liver (11, 13), and P0 is active in fetal skeletal muscle and, subsequently, active in many adult tissues, but at a much lower level than the fetal promoters (26). In mice, the P0 promoter, which does not correspond to the human P0 promoter, is only active in the placenta (27). The mouse P1, P2, and P3 promoters correspond to the human P2, P3, and P4 promoters, respectively, but their relative activity in fetal and postnatal tissues have not been well characterized. We first used real-time PCR to compare the relative expression of different Igf2 transcript variants in mice at 1, 4, and 8 wk of age (Fig. S6). All three variants were expressed in 1-wk-old liver, kidney, and lung, but were down-regulated dramatically by 4 wk of age in liver (>10,000-fold) and kidney (>100-fold). Igf2 mRNA in lung showed a more gradual down-regulation, declining by approximately 2.5-fold at 4 wk and 10-fold by 8 wk of age.
E2f3a and E2f3b Induce Igf2 Expression in Late Juvenile but Not in Fetal Hepatocytes.
Having found that overall Igf2 expression was strongly induced by E2f1, E2f3a, or E2f3b in primary hepatocytes (Fig. 1D), we next examined which specific Igf2 variants were regulated by E2fs. Using real-time PCR, we found that transient transfection of the E2f1, E2f3a, or E2f3b expression vector into primary hepatocytes isolated from 5-wk-old mice potently induced Igf2 variant 1 expression, by 24- to 38-fold, and induced Igf2 variant 2 and 3 mRNA less potently, by four- to sevenfold (Fig. 2, Upper and Table S2).
Fig. 2.

E2f3a and E2f3b induce Igf2 mRNA expression in late juvenile but not in fetal hepatocytes. E2f3a and E2f33b expression vectors were transiently transfected into primary hepatocytes isolated from mice at 5 wks of age (Upper) or at E15 (Lower), and Igf2 transcript variants were measured 2 d later by real-time PCR. Variant 1 expression showed >20-fold induction by E2f3a and E2f3b in late juvenile hepatocytes, but not in fetal hepatocytes. Data are shown as mean ± SEM; v, variant; *P < 0.05 vs. control, ANOVA.
In contrast, in hepatocytes isolated from mouse fetal liver at E15 rather than from 5-wk-old liver, Igf2 mRNA expression was high in control samples and only induced minimally by E2f1, E2f3a, and E2f3b expression vectors (Fig. 2, Lower and Table S2). This finding suggests that in fetal hepatocytes, which express a high level of E2f1 and E2f3 compared with 5-wk-old hepatocytes (Fig. S7), Igf2 promoters are already occupied by E2f1 and E2f3 to drive a high level of expression and, therefore, further increases in E2f1 or E2f3 levels have little additional effect. Taken together with the observation that expression of E2f1, E2f3a, and E2f3b was down-regulated with age in multiple organs, these findings support the hypothesis that postnatal down-regulation of Igf2 variant 1, 2, and 3 expression is driven by a decline in E2f1 and E2f3 expression.
E2f3a and 3b Transactivate the Igf2 P2 Promoter.
We next hypothesized that the observed induction of Igf2 expression by E2f1 and E2f3 was a direct effect, mediated by E2fs binding to the promoter region and causing transactivation. To test this hypothesis, we first performed a bioinformatic analysis of the Igf2 promoter and identified several predicted E2F binding sites (28) in the mouse P2 promoter (and in the human P3 promoter) but not in the P1 and P3 promoters. Next, to determine empirically whether E2f1 and E2f3 can directly activate Igf2 promoters, we transiently cotransfected human HEK293 cells with E2f1, E2f3a, or E2f3b expression vectors and a reporter construct in which luciferase expression is controlled by the mouse P1, P2, or P3 Igf2 promoter. Transfection of E2f1, 3a, or 3b activated the P2 reporter construct seven- to ninefold, suggesting that E2f1 and E2f3 specifically binds to and activates the P2 promoter (Fig. 3A, Left). However, E2f1, E2f3a, and E2f3b do not activate the P1 or P3 reporter construct, suggesting that the previously observed regulation of Igf2 variant 1, 2, and 3 may all involve transactivation by E2f1 and 3 bound to sites in the P2 promoter region. This model might also explain why E2f1, E2f3a, and E2f3b stimulates Igf2 variant 1 (which derives from the P2 promoter) expression more potently than variant 2 or 3. When we repeated this experiment using primary murine hepatocytes, a more physiological model, transfection of E2f1, E2f3a, or E2f3b was also able to specifically activate the P2 promoter, albeit with a lower magnitude, by two- to sixfold (Fig. 3A, Right), perhaps due to a lower transfection efficiency and protein expression compared with HEK293 cells.
Fig. 3.
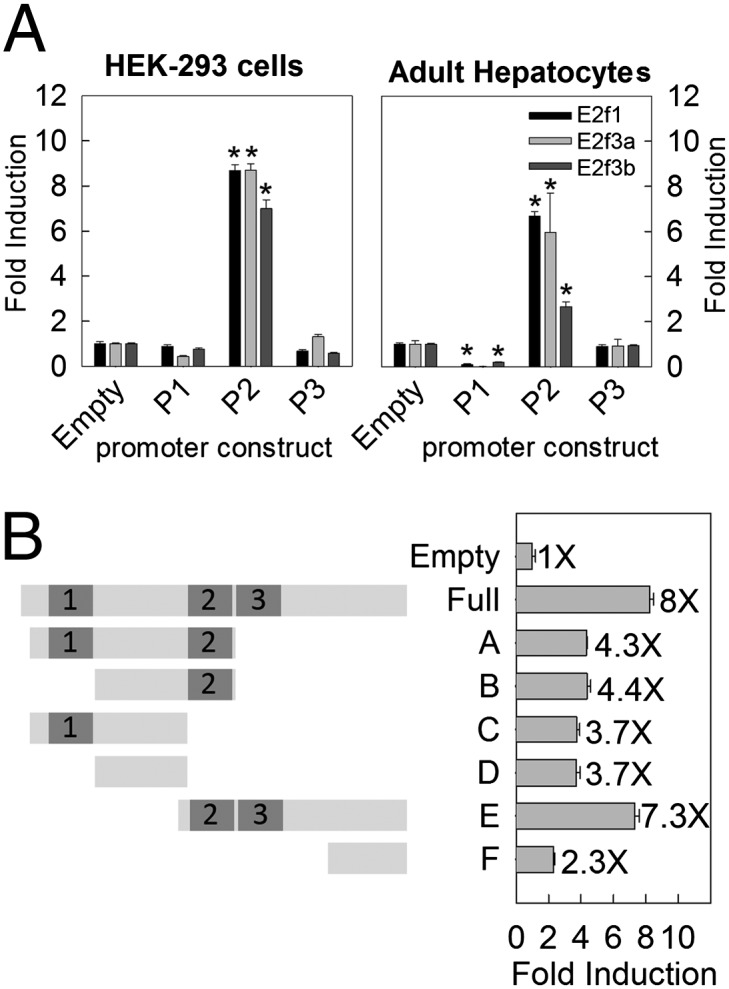
E2f3a and E2f3b transactivate the mouse Igf2 P2 promoter. (A) Transient expression of E2f1, E2f3a, and E2f3b strongly induced activity of the Igf2 P2 promoter, but not P1 or P3. HEK293 cells (Left) and primary hepatocytes isolated from 5-wk-old mice (Right) were cotransfected with vectors expressing E2f1, E2f3a, or E2f3b and a vector containing Igf2 promoter sequence upstream from a luciferase reporter. Fold induction was normalized to increase in luciferase activity of a reporter construct lacking Igf2 promoter sequence, when cotransfected with E2f1, E2f3a, or E2f3b. Data are shown as mean ± SEM; *P < 0.05 vs. control, ANOVA. (B) Deletion mutants of the P2 promoter were constructed and cotransfected with the E2f3a expression vector into HEK293 cells. Putative E2F binding sites in the P2 promoter are numbered and represented by dark gray bars. Data are shown as mean ± SEM. P < 0.001 for overall ANOVA; P < 0.05 for all pairwise comparisons (Holm-Sidak), except between all pairs among A, B, C, and D.
To define better the E2f binding sites within the P2 promoter region, we next constructed a series of deletion mutants and cotransfected them with an E2f3a expression vector into HEK293 cells (Fig. 3B). Removal of the E2f binding site 3 and a downstream promoter region reduced the E2f3a-induced promoter activity by approximately one-half (Fig. 3B, Full vs. A), but further deletion of site 2 had little effect (Fig. 3B, A vs. C) and deletion of site 1 had no effect (Fig. 3B, A vs. B). Thus, of the predicted consensus E2f binding sites, site 3 but not 1 or 2 were supported experimentally. Interestingly, a region between site 1 and 2 (Fig. 3B, D vs. Empty) and a region downstream from site 3 (Fig. 3B, F vs. Empty), neither of which contain consensus E2f binding sites, also allowed E2f transactivation. These findings are consistent with previous studies showing evidence that E2fs do not act on all consensus binding sites and instead frequently act at sites lacking a recognized consensus sequence (28).
E2f3 Binds to Igf2 P2 Promoter in Vivo.
We next asked whether E2fs bind to the mouse P1, P2, and/or P3 promoters in vivo. Using a chromatin immunoprecipitation (ChIP) assay, we found that, in 1-wk-old liver, kidney, and lung, E2f3 bound most strongly to the P2 promoter and, more weakly, to the P1 and P3 promoter (Fig. 4 A and B), This finding is compatible with our observation that sequences in the P2 promoter but not the P1 or P3 promoter allow transactivation by E2f3. Importantly, E2f3 binding to the P2 promoter declined from 1 wk to 4 wk of age in all three organs (Fig. 4B, Top), providing further support for the concept that the loss of E2f3 binding is responsible for decreasing Igf2 transcription. In contrast, E2f1 showed essentially no binding to Igf2 promoters (Fig. 4B, Middle), compared with the negative control using IgG (Fig. 4B, Bottom), and to positive controls, using promoters of genes with known E2f binding sites (Fig. S8). This finding suggests that, although E2f1 overexpression can induce Igf2 expression in vitro, it may not be the physiological regulator of Igf2 expression in these organs during fetal and early juvenile life.
Fig. 4.

Changes in E2f3 and E2f1 binding to the Igf2 promoter from 1 wk to 4 wk of age in mouse liver, kidney, and lung. ChIP assay was used to examine the binding of E2f3 and E2f1 to different Igf2 promoters. (A) Relative positions of primers used to quantify the E2f3 and E2f1 binding by real-time PCR. Boxes represent exons and shaded ovals represent putative E2f binding sites predicted by Mulan/Multi-TF. (B) ChIP assay indicated that E2f3, but not E2f1, bound strongly to the mouse Igf2 P2 promoter, and more weakly to the P1 and P3 promoter in 1-wk-old organs. In particular, E2f3 binding to the P2 promoter declined from 1 wk to 4 wks of age in all three organs. IgG was used as negative control. Two-way ANOVA was used to assess the effect of age and effect of genomic positions. P value in top right corner of each graph, effect of age; data are shown as mean ± SEM; *P < 0.05, **P < 0.01, 1 wk vs. 4 wk; NS, not significant.
E2F3 and IGF2 mRNA Expression Decline from Fetal to Adult Tissues in Human Liver and Kidney.
In humans, there is less information about changes in IGF2 expression with age. However, IGF2 has been shown to be down-regulated in liver and kidney postnatally (9–11). To assess whether this decline might be secondary to declining E2F3 levels in humans, we analyzed publicly available expression microarray data that compared expression levels in normal fetal versus adult liver and kidney. The analysis indicated that both E2F3 and IGF2 mRNA levels declined from the human fetus to the adult in both liver and kidney (Fig. S9).
E2F3 Overexpression Correlates with IGF2 Overexpression in Prostate and Bladder Cancer.
We next asked whether the observed potent regulation of Igf2 by E2fs may also contribute to tumorigenesis. E2F3 is amplified and overexpressed in various malignancies (29). Our discovery that E2f3 drives Igf2 expression suggests that cancers that overexpress E2F3 may also overexpress IGF2. To test this prediction, we analyzed publicly available expression microarray data from three human malignancies that overexpress E2F3: metastatic prostate cancer (30, 31), urinary bladder cancer (32–34), and Wilms tumor (35). All three types of cancer showed increased E2F3 expression, which is consistent with prior publications (30–35), and also showed elevated IGF2 levels (Fig. 5). In metastatic prostate cancers and bladder cancers, but not in Wilms tumor, E2F3 and IGF2 levels were positively correlated, which, when combined with our in vitro studies, suggest a causal relationship.
Fig. 5.

E2F3 overexpression correlates with IGF2 overexpression in prostate cancer and bladder cancer, but not Wilms tumor. Expression microarray data were gathered from the National Center for Biotechnology Information GEO database for three malignancies that overexpress E2F3: prostate cancer, bladder cancer, and Wilms tumor. Box-and whiskers plots were used. The line within each box represents the median of gene expression. The upper and lower boundary of the box indicates the 75th and 25th percentiles, respectively. Whiskers (error bars) above and below the box indicate the 90th and 10th percentiles and outliers were shown in dots. All three cancers showed both increased E2F3 and IGF2 expression compared with corresponding normal tissues. E2F3 and IGF2 levels were positively correlated in metastatic prostate cancers and bladder cancers (Spearman’s correlation, r values and P values near bottom of graphs). AJB, normal bladder mucosae adjacent to bladder cancer; AJP, normal prostate tissue adjacent to prostate cancer; BC, bladder cancer; CC, clear cell renal cell carcinoma; CHR, chromophobe renal cell carcinoma; LPC, local prostate cancer; MET, metastatic prostate cancer; NB, normal bladder mucosae; NOK, normal kidney tissue; ONC, oncocytoma; PAP, papillary renal cell carcinoma; WT, Wilms tumor. P values (ANOVA) near top of graphs, overall effect of tissue type.
Discussion
We previously identified a juvenile multiorgan genetic program, which involves the down-regulation of a large set of growth-promoting genes in mice and rats, and showed evidence that this program helps explain the rapid body growth of early life and the subsequent slowing of growth with age (8). In the current study, we identified the E2f family of transcription factors as a molecular switch that helps orchestrate this growth-limiting program. We found that activator E2f1, E2f3a, and E2f3b are down-regulated with age in multiple mouse organs, as are known E2f target genes, indicating that E2f transcriptional activation declines during juvenile life. Concomitantly, bioinformatic analysis indicated that E2f binding sites are strongly overrepresented among genes participating in the juvenile multiorgan genetic program, suggesting that the decline in E2f activity drives the down-regulation of genes in this program. Supporting this concept, restoration of high activator E2f expression in late juvenile murine hepatocytes helped restore high expression of multiple genes in the program. Although many genes that we studied in this program were induced by E2f overexpression, not all genes appeared to be targets, suggesting that other mechanisms also contribute to this broad postnatal down-regulation of growth-promoting genes. Because this program appears to contribute to the physiological slowing of body growth that occurs between fetal life and adulthood, the current findings suggest that E2f may serve as a master switch to limit body growth.
One important gene in the juvenile multiorgan genetic program is Igf2, which serves as a potent fetal growth factor. Igf2 deficiency severely impairs prenatal growth in mice (1), and decreased IGF2 expression is associated with decreased fetal growth rates in humans (36, 37). Postnatally, Igf2 mRNA levels are dramatically down-regulated in multiple mouse organs (7), likely contributing to the marked decline in cell proliferation that occurs with age. In humans, liver and kidney IGF2 expression is strikingly down-regulated after birth (9–11), but it is not known whether the same postnatal decline also occur in all organs (11). Although this postnatal decline in Igf2 expression has been known for many years, the mechanisms responsible for the striking down-regulation have remained mysterious.
We found strong evidence that this decline in Igf2 expression is caused by a decline in E2f3 levels. E2f3 mRNA expression, protein expression, and binding to the Igf2 promoter all decreased from 1 to 4 wk of age in multiple mouse organs. Overexpression of E2f3 in primary hepatocytes isolated from 5-wk-old mice strongly induced Igf2 expression, suggesting that restoration of high E2f expression in late juvenile cells can restore high Igf2 expression. This induction did not occur in fetal hepatocytes, suggesting that endogenous E2f activity is already maximally driving Igf2 expression in early life. We found that E2f3 specifically binds to regions upstream of the Igf2 P2 promoter, including a region that contains a consensus E2f binding site and regions lacking consensus E2f sites. Prior studies, involving other genes, have also demonstrated that E2fs often act at sites without a recognized consensus sequence (28). Taken together, these findings suggest that E2f3 positively regulates Igf2 expression by directly binding to promoter sequences and transactivating transcription, and that down-regulation of E2f3 helps drive the postnatal down-regulation of Igf2. However, this in vitro evidence does not definitively establish a causal relationship in vivo. Analysis of existing expression microarray data suggests that similar declines with age in E2F3 and IGF2 expression occur also in the human.
Because IGF2 is overexpressed in many types of cancer, understanding the mechanisms that drive the postnatal down-regulation of IGF2 has important implications for oncogenesis. In the current study, we found preliminary evidence that the observed regulation of Igf2 by E2fs occurs not only in normal juvenile tissues, but also in malignant human tissues. In metastatic prostate cancer and urinary bladder cancer, in which E2F3 was overexpressed, we found that IGF2 expression was elevated and positively correlated with E2F3 levels. In Wilms tumor, both E2F3 and IGF2 were also elevated compared with other kidney cancers, but we did not find a significant correlation between E2F3 and IGF2 mRNA levels, suggesting that overexpression of IGF2 in Wilms tumor may be caused by an E2F3-independent mechanism, such as loss of imprinting (38).
The proposed effect of E2Fs on IGF2 expression in malignancies is consistent with findings from prior studies. One mechanism frequently reported for IGF2 overexpression is loss of imprinting, in which the normally silenced maternal IGF2 allele becomes expressed. However, biallelic expression would presumably only lead to a twofold increase in mRNA, which can only partially explain the much greater increases in IGF2 expression found in many cancers. Indeed, the increased IGF2 levels in some cancers appear not solely attributable to loss of imprinting (17, 39), but instead involve the aberrant activation of the P3 promoter (39–41). Because the human P3 promoter corresponds to the mouse P2 promoter and contains evolutionarily conserved E2f binding sites, our finding that E2fs activate the mouse P2 promoter may explain the previously observed activation of the human P3 promoter in malignancies. Therefore, these prior findings are consistent with the concept that IGF2 overexpression in some cancers results from E2F3 overexpression, thus reversing the normal physiological mechanism that suppresses IGF2 expression postnatally.
Because deregulation of E2f activity is observed in the vast majority of human cancers (29), the effects on IGF2 expression may be important for many different types of cancer. Interestingly, E2F3 is the only E2F member for which amplification and overexpression in various types of cancers has been demonstrated (30–35). More commonly, increased E2F activity results because the malignant cells undergo loss of retinoblastoma protein (RB), which binds to and suppresses E2F activity, or because of mutations in other genes that modulate the phosphorylation and degradation of RB (29). Therefore, it would be important to explore the possibility that overexpression of IGF2 in many cancers may be due to increased E2F activity caused by impaired RB activity.
In summary, we found evidence that declining E2f3 expression is responsible for the sharp postnatal down-regulation of Igf2. E2f3 positively regulates Igf2 expression by binding to and transactivating the Igf2 P2 promoter. This regulation of E2F3 on IGF2 expression may also provide a mechanism by which malignant cells overexpress IGF2.
Materials and Methods
Animals.
All animal procedures were approved by the National Institute of Child Health and Human Development Animal Care and Use Committee. C57BL/6 mice at different ages were obtained from Charles River Laboratory. Organs were excised for RNA and protein extractions.
Western Blot.
A detailed description of protein extraction from mouse tissues and analysis using Western blot is provided in SI Materials and Methods.
Quantitative Real-time RT-PCR.
RNA extraction is described in SI Materials and Methods. Real-time PCR was used to assess mRNA levels in tissues from mice at different ages (n = 5 animals per time point) and mRNA induced by E2F overexpression in hepatocytes (n = 6 samples per time point). Total RNA (100–200 ng) was reverse transcribed using SuperScript III Reverse Transcriptase (Invitrogen). Quantitative real-time PCR was performed as described (8). A more detailed description is provided in SI Materials and Methods.
Bioinformatics.
DiRE (22) was used to identify transcription factor binding sites enriched in the 235 genes that are down-regulated with age in multiple organs [Gene Expression Omnibus (GEO) dataset: GSE16792] (8) according to instructions provided on the program webpage (http://dire.dcode.org). A list of well-defined E2F target genes was generated based on prior literature (20). Changes in E2f1, E2f3, and E2F target gene expression with age were analyzed using previous microarray datasets (GEO dataset: GSE38754). Heatmaps were generated using JMP8, and fold changes of E2F target genes were log2 transformed and compared with the changes in all genes represented on the microarray using ANOVA.
Promoter Analysis.
Human and mouse Igf2 promoters were analyzed for predicted E2F binding sites using Mulan/MultiTF (42) (http://rvista.dcode.org). All sites identified were manually examined for their similarity to the consensus E2F motif (TTTSSCGC, where S represents C or G).
DNA Constructs.
Mouse E2f1, E2f3a, E2f3b, E2f4, and E2f6 sequences were PCR amplified from 1-wk-old mouse liver cDNA, cloned into pCR2.1 (Invitrogen), and subcloned into pcDNA3.1 (Invitrogen). Similarly, Igf2 promoters and promoter fragments were PCR amplified from 4-wk-old mouse liver genomic DNA and cloned into pGL3-Basic (Promega). Sequences for primers used were provided in SI Materials and Methods.
Murine Hepatocyte Culture and Transfection.
A detailed description of isolation, culture, and transfection of fetal and late juvenile murine hepatocytes is provided in SI Materials and Methods.
Luciferase Reporter Assay.
HEK293 cells were maintained in DMEM supplemented with 10% (vol/vol) FBS and 1% (vol/vol) Penicillin-Streptomycin. Both HEK293 cells and primary hepatocytes were transfected using Lipofectamine 2000 (Invitrogen) according to the manufacturer’s protocol. For example, in a final volume of 100 µL, cells were transfected with 1 µL of Lipofectamine 2000; 300 ng of pcDNA3.1, pcDNA3.1-E2f3a, or pcDNA3.1-E2f3b; 500 ng of pGL3-Basic (Promega) or pGL3 bearing different promoter fragments; and 40 ng of pRL (Promega) for normalization of transfection efficiency. Cells were lysed 48 h after transfection and luciferase expression was assessed using the Dual-Luciferase Reporter Assay System (Promega) and a spectrophotometer. Induction of the Igf2 promoter constructs by E2f was normalized to the induction of pGL3-Basic by E2f.
ChIP Assay.
ChIP was performed in mouse organs as described (8). Rabbit polyclonal antibodies against E2f1 (Cell Signaling; antibody 3742), E2f3 (Santa Cruz; sc-878), or IgG (Millipore; PP64) as negative control, were used for immunoprecipitation. After ChIP, the recovered DNA was analyzed by real-time PCR using custom-designed primers specific to different regions of the mouse Igf2 promoter, and normalized to the starting DNA (Input). Sequences for primers used were provided in SI Materials and Methods.
Microarray Analysis.
Expression microarray datasets were obtained from GEO, and IGF2 and E2F3 expression was extracted. To compare expression of normal human fetal versus adult liver and kidney, the dataset accession numbers used were as follows: liver, GSE1133, GSE2361, GSE7905, GSE14938; kidney, GSE6280, GSE11151, GSE7905, GSE14938). Data were normalized to the mean adult levels in the same organ within the same dataset. To study expression in cancers, the following dataset accession numbers used were as follows: Prostate cancer, GSE3325, GSE6919, GSE6609; Bladder cancer, GSE13507; Wilms tumor, GSE6280, GSE11024, GSE11151. All data were normalized to the mean for normal tissue within the same dataset.
Supplementary Material
Acknowledgments
We thank Dr. Ivan Ovcharenko at the National Center for Biotechnology Information for help with the use of DiRE. This work was supported by the Intramural Research Program of the Eunice Kennedy Shriver National Institute of Child Health and Human Development, National Institutes of Health.
Footnotes
The authors declare no conflict of interest.
This article is a PNAS Direct Submission.
This article contains supporting information online at www.pnas.org/lookup/suppl/doi:10.1073/pnas.1219079110/-/DCSupplemental.
References
- 1.DeChiara TM, Efstratiadis A, Robertson EJ. A growth-deficiency phenotype in heterozygous mice carrying an insulin-like growth factor II gene disrupted by targeting. Nature. 1990;345(6270):78–80. doi: 10.1038/345078a0. [DOI] [PubMed] [Google Scholar]
- 2.Ferguson-Smith AC, Cattanach BM, Barton SC, Beechey CV, Surani MA. Embryological and molecular investigations of parental imprinting on mouse chromosome 7. Nature. 1991;351(6328):667–670. doi: 10.1038/351667a0. [DOI] [PubMed] [Google Scholar]
- 3.Morison IM, Becroft DM, Taniguchi T, Woods CG, Reeve AE. Somatic overgrowth associated with overexpression of insulin-like growth factor II. Nat Med. 1996;2(3):311–316. doi: 10.1038/nm0396-311. [DOI] [PubMed] [Google Scholar]
- 4.Murphy R, Ibáñez L, Hattersley A, Tost J. IGF2/H19 hypomethylation in a patient with very low birthweight, preocious pubarche and insulin resistance. BMC Med Genet. 2012;13:42. doi: 10.1186/1471-2350-13-42. [DOI] [PMC free article] [PubMed] [Google Scholar]
- 5.Gicquel C, et al. Epimutation of the telomeric imprinting center region on chromosome 11p15 in Silver-Russell syndrome. Nat Genet. 2005;37(9):1003–1007. doi: 10.1038/ng1629. [DOI] [PubMed] [Google Scholar]
- 6.Murphy R, et al. Severe intrauterine growth retardation and atypical diabetes associated with a translocation breakpoint disrupting regulation of the insulin-like growth factor 2 gene. J Clin Endocrinol Metab. 2008;93(11):4373–4380. doi: 10.1210/jc.2008-0819. [DOI] [PubMed] [Google Scholar]
- 7.Lui JC, Finkielstain GP, Barnes KM, Baron J. An imprinted gene network that controls mammalian somatic growth is down-regulated during postnatal growth deceleration in multiple organs. Am J Physiol Regul Integr Comp Physiol. 2008;295(1):R189–R196. doi: 10.1152/ajpregu.00182.2008. [DOI] [PMC free article] [PubMed] [Google Scholar]
- 8.Lui JC, et al. Coordinated postnatal down-regulation of multiple growth-promoting genes: Evidence for a genetic program limiting organ growth. FASEB J. 2010;24(8):3083–3092. doi: 10.1096/fj.09-152835. [DOI] [PMC free article] [PubMed] [Google Scholar]
- 9.Rechler MM, Nissley SP. In: Peptide Growth Factors and their Receptors. Sporn MB, Roberts AB, editors. New York: Springer; 1990. pp. 236–362. [Google Scholar]
- 10.Scott J, et al. Insulin-like growth factor-II gene expression in Wilms’ tumour and embryonic tissues. Nature. 1985;317(6034):260–262. doi: 10.1038/317260a0. [DOI] [PubMed] [Google Scholar]
- 11.Li X, et al. Expression levels of the insulin-like growth factor-II gene (IGF2) in the human liver: Developmental relationships of the four promoters. J Endocrinol. 1996;149(1):117–124. doi: 10.1677/joe.0.1490117. [DOI] [PubMed] [Google Scholar]
- 12.Sussenbach JS. The gene structure of the insulin-like growth factor family. Prog Growth Factor Res. 1989;1(1):33–48. doi: 10.1016/0955-2235(89)90040-9. [DOI] [PubMed] [Google Scholar]
- 13.Wu HK, Squire JA, Song Q, Weksberg R. Promoter-dependent tissue-specific expressive nature of imprinting gene, insulin-like growth factor II, in human tissues. Biochem Biophys Res Commun. 1997;233(1):221–226. doi: 10.1006/bbrc.1997.6431. [DOI] [PubMed] [Google Scholar]
- 14.Vu TH, Hoffman AR. Promoter-specific imprinting of the human insulin-like growth factor-II gene. Nature. 1994;371(6499):714–717. doi: 10.1038/371714a0. [DOI] [PubMed] [Google Scholar]
- 15.Jansen M, et al. In: Growth Factors: From Genes to Clinical Application. Sara VR, Hall K, Low H, editors. New York: Raven; 1990. [Google Scholar]
- 16.Ogawa O, et al. Relaxation of insulin-like growth factor II gene imprinting implicated in Wilms’ tumour. Nature. 1993;362(6422):749–751. doi: 10.1038/362749a0. [DOI] [PubMed] [Google Scholar]
- 17.Hahn H, et al. Patched target Igf2 is indispensable for the formation of medulloblastoma and rhabdomyosarcoma. J Biol Chem. 2000;275(37):28341–28344. doi: 10.1074/jbc.C000352200. [DOI] [PubMed] [Google Scholar]
- 18.Zhan S, Shapiro DN, Helman LJ. Activation of an imprinted allele of the insulin-like growth factor II gene implicated in rhabdomyosarcoma. J Clin Invest. 1994;94(1):445–448. doi: 10.1172/JCI117344. [DOI] [PMC free article] [PubMed] [Google Scholar]
- 19.Rainier S, et al. Relaxation of imprinted genes in human cancer. Nature. 1993;362(6422):747–749. doi: 10.1038/362747a0. [DOI] [PubMed] [Google Scholar]
- 20.Bracken AP, Ciro M, Cocito A, Helin K. E2F target genes: Unraveling the biology. Trends Biochem Sci. 2004;29(8):409–417. doi: 10.1016/j.tibs.2004.06.006. [DOI] [PubMed] [Google Scholar]
- 21.McClellan KA, Slack RS. Specific in vivo roles for E2Fs in differentiation and development. Cell Cycle. 2007;6(23):2917–2927. doi: 10.4161/cc.6.23.4997. [DOI] [PubMed] [Google Scholar]
- 22.Gotea V, Ovcharenko I. DiRE: Identifying distant regulatory elements of co-expressed genes. Nucleic Acids Res. 2008;36(Web Server issue):W133–139. doi: 10.1093/nar/gkn300. [DOI] [PMC free article] [PubMed] [Google Scholar]
- 23.Leone G, et al. Identification of a novel E2F3 product suggests a mechanism for determining specificity of repression by Rb proteins. Mol Cell Biol. 2000;20(10):3626–3632. doi: 10.1128/mcb.20.10.3626-3632.2000. [DOI] [PMC free article] [PubMed] [Google Scholar]
- 24.Chong JL, et al. E2f3a and E2f3b contribute to the control of cell proliferation and mouse development. Mol Cell Biol. 2009;29(2):414–424. doi: 10.1128/MCB.01161-08. [DOI] [PMC free article] [PubMed] [Google Scholar]
- 25.Tsai SY, et al. Mouse development with a single E2F activator. Nature. 2008;454(7208):1137–1141. doi: 10.1038/nature07066. [DOI] [PMC free article] [PubMed] [Google Scholar]
- 26.Monk D, et al. Imprinting of IGF2 P0 transcript and novel alternatively spliced INS-IGF2 isoforms show differences between mouse and human. Hum Mol Genet. 2006;15(8):1259–1269. doi: 10.1093/hmg/ddl041. [DOI] [PubMed] [Google Scholar]
- 27.Constância M, et al. Placental-specific IGF-II is a major modulator of placental and fetal growth. Nature. 2002;417(6892):945–948. doi: 10.1038/nature00819. [DOI] [PubMed] [Google Scholar]
- 28.Rabinovich A, Jin VX, Rabinovich R, Xu X, Farnham PJ. E2F in vivo binding specificity: Comparison of consensus versus nonconsensus binding sites. Genome Res. 2008;18(11):1763–1777. doi: 10.1101/gr.080622.108. [DOI] [PMC free article] [PubMed] [Google Scholar]
- 29.Polager S, Ginsberg D. p53 and E2f: Partners in life and death. Nat Rev Cancer. 2009;9(10):738–748. doi: 10.1038/nrc2718. [DOI] [PubMed] [Google Scholar]
- 30.Foster CS, et al. Transcription factor E2F3 overexpressed in prostate cancer independently predicts clinical outcome. Oncogene. 2004;23(35):5871–5879. doi: 10.1038/sj.onc.1207800. [DOI] [PubMed] [Google Scholar]
- 31.Olsson AY, et al. Role of E2F3 expression in modulating cellular proliferation rate in human bladder and prostate cancer cells. Oncogene. 2007;26(7):1028–1037. doi: 10.1038/sj.onc.1209854. [DOI] [PubMed] [Google Scholar]
- 32.Feber A, et al. Amplification and overexpression of E2F3 in human bladder cancer. Oncogene. 2004;23(8):1627–1630. doi: 10.1038/sj.onc.1207274. [DOI] [PubMed] [Google Scholar]
- 33.Oeggerli M, et al. E2F3 amplification and overexpression is associated with invasive tumor growth and rapid tumor cell proliferation in urinary bladder cancer. Oncogene. 2004;23(33):5616–5623. doi: 10.1038/sj.onc.1207749. [DOI] [PubMed] [Google Scholar]
- 34.Oeggerli M, et al. E2F3 is the main target gene of the 6p22 amplicon with high specificity for human bladder cancer. Oncogene. 2006;25(49):6538–6543. doi: 10.1038/sj.onc.1209946. [DOI] [PubMed] [Google Scholar]
- 35.Kort EJ, et al. The E2F3-Oncomir-1 axis is activated in Wilms’ tumor. Cancer Res. 2008;68(11):4034–4038. doi: 10.1158/0008-5472.CAN-08-0592. [DOI] [PMC free article] [PubMed] [Google Scholar]
- 36.Smerieri A, et al. Effects of cord serum insulin, IGF-II, IGFBP-2, IL-6 and cortisol concentrations on human birth weight and length: Pilot study. PLoS ONE. 2011;6(12):e29562. doi: 10.1371/journal.pone.0029562. [DOI] [PMC free article] [PubMed] [Google Scholar]
- 37.Giudice LC, et al. Insulin-like growth factors and their binding proteins in the term and preterm human fetus and neonate with normal and extremes of intrauterine growth. J Clin Endocrinol Metab. 1995;80(5):1548–1555. doi: 10.1210/jcem.80.5.7538146. [DOI] [PubMed] [Google Scholar]
- 38.Bjornsson HT, et al. Epigenetic specificity of loss of imprinting of the IGF2 gene in Wilms tumors. J Natl Cancer Inst. 2007;99(16):1270–1273. doi: 10.1093/jnci/djm069. [DOI] [PMC free article] [PubMed] [Google Scholar]
- 39.Wang WH, Duan JX, Vu TH, Hoffman AR. Increased expression of the insulin-like growth factor-II gene in Wilms’ tumor is not dependent on loss of genomic imprinting or loss of heterozygosity. J Biol Chem. 1996;271(44):27863–27870. doi: 10.1074/jbc.271.44.27863. [DOI] [PubMed] [Google Scholar]
- 40.Amit D, Tamir S, Birman T, Gofrit ON, Hochberg A. Development of targeted therapy for bladder cancer mediated by a double promoter plasmid expressing diphtheria toxin under the control of IGF2-P3 and IGF2-P4 regulatory sequences. Int J Clin Exp Med. 2011;4(2):91–102. [PMC free article] [PubMed] [Google Scholar]
- 41.Mineo R, Fichera E, Liang SJ, Fujita-Yamaguchi Y. Promoter usage for insulin-like growth factor-II in cancerous and benign human breast, prostate, and bladder tissues, and confirmation of a 10th exon. Biochem Biophys Res Commun. 2000;268(3):886–892. doi: 10.1006/bbrc.2000.2225. [DOI] [PubMed] [Google Scholar]
- 42.Ovcharenko I, et al. Mulan: Multiple-sequence local alignment and visualization for studying function and evolution. Genome Res. 2005;15(1):184–194. doi: 10.1101/gr.3007205. [DOI] [PMC free article] [PubMed] [Google Scholar]
Associated Data
This section collects any data citations, data availability statements, or supplementary materials included in this article.