Abstract
Cancer stem cells (CSCs) are plastic in nature, a characteristic that hampers cancer therapeutics. Neuroblastoma (NB) is a pediatric tumor of neural crest origin, and half of the cases are highly aggressive. By treating NB cell lines [SKNAS, SKNBE(2)C, CHP134, and SY5Y] with epigenetic modifiers for a short time, followed by sphere-forming culture conditions, we have established stem cell–like NB cells that are phenotypically stable for more than a year. These cells are characterized by their high expression of stemness factors, stem cell markers, and open chromatin structure. We referred to these cells as induced CSCs (iCSCs). SKNAS iCSC and SKNBE(2)C iCSC clones (as few as 100 cells) injected s.c. into SCID/Beige mice formed tumors, and in one case, SKNBE(2)C iCSCs metastasized to the adrenal gland, suggesting their increased metastatic potential. SKNAS iCSC xenografts showed the histologic appearance of totally undifferentiated large-cell NBs (LCNs), the most aggressive and deadly form of NB in humans. Immunohistochemical analyses showed that SKNAS iCSC xenografts expressed high levels of the stem cell marker CXCR4, whereas the SKNAS monolayer cell xenografts did not. The patterns of CXCR4 and MYC expression in SKNAS iCSC xenografts resembled those in the LCNs. The xenografts established from the NB iCSCs shared two common features: the LCN phenotype and high-level MYC/MYCN expression. These observations suggest both that NB cells with large and vesicular nuclei, representing their open chromatin structure, are indicative of stem cell–like tumor cells and that epigenetic changes may have contributed to the development of these most malignant NB cells.
Keywords: tumor initiating cells, prominent nucleoli
Neuroblastoma (NB) is the most common extracranial pediatric malignancy. Although some NBs are easily treatable, nearly 50% of the tumors exhibit aggressive behavior. The International Neuroblastoma Risk Group Classification is used to classify NB at diagnosis (1). High-risk NBs are associated with older age, advanced stages, unfavorable histologic features, widespread tumor dissemination, and poor long-term survival (1). Current treatment for these NBs includes high-dose chemotherapy or myeloablative cytotoxic therapy with autologous hematopoietic stem cell transplantation (2). However, late relapse is often seen despite achieving complete clinical remission. A subset of high-risk NBs, which is refractory to current frontline therapy designed for high-risk NB, is termed ultra-high-risk NB (3, 4).
NB is histopathologically defined as neuroblastic tumors with less than 50% Schwannian stromal components. On the basis of the degree of neuronal differentiation, NB is further divided into undifferentiated (UD), poorly differentiated, and differentiating subtypes (5, 6). A unique histological subset of NBs within the UD and poorly differentiated subtypes has also been identified (7, 8). These tumors are uniformly composed of large cells with sharply outlined nuclear membranes and one to four prominent nucleoli and are referred to as large-cell neuroblastomas, or LCNs. Patients with the UD neuroblastoma characterized by the LCN appearance had a very poor prognosis regardless of age at diagnosis, clinical stage, and DNA index. In addition, non–MYCN-amplified UDs behaved significantly worse than MYCN-amplified UDs (9).
In this study, we established phenotypically stabilized stem cell–like NB cells (referred to as induced cancer stem cells, or iCSCs) by short-term treatments of conventional NB cell lines with epigenetic modifiers. Our approach was analogous to induced pluripotent stem cell studies (10, 11), in which a few stemness/reprogramming factors (SOX2, OCT4, NANOG, LIN28, KLF4, and MYC/MYCN) were shown to initiate reverse differentiation or reprogramming of somatic cells. Once the reprogramming process is initiated by the ectopic expression of stemness factors, it becomes a self-driven process: Demethylation of endogenous stemness-factor gene promoters takes place and induces endogenous stemness factors, which replace the exogenous counterparts. Subsequently, the cell can sustain the stemness state under ES cell culture conditions (12). Our in vitro and in vivo studies show that the NB iCSCs are characterized by their high expression of stemness factors and stem cell markers, their open chromatin structure, a high tumor-initiating ability, a high metastatic potential, and the histological appearance of the totally undifferentiated LCN, having large vesicular nuclei with one or more prominent nucleoli. In addition to the LCN phenotype, the high-level MYC/MYCN protein expression is the consistent feature of the iCSC xenografts. Our data suggest that cancer cells with large and vesicular nuclei, representing their open chromatin structure, are indicative of stem cell–like tumor cells and that epigenetic changes may have contributed to the development of these most malignant cancer cells.
Results
Short-Term Treatments with Epigenetic Modifiers Enhance the Expression of Stemness Factor and Stem Cell Marker Genes in NB Cells.
To examine whether epigenetic modifiers could augment the expression of stemness factor genes and thus enhance the stemness of NB cells, we first treated SKNAS in monolayer culture with an inhibitor of DNA methylation (5-aza-2′-deoxycytidine, or 5AdC) for 5 d. SKNAS is a non–MYCN amplified cell line and expresses high levels of MYC. As shown in Fig. S1A, the expression of stemness factors (SOX2, POU5F1 encoding OCT4, KLF4) was augmented in the 5AdC-treated SKNAS cells. In addition, the expression of stem cell markers (CXCR4, PROM1 encoding CD133, and ABCG2) and neural crest stem cell marker (NGFR encoding p75NTR) was elevated in these 5AdC- treated cells.
Conventional adherent monolayer NB cells can be adapted to grow as spheres in a sphere-forming medium, and these spheres expressed elevated levels of a limited number of stemness factors (Fig. S1B). The treatment of SKNAS spheres with inhibitors of DNA methylation (5AdC) and/or histone deacetylase (4-phenylbutyrate, or 4PB) significantly augmented the expression of SOX2, POU5F1, KLF4, NANOG, LIN28, CXCR4, PROM1, NGFR, and ABCG2. MYC expression remained high in SKNAS spheres with or without drug treatments (Fig. S1B). These data indicate that short-term treatments with epigenetic modifiers could augment the stemness phenotype of NB cells. Similar observations were also made in MYCN-amplified SKNBE(2)C (Fig. S1C) and CHP134 (Fig. S2A), as well as non–MYCN-amplified SY5Y cells (Fig. S2B).
Establishment of Induced Stable Stem Cell–Like NB Cells.
The combination of 5AdC and 4PB was the most effective in inducing stemness genes, but it was also the most cytocidal to the NB cells (13). Among the treatments, 5AdC had the least cytocidal effect, and consequently more viable cells were obtained. We thus first used the 5AdC-treated SKNAS cells to establish phenotypically stabilized stem cell–like NB cells. SKNAS monolayer cells were treated with 5AdC (2.5 μM) for 5 d and then transferred to RPMI 1640 supplemented with 0.5% FBS in nonadherent culture plates without 5AdC. These cells formed spheres but did not grow. When transferred to the sphere-forming medium without 5AdC, the spheres started to proliferate (see SI Materials and Methods for rationale for this procedure). Stemness phenotypes of these spheres were examined periodically for more than 1.5 y while they were maintained in culture.
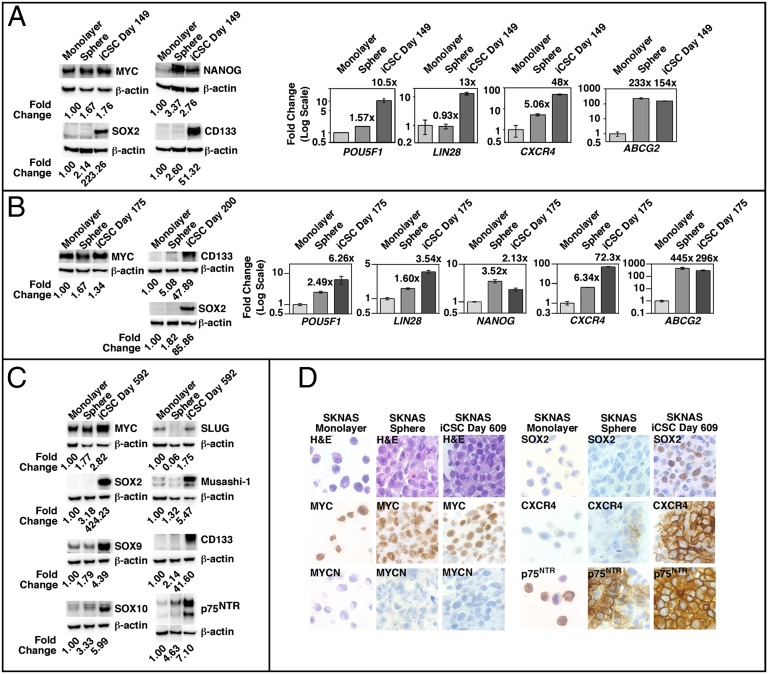
As shown in Fig. 1A, without further exposure to epigenetic modifiers for 149 d, the expression of stemness factor and stem cell marker proteins (MYC, SOX2, NANOG, and CD133) remained high in the short-term 5AdC-treated SKNAS (or 5AdC-induced) sphere culture compared with the monolayer cells or non-drug-treated spheres. Similar observations were also made for the expression of the POU5F1, LIN28, CXCR4, and ABCG2 genes (Fig. 1A). The stable stemness phenotypes were also observed in the 5AdC-induced SKNAS sphere at day 175 and day 200 (Fig. 1B). Furthermore, the 5AdC-induced SKNAS sphere culture grown in the sphere-forming condition without 5AdC for 1.5 y (day 592) expressed higher levels of SOX2, CD133, and neural crest stem cell markers (p75NTR, SOX9, SOX10, SLUG, Musashi-1) compared with the non-drug-treated sphere culture and the monolayer counterpart (Fig. 1C), suggesting that these SKNAS spheres express a phenotype more similar to neural crest stem cells (14–18). Immunocytochemical assay further showed that the 5AdC-induced SKNAS spheres at day 609 expressed MYC, SOX2, CXCR4, and p75NTR (Fig. 1D). Subsequently, we generated similar sphere cultures from three additional NB cell lines [SKNBE(2)C, CHP134, and SY5Y], using a similar procedure described for SKNAS (SI Materials and Methods). SKNBE(2)C and CHP134 are MYCN-amplified lines and expressed high levels of MYCN, whereas SY5Y is a non–MYCN-amplified cell line and expressed high levels of MYC. As shown in Fig. S3, stemness phenotypes were augmented in the sphere cultures derived from SKNBE(2)C, CHP134, and SY5Y initially treated with epigenetic modifiers for 5 d.
Fig. 1.
The expression of stemness factor and stem cell marker genes and proteins in SKNAS iCSCs at day 149, day 175, day 200, day 592, and day 609. The SKNAS sphere culture has never been treated with epigenetic modifiers, whereas the SKNAS iCSCs were initially treated with 5AdC (2.5 μM) for 5 d and then cultured in the sphere-forming condition without 5AdC for the period indicated (day 149, day 175, day 200, day 592, and day 609). The expression of proteins of interest was examined by Western blot analysis, as previously described (25). Fold change in protein expression based on the densitometry analysis of the protein examined against β-actin was shown. The expression of genes indicated was examined in duplicate by TaqMan qPCR, using gene-specific TaqMan Gene Expression Assays (Applied Biosystems). (A and B) Expression levels of the genes examined were presented as fold change in the SKNAS sphere culture or iCSCs over the monolayer cells at day 149 and day 175. The expression of the proteins indicated was also examined in the SKNAS monolayer cells, non-drug-treated spheres, and iCSCs at day 149, day 175, and day 200. (C) Proteins of interest were examined in SKNAS monolayer cells, non-drug-treated spheres, and iCSCs at day 592. (D) Immunocytochemical assay was performed on cell block preparations of SKNAS monolayer cells, non-drug-treated spheres, and iCSCs at day 609 to investigate expression levels of MYC, MYCN, SOX2, CXCR4, and p75NTR (see SI Materials and Methods for description of procedures).
If the method delineated in this study worked as intended and these epigenetic modifier–pretreated NB sphere cells were indeed converted to stem cell–like cells, then these epigenetic modifier–induced spheres would have a more open chromatin than their monolayer cell counterparts. To test this idea, we examined the expression of acetylated histone H3 in the spheres, as histone acetylation is generally considered to be a marker of open chromatin (19). As shown in Fig. S4A, in all cases, acetylation of histone H3 was higher in the spheres than in the monolayer cell counterparts. Because open chromatin is a hallmark of stem cells, we referred to the NB spheres created by short-term treatment of epigenetic modifiers as iCSCs.
Gene Expression Profiling Analysis of SKNAS iCSCs.
To gain further insight into molecular characteristics of stem cell–like NB cells, gene expression profiling analysis was performed using SKNAS iCSCs. SKNAS iCSCs expressed elevated levels of genes involved in stem cell pathways (NOTCH/DELTA, BMPR/BMP, and FZD/WNT) and genes highly expressed in other CSC types. These include ALDH1B1 (colon carcinoma (20); BIN1, COL1A1, COL1A2, ENPP2, and THY1 (breast CSC-like cells (21); and PDPN (glioblastoma sphere cultures) (22). TaqMan quantitative PCR (qPCR) assays (Applied Biosystems) confirmed the microarray data (Fig. S5 A and B). Ingenuity pathway analysis indicated that the STAT3 network was activated in SKNAS iCSC, further confirming the stemness status of SKNAS iCSCs (Fig. S5C). This could explain the high expression of MYC and POU5F1 in the iCSC, as STAT3 is known to activate MYC and POU5F1.
Heat Shock Protein 90 (Hsp90) Inhibition Shows Preferential Efficacy Against SKNAS iCSCs over Monolayer Cells.
It has been shown that Hsp90 inhibition could sensitize chemoresistant CSC-like cells to DNA-damaging agents (23, 24). We also reported that Hsp90 inhibition resulted in destabilizing MYCN and MYC in NB cells (25). These observations prompted us to examine whether or not an Hsp90 inhibitor had a differential effect on the growth of SKNAS iCSCs and SKNAS monolayer cells. As shown in Fig. S4B, SKNAS iCSCs were ∼15 times more susceptible to growth suppression by 17-(dimethylaminoethylamino)-17-demethoxygeldanamycin, an Hsp90 inhibitor, at day 2 of drug treatment. Western blot analysis also showed that treatments with this inhibitor resulted in a more than 50% reduction of MYC in a single day of drug treatments in both cell types (Fig. S4C).
High Tumor-Initiating Ability of SKNAS iCSCs.
We next evaluated the tumor-seeding ability of SKNAS iCSCs and SKNAS monolayer cells. SKNAS iCSCs and monolayer cells were injected s.c. into SCID/Beige mice using different cell dosages (106, 104, and 102). As shown in Fig. 2, although 100% of the mice injected with either iCSCs or monolayer cells (106 and 104) developed tumors, mice injected with SKNAS iCSCs formed tumors significantly faster than those receiving the monolayer cell counterpart.
Fig. 2.

Tumorigenicity of SKNAS iCSCs and monolayer cells in SCID/Beige mice. SKNAS iCSC and monolayer cells were injected s.c. into mice using different cell dosages (106, 104, and 102). Tumor growth was monitored up to 109 d after cell injection. Each data point represented the average days that tumors took to reach 0.5 cm3 in size. Seven of seven mice injected with 106 SKNAS iCSC and six of six mice injected with 106 SKNAS monolayer cells developed tumors. Similarly, nine of nine mice injected with 104 SKNAS iCSCs and six of six mice injected with 104 SKNAS monolayer cells developed tumors. In contrast, nine of nine mice injected with 102 iCSCs developed tumors, whereas only seven of 10 mice injected with 102 monolayer cells had tumor growth.
A more striking observation was made in the mice injected with 102 SKNAS iCSCs: As shown in Fig. 2, all of the nine mice injected with 102 iCSCs had tumors (100% tumor take). In addition, these iCSC tumors reached 0.5 cm3 in size after between 31 and 68 d of the cell injections. In contrast, among 10 mice injected with 102 monolayer cells, seven mice developed tumors (70% tumor take). Growth rates of these monolayer cell xenografts were much slower than those of the iCSC xenografts. Mice injected with 102 monolayer cells developed tumors that reached 0.5 cm3 in size after 68 to 109 d of the cell injections. The tumorigenicity of SKNAS iCSCs was therefore more potent than that of SKNAS monolayer cells. Together, these data suggest that the iCSCs function as stem cell–like tumor-initiating cells.
Differential Expression of CXCR4 in the SKNAS iCSC Xenografts over Monolayer Cell Counterparts.
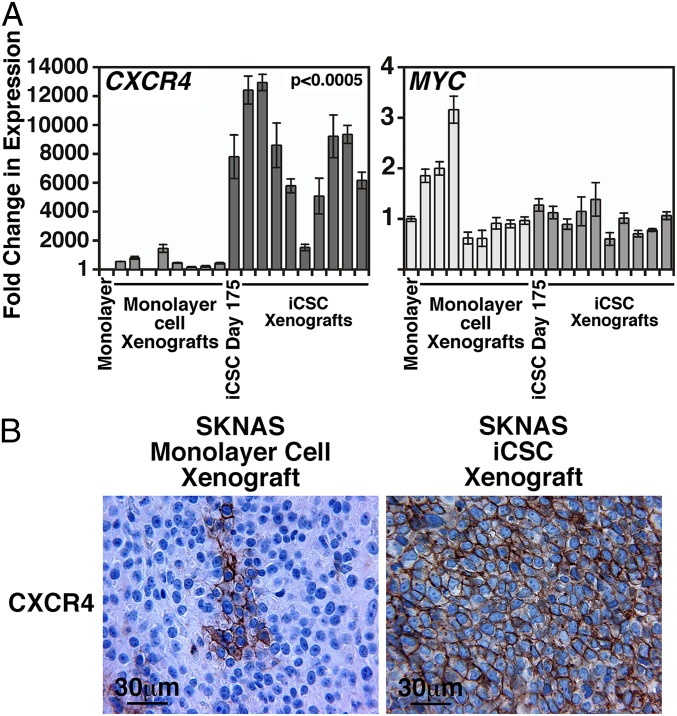
To investigate whether the SKNAS iCSC xenografts retained their high expression of stemness factor and stem cell marker genes, we examined the expression of these genes in nine SKNAS iCSC xenografts and eight SKNAS monolayer cell xenografts. Among the stemness factor genes examined (Fig. S6), the expression of MYC (Fig. 3A) and NANOG (Fig. S6) was high in both iCSC and monolayer cell xenografts. In contrast, the SKNAS iCSC xenografts preferentially expressed high levels of CXCR4, and there was little or no CXCR4 expression in the monolayer cell xenografts (Fig. 3A). Immunohistochemical analysis further showed the preferential expression of CXCR4 in SKNAS iCSCs over monolayer cell xenografts (Fig. 3B).
Fig. 3.
Differential expression of CXCR4 in SKNAS iCSC and monolayer cell xenografts. (A) The expression of CXCR4 and MYC was examined by TaqMan qPCR in SKNAS monolayer cell and iCSC xenografts, as described in Fig. 1. SKNAS monolayer cells and the in vitro culture of SKNAS iCSCs (day 175) were included as controls. Expression levels of the genes were presented as fold change over SKNAS monolayer cells in SKNAS iCSCs at day 175, SKNAS monolayer cell xenografts, and SKNAS iCSC xenografts. (B) Immunohistochemical analysis showed that SKNAS iCSC xenografts were uniformly positive for CXCR4. In contrast, SKNAS monolayer cell xenografts were negative for CXCR4, with the exception of some rare cases in which a few cells were focally positive for CXCR4 staining.
SKNBE(2)C iCSC Clones also Show a High Tumor-Initiating Ability.
Two SKNBE(2)C iCSC clones were generated from the bulk SKNBE(2)C iCSC sphere culture by limiting dilution (Fig. S3 A–C). SCID/Beige mice were s.c. injected with 102 or 103 cells of SKNBE(2)C iCSC clone 1 or clone 2. The tumor-initiating ability of clone 2 was higher than those of clone 1 and the monolayer cells. Six (86%) of seven injections of 102 SKNBE(2)C iCSC clone 2 cells gave rise to tumors, and all five injections (100%) of 103 SKNBE(2)C iCSC clone 2 cells gave rise to tumors. In contrast, four (80%) of five injections of 103 SKNBE(2)C iCSC clone 1 gave rise to tumors. No tumor was observed in mice injected with 102 cells of clone 1. However, one of the tumor-bearing mice injected with clone 1 cells had metastasis in the left adrenal gland (see Fig. 6), suggesting an increase in its metastatic potential. The tumor take of SKNBE(2)C monolayer cells at 102 and 103 cells/injection was 6/8 (75%) and 8/8 (100%), respectively.
Fig. 6.
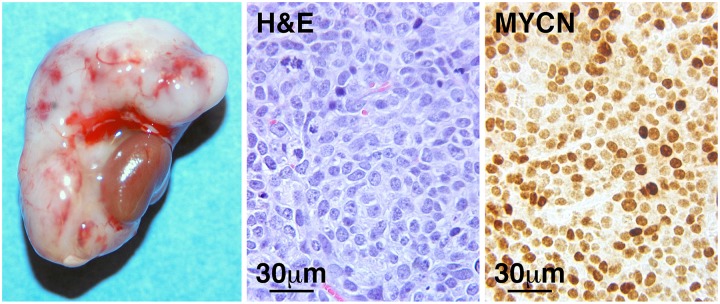
The adrenal gland metastasis of SKNBE(2)C iCSC clone 1 shows the LCN phenotype and expresses high levels of MYCN. The procedures used are described in Fig. 5.
NB iCSC Xenografts Resemble Human Totally Undifferentiated LCNs, the Most Aggressive and Deadly Form of NB.
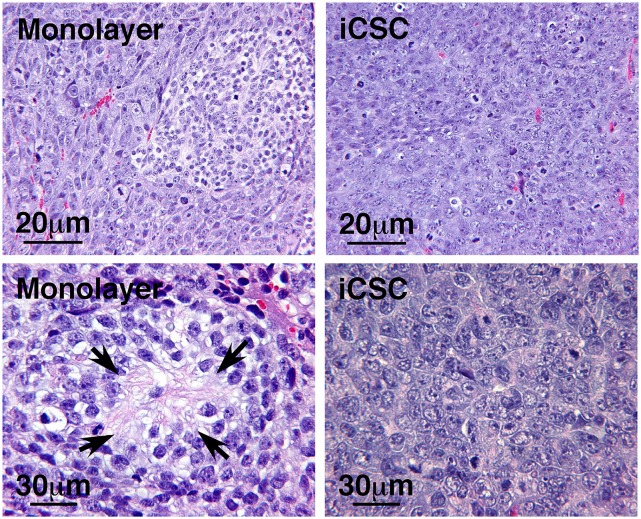
We next examined histopathological characteristics of SKNAS iCSC xenografts (n = 17) and monolayer cell xenografts (n = 8). The monolayer cell xenografts presented a mosaic pattern and were composed of at least two distinct components having different cellular morphologies. Tumor cells in the first component were larger cells, and tumor cells in the other component were smaller in both cellular and nuclear size and had smaller nucleoli (Fig. 4, Upper Left). Furthermore, the small tumor cells in the second component had reduced activities of mitosis and karyorrhexis (either intermediate Mitosis-Karyorrhexis Index (MKI) of 100∼200/5,000 cells or low MKI of <100/5,000 cells) and often produced neurites or neuropils (Fig. 4, Lower Left). The monolayer cell xenografts were thus classified as poorly differentiated NB.
Fig. 4.
Histopathological examinations of SKNAS monolayer cell and iCSC xenografts. The monolayer cell xenografts were composed of two distinct components having different cellular morphologies. Tumor cells in the first component were larger cells, and tumor cells in the other component were smaller in both cellular and nuclear size and had smaller nucleoli. These small tumor cells often produced neurites or neuropils (Arrows). The monolayer cell xenografts were thus classified as poorly differentiated NB. In contrast, iCSC xenografts were composed of uniformly large cells with vesicular nuclei and one or more prominent nucleoli, and thus were classified as totally undifferentiated LCNs.
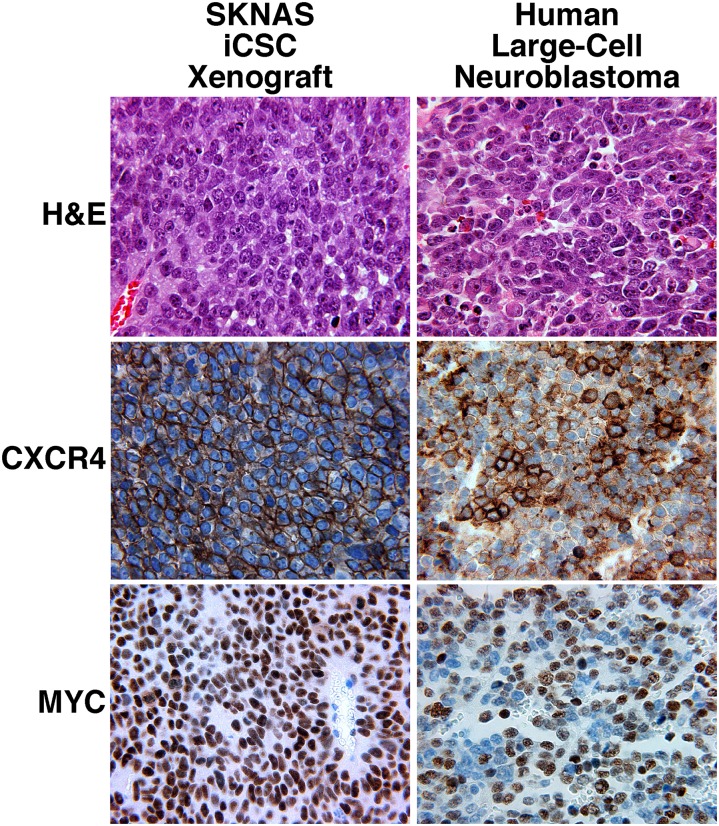
In contrast, the iCSC xenografts were composed of a diffuse and solid growth of medium-sized, rather uniform cells with a large vesicular nucleus and one or a few prominent nucleoli (Fig. 4, Right). Mitotic and karyorrhectic activities were frequently encountered (either intermediate MKI of 100∼200/5,000 cells or high MKI of >200/5,000 cells). The iCSC xenografts were thus classified as totally undifferentiated LCNs (Fig. 5), according to the International Neuroblastoma Pathology Classification (5–8). In addition, immunohistochemical analysis showed that the patterns of CXCR4 and MYC expression in SKNAS iCSC xenografts were similar to those in human LCNs (Fig. 5). It should be mentioned that both the larger and smaller cells of the monolayer cell xenografts were negative for CXCR4 staining, except in some rare cases where a few cells were focally positive for CXCR4 staining (Fig. 3B). These observations suggest that the large cells in SKNAS iCSC xenografts had different molecular and biological characteristics from the larger cells in the monolayer cell xenografts.
Fig. 5.
Histopathological examinations of SKNAS iCSC xenografts and the human LCNs. H&E stained sections showed that the SKNAS iCSC xenografts resembled human undifferentiated LCNs histologically. The patterns of CXCR4 and MYC expression in SKNAS iCSC xenografts also resembled those in undifferentiated LCNs. Microscopic magnification of 400× was used for all pictures.
Histopathological examinations were also performed on the other iCSCs and their monolayer cell xenograft counterparts. As shown in Fig. S7A, although SKNBE(2)C, CHP134, and SY5Y monolayer cell xenografts were classified as poorly differentiated NB with neuropils and rosette formation [SKNBE(2)C, CHP134, and SY5Y] and a condensed nuclear appearance (SY5Y), xenografts of SKNBE(2)C iCSC, CHP134 iCSC, and SY5Y iCSC all had the LCN phenotype. In addition, the adrenal gland metastasis of SKNBE(2)C iCSC clone 1 retained the LCN phenotype (Fig. 6).
High-Level MYC/MYCN Protein Expression and the LCN Phenotype Are Unique Features of NB iCSC Xenografts.
To identify a common immunohistochemical feature of the iCSC xenografts, we examined the expression of MYC and MYCN proteins and stem cell markers (CXCR4, p75NTR) in the iCSC and monolayer cell xenografts. Our choice of the stem cell markers examined was based on their expression in iCSC in vitro and the availability of qualified antibodies for the analysis.
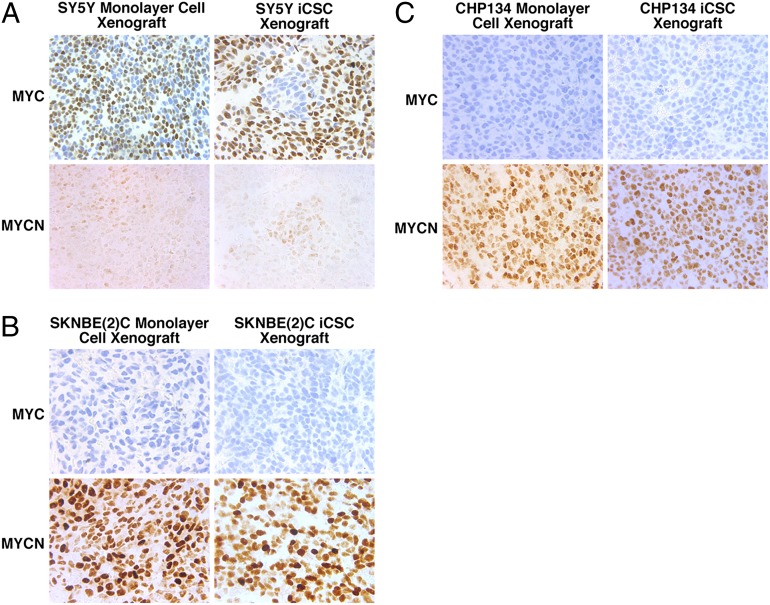
As previously shown in Fig. 5, MYC expression was uniformly high in the SKNAS iCSC xenografts. Interestingly, SY5Y iCSC xenografts showed a mosaic pattern consisting of the majority of high-MYC expressing cells and small islands of low-MYCN expressing cells (Fig. 7A). In contrast, in the SY5Y monolayer cell xenografts, the majority of high-MYC expressing cells were evenly intermingled with low-MYCN expressing cells (Fig. 7A). Our observations were in fact consistent with a previous study (26), which reported that the monolayer SY5Y line expressed low but detectable levels of MYCN protein in addition to the high MYC expression. The iCSC and monolayer cell xenografts of both SKNBE(2)C (Fig. 7B) and CHP134 (Fig. 7C), as well as the adrenal gland metastasis of SKNBE(2)C iCSC clone 1 (Fig. 6), expressed uniformly high levels of MYCN protein.
Fig. 7.
MYC and MYCN expression in NB monolayer cell and iCSC xenografts. (A) In the SY5Y monolayer cell xenografts, the majority of MYC-expressing cells were intermingled with the minority of MYCN-expressing cells. In the SY5Y iCSC xenografts, MYC-negative cells were, in fact, MYCN-expressing cells, which formed small islands in the majority of MYC-expressing cells. (B and C) SKNBE(2)C and CHP134 were MYCN-amplified cells and uniformly expressed high levels of MYCN in both monolayer cell and iCSC xenografts. The procedures used are described in Fig. 5. Microscopic magnification of 400× was used for all pictures.
As shown in Fig. 3B, CXCR4 was consistently expressed in the SKNAS iCSC xenografts. In addition, CXCR4 was preferentially expressed in SKNAS iCSCs over the monolayer cell counterpart. However, this was not always the case for the other iCSCs. Xenografts from both iCSC and monolayer cells of SKNBE(2)C, CHP134, SY5Y were all positive for CXCR4, but the staining in these cases was not intense and uniform (Fig. S7B).
We also examined in vivo expression of the neural crest stem cell marker p75NTR in the xenografts. In both SKNAS iCSC and monolayer cell xenografts, varying numbers of cells were positive for p75NTR. However, in the SKNAS monolayer cell xenografts, the cells with active neuropil formation were negative for p75NTR staining (Fig. 8), suggesting that p75NTR expression is not related to neuronal differentiation of NB cells. As shown in Fig. S8A, SKNBE(2)C monolayer cell xenografts were almost negative for p75NTR, whereas p75NTR expression was positive, although not consistently, in the SKNBE(2)C iCSC clone 2 s.c. xenografts. SKNBE(2)C iCSC clone 1 s.c. xenografts expressed p75NTR in a large area (Fig. S8A). Interestingly, the expression of p75NTR became very low in the adrenal metastasis of clone 1 (Fig. S8A). Similarly, although the majority of the cells in the SY5Y iCSCs expressed p75NTR, only a few cells in the SY5Y monolayer cell xenografts expressed p75NTR (Fig. S8B). p75NTR expression also was minimal in both CHP134 iCSC and monolayer cell xenografts (Fig. S8D). Collectively, our data show that the LCN phenotype and the high MYC/MYCN protein expression are the two common and consistent features of the NB iCSC xenografts.
Fig. 8.
The expression of p75NTR in SKNAS iCSC and monolayer cell xenografts. Varying numbers of cells were positive for p75NTR in both SKNAS iCSC and monolayer cell xenografts. However, in the SKNAS monolayer cell xenografts, the cells with active neuropil formations were negative for p75NTR staining (Arrows). Microscopic magnification of 400× was used for four pictures in the upper and middle rows, and 100× was used for two pictures in the lower row.
Discussion
In this study, we have created phenotypically stabilized stem cell–like tumor-initiating NB cells that resemble histopathologically very aggressive NBs in patients (also known as totally undifferentiated LCNs). Our approach includes a short-term treatment of NB cell lines with epigenetic modifiers followed by culturing of the cells in sphere-forming medium without epigenetic modifiers. This strategy not only significantly augments the stemness of NB cells but also captures the cells in a “totally undifferentiated status” during a long period in vitro and in vivo. We refer to these NB cells as iCSCs. As described, we have found two common and consistent features among the NB iCSC xenografts examined, the LCN phenotype and high MYC/MYCN protein expression, which in turn have significant clinical implications.
Ultra-high-risk NBs and totally undifferentiated LCNs exhibit a similar clinical aggressiveness, although these two groups of tumors have been distinguished by two different criteria: unresponsiveness to the current high-risk therapy and histopathological totally undifferentiated large-cell characteristics, respectively (3, 4, 7, 8). It remains to be determined whether ultra-high-risk NBs share the same identity with the totally undifferentiated LCNs and thus are NB stem cell disease. Our results suggest that tumor-targeted Hsp90 inhibition could be an effective strategy to control highly malignant NB driven by the CSC compartment. Nonetheless, an unbiased high-throughput screening of small molecules would eventually be required to develop effective therapeutics against such tumors. These compounds should be preferentially efficacious against CSC, as opposed to normal stem cells, progenitor cells, and differentiating cells. A successful screening of such lead compounds would rely on the availability of phenotypically stable robust CSC preparations. The iCSCs described in this study would well serve this future research direction.
The most intriguing implication in this study is perhaps the relationship between the large vesicular nuclei of the cancer cells, the stem cell–like status of the cancer cells, and the poor prognosis of the patients. Neuroblastomas in general have small round nuclei with stippled (“salt and pepper”) chromatin, which is suggestive of high heterochromatin content. However, totally undifferentiated LCNs and xenografts of the iCSCs generated have the histological appearance of large and vesicular nuclei, which is indicative of having high euchromatin or open chromatin contents. In fact, this characteristic is one of the histological and ultrastructural hallmarks of stem cells (19, 27, 28). A highly malignant pediatric tumor, large-cell medulloblastoma, also shows this nuclear feature (29). In addition, various malignancies with a rhabdoid phenotype share the same nuclear appearance (30–32). The presence of prominent nucleoli is another specific morphological feature of those cells. This nucleolar appearance has been linked to high rDNA transcriptional activity because of an increased MYC/MYCN production and its accumulation into nucleoli in the cell (33).
Tumors with a rhabdoid phenotype have characteristic eosinophilic cytoplasmic inclusions made of vimentin, regardless of their developmental origin (34). These tumors often carry a loss-of-function mutation in the SNF5/INI1 gene (35), which encodes a subunit of the SWI/SNF chromatin-remodeling complex. These facts suggest that the rhabdoid phenotype is a manifestation of an epigenetic disorder that has led to reverse differentiation of the original cells into some lineage-uncommitted primitive cells. This process is, in fact, very similar to the somatic cell reprogramming induced by ectopic expression of stemness factors (10, 36). Taken together, these observations and our study suggest that tumor cells with the histological appearance of large and vesicular nuclei, representing their open chromatin structure, are indicative of stem cell–like tumor cells and that epigenetic changes may have contributed to the development of these most malignant cancer cells.
Materials and Methods
Routine NB monolayer cell cultures were performed as described in ref. 25. MTS assay was done as described in ref. 25. SI Materials and Methods includes detailed descriptions of NB sphere cultures, Western blot assay, gene expression profiling and pathway analyses, reverse-transcription and TaqMan real-time PCR, and additional information on MTS assay. Descriptions of cell-block preparation, mouse xenograft studies, human undifferentiated LCN specimens, and histological and immunohistochemical analyses are also found in SI Materials and Methods.
Supplementary Material
Acknowledgments
We thank Mariko Limpar and Ruth Hsiao for their critical reading of the manuscript. This work was supported in part by National Institutes of Health Grant CA97255 (to X.X.T.), National Institutes of Health Grant CA127571 (to N.I.), and a grant from the St. Baldrick Foundation (to N.I.).
Footnotes
The authors declare no conflict of interest.
*This Direct Submission article had a prearranged editor.
Data deposition: The data reported in this paper have been deposited in the Gene Expression Omnibus (GEO) database, www.ncbi.nlm.nih.gov/geo (accession no. GSE44537).
This article contains supporting information online at www.pnas.org/lookup/suppl/doi:10.1073/pnas.1118262110/-/DCSupplemental.
References
- 1.Cohn SL, et al. INRG Task Force The International Neuroblastoma Risk Group (INRG) classification system: An INRG Task Force report. J Clin Oncol. 2009;27(2):289–297. doi: 10.1200/JCO.2008.16.6785. [DOI] [PMC free article] [PubMed] [Google Scholar]
- 2.Matthay KK, et al. Children’s Cancer Group Treatment of high-risk neuroblastoma with intensive chemotherapy, radiotherapy, autologous bone marrow transplantation, and 13-cis-retinoic acid. N Engl J Med. 1999;341(16):1165–1173. doi: 10.1056/NEJM199910143411601. [DOI] [PubMed] [Google Scholar]
- 3.Katzenstein HM, et al. Scintigraphic response by 123I-metaiodobenzylguanidine scan correlates with event-free survival in high-risk neuroblastoma. J Clin Oncol. 2004;22(19):3909–3915. doi: 10.1200/JCO.2004.07.144. [DOI] [PubMed] [Google Scholar]
- 4.Naranjo A, et al. Comparison of ¹²³I-metaiodobenzylguanidine (MIBG) and ¹³¹I-MIBG semi-quantitative scores in predicting survival in patients with stage 4 neuroblastoma: A report from the Children’s Oncology Group. Pediatr Blood Cancer. 2011;56(7):1041–1045. doi: 10.1002/pbc.22991. [DOI] [PMC free article] [PubMed] [Google Scholar]
- 5.Shimada H, et al. Terminology and morphologic criteria of neuroblastic tumors: Recommendations by the International Neuroblastoma Pathology Committee. Cancer. 1999;86(2):349–363. [PubMed] [Google Scholar]
- 6.Shimada H, et al. The International Neuroblastoma Pathology Classification (the Shimada system) Cancer. 1999;86(2):364–372. [PubMed] [Google Scholar]
- 7.Tornóczky T, et al. Large cell neuroblastoma: A distinct phenotype of neuroblastoma with aggressive clinical behavior. Cancer. 2004;100(2):390–397. doi: 10.1002/cncr.20005. [DOI] [PubMed] [Google Scholar]
- 8.Tornóczky T, Semjén D, Shimada H, Ambros IM. Pathology of peripheral neuroblastic tumors: Significance of prominent nucleoli in undifferentiated/poorly differentiated neuroblastoma. Pathol Oncol Res. 2007;13(4):269–275. doi: 10.1007/BF02940304. [DOI] [PubMed] [Google Scholar]
- 9.Wang LL, et al. Neuroblastoma, Undifferentiated subtype: A report from the Children’s Oncology Group. Pediatr Dev Pathol. 2011 in press. [Google Scholar]
- 10.Takahashi K, Yamanaka S. Induction of pluripotent stem cells from mouse embryonic and adult fibroblast cultures by defined factors. Cell. 2006;126(4):663–676. doi: 10.1016/j.cell.2006.07.024. [DOI] [PubMed] [Google Scholar]
- 11.Yu J, et al. Induced pluripotent stem cell lines derived from human somatic cells. Science. 2007;318(5858):1917–1920. doi: 10.1126/science.1151526. [DOI] [PubMed] [Google Scholar]
- 12.Brambrink T, et al. Sequential expression of pluripotency markers during direct reprogramming of mouse somatic cells. Cell Stem Cell. 2008;2(2):151–159. doi: 10.1016/j.stem.2008.01.004. [DOI] [PMC free article] [PubMed] [Google Scholar]
- 13.Tang XX, et al. Favorable neuroblastoma genes and molecular therapeutics of neuroblastoma. Clin Cancer Res. 2004;10(17):5837–5844. doi: 10.1158/1078-0432.CCR-04-0395. [DOI] [PubMed] [Google Scholar]
- 14.Kim J, Lo L, Dormand E, Anderson DJ. SOX10 maintains multipotency and inhibits neuronal differentiation of neural crest stem cells. Neuron. 2003;38(1):17–31. doi: 10.1016/s0896-6273(03)00163-6. [DOI] [PubMed] [Google Scholar]
- 15.Morrison SJ, White PM, Zock C, Anderson DJ. Prospective identification, isolation by flow cytometry, and in vivo self-renewal of multipotent mammalian neural crest stem cells. Cell. 1999;96(5):737–749. doi: 10.1016/s0092-8674(00)80583-8. [DOI] [PubMed] [Google Scholar]
- 16.Nieto MA, Sargent MG, Wilkinson DG, Cooke J. Control of cell behavior during vertebrate development by Slug, a zinc finger gene. Science. 1994;264(5160):835–839. doi: 10.1126/science.7513443. [DOI] [PubMed] [Google Scholar]
- 17.Sakakibara S, et al. Mouse-Musashi-1, a neural RNA-binding protein highly enriched in the mammalian CNS stem cell. Dev Biol. 1996;176(2):230–242. doi: 10.1006/dbio.1996.0130. [DOI] [PubMed] [Google Scholar]
- 18.Scott CE, et al. SOX9 induces and maintains neural stem cells. Nat Neurosci. 2010;13(10):1181–1189. doi: 10.1038/nn.2646. [DOI] [PubMed] [Google Scholar]
- 19.Gaspar-Maia A, Alajem A, Meshorer E, Ramalho-Santos M. Open chromatin in pluripotency and reprogramming. Nat Rev Mol Cell Biol. 2011;12(1):36–47. doi: 10.1038/nrm3036. [DOI] [PMC free article] [PubMed] [Google Scholar]
- 20.Chen Y, et al. Aldehyde dehydrogenase 1B1 (ALDH1B1) is a potential biomarker for human colon cancer. Biochem Biophys Res Commun. 2011;405(2):173–179. doi: 10.1016/j.bbrc.2011.01.002. [DOI] [PMC free article] [PubMed] [Google Scholar]
- 21.Gupta PB, et al. Identification of selective inhibitors of cancer stem cells by high-throughput screening. Cell. 2009;138(4):645–659. doi: 10.1016/j.cell.2009.06.034. [DOI] [PMC free article] [PubMed] [Google Scholar]
- 22.Ernst A, et al. Genomic and expression profiling of glioblastoma stem cell-like spheroid cultures identifies novel tumor-relevant genes associated with survival. Clin Cancer Res. 2009;15(21):6541–6550. doi: 10.1158/1078-0432.CCR-09-0695. [DOI] [PubMed] [Google Scholar]
- 23.Sauvageot CM, et al. Efficacy of the HSP90 inhibitor 17-AAG in human glioma cell lines and tumorigenic glioma stem cells. Neuro-oncol. 2009;11(2):109–121. doi: 10.1215/15228517-2008-060. [DOI] [PMC free article] [PubMed] [Google Scholar]
- 24.Tatokoro M, et al. Potential role of Hsp90 inhibitors in overcoming cisplatin resistance of bladder cancer-initiating cells. Int J Cancer. 2012;131(4):987–996. doi: 10.1002/ijc.26475. [DOI] [PMC free article] [PubMed] [Google Scholar]
- 25.Regan PL, et al. Hsp90 inhibition increases p53 expression and destabilizes MYCN and MYC in neuroblastoma. Int J Oncol. 2011;38(1):105–112. [PMC free article] [PubMed] [Google Scholar]
- 26.Johnsen JI, et al. Inhibitors of mammalian target of rapamycin downregulate MYCN protein expression and inhibit neuroblastoma growth in vitro and in vivo. Oncogene. 2008;27(20):2910–2922. doi: 10.1038/sj.onc.1210938. [DOI] [PubMed] [Google Scholar]
- 27.Gaspar-Maia A, et al. Chd1 regulates open chromatin and pluripotency of embryonic stem cells. Nature. 2009;460(7257):863–868. doi: 10.1038/nature08212. [DOI] [PMC free article] [PubMed] [Google Scholar]
- 28.Golob JL, Paige SL, Muskheli V, Pabon L, Murry CE. Chromatin remodeling during mouse and human embryonic stem cell differentiation. Dev Dyn. 2008;237(5):1389–1398. doi: 10.1002/dvdy.21545. [DOI] [PMC free article] [PubMed] [Google Scholar]
- 29.Giangaspero F, et al. Large-cell medulloblastomas. A distinct variant with highly aggressive behavior. Am J Surg Pathol. 1992;16(7):687–693. [PubMed] [Google Scholar]
- 30.Bittesini L, Dei Tos AP, Fletcher CD. Metastatic malignant melanoma showing a rhabdoid phenotype: Further evidence of a non-specific histological pattern. Histopathology. 1992;20(2):167–170. doi: 10.1111/j.1365-2559.1992.tb00947.x. [DOI] [PubMed] [Google Scholar]
- 31.Biggs PJ, Garen PD, Powers JM, Garvin AJ. Malignant rhabdoid tumor of the central nervous system. Hum Pathol. 1987;18(4):332–337. doi: 10.1016/s0046-8177(87)80161-2. [DOI] [PubMed] [Google Scholar]
- 32.Drut R. Malignant rhabdoid tumor of the kidney diagnosed by fine-needle aspiration cytology. Diagn Cytopathol. 1990;6(2):124–126. doi: 10.1002/dc.2840060211. [DOI] [PubMed] [Google Scholar]
- 33.Shiue CN, Arabi A, Wright AP. Nucleolar organization, growth control and cancer. Epigenetics. 2010;5(3):5. doi: 10.4161/epi.5.3.11376. [DOI] [PubMed] [Google Scholar]
- 34.Vogel AM, Gown AM, Caughlan J, Haas JE, Beckwith JB. Rhabdoid tumors of the kidney contain mesenchymal specific and epithelial specific intermediate filament proteins. Lab Invest. 1984;50(2):232–238. [PubMed] [Google Scholar]
- 35.Versteege I, et al. Truncating mutations of hSNF5/INI1 in aggressive paediatric cancer. Nature. 1998;394(6689):203–206. doi: 10.1038/28212. [DOI] [PubMed] [Google Scholar]
- 36.Takahashi K, et al. Induction of pluripotent stem cells from adult human fibroblasts by defined factors. Cell. 2007;131(5):861–872. doi: 10.1016/j.cell.2007.11.019. [DOI] [PubMed] [Google Scholar]
Associated Data
This section collects any data citations, data availability statements, or supplementary materials included in this article.


