

Abstract
Objective
To use coronary revascularization choice to illustrate the application of a method simulating a treatment's effect on subsequent resource use.
Data Sources
Medicare inpatient and outpatient claims from 2002 to 2008 for patients receiving multivessel revascularization for symptomatic coronary disease in 2003–2004.
Study Design
This retrospective cohort study of 102,877 beneficiaries assessed survival, days in institutional settings, and Medicare payments for up to 6 years following receipt of percutaneous coronary intervention (PCI) or coronary artery bypass grafting (CABG).
Methods
A three-part estimator designed to provide robust estimates of a treatment's effect in the setting of mortality and censored follow-up was used. The estimator decomposes the treatment effect into effects attributable to survival differences versus treatment-related intensity of resource use.
Principal Findings
After adjustment, on average CABG recipients survived 23 days longer, spent an 11 additional days in institutional settings, and had cumulative Medicare payments that were $12,834 higher than PCI recipients. The majority of the differences in institutional days and payments were due to intensity rather than survival effects.
Conclusions
In this example, the survival benefit from CABG was modest and the resource implications were substantial, although further adjustments for treatment selection are needed.
Keywords: Censoring, comparative effectiveness research, coronary artery bypass grafting, percutaneous coronary intervention
Measurement of the long-term impact of medical treatments on resource utilization is essential to health technology assessment. Whether such measurement is performed using a randomized trial or observational study, most cohorts include some patients who were alive at the end of their data availability but whose resource use was not measured for the entire period of interest; these patients are said to be censored at the point from which subsequent resource use is unknown. Even when censoring occurs at random, conventional survival analysis methods produce biased cost estimates due to heterogeneity in cost trajectories (Lin et al. 1997).
Previous methods to address the issue of estimating resource use with censored data have notable limitations. Early approaches using survival-adjusted models were shown to produce biased estimates when death and censoring occurred continuously during the study period, rather than at predictable, discrete intervals such as every 30 days (Lin et al. 1997). Inverse probability weighting (IPW) approaches solve this limitation (Bang and Tsiatis 2000; Lin 2000), but they do not allow decomposition of a treatment's effect on resource use into an effect due to the treatment altering how long a patient lives (the survival effect) and an effect due to the treatment altering how many resources a surviving patient consumes (the intensity effect) (Basu and Manning 2010). Such decomposition, which is possible with survival-adjusted methodologies, is of interest in health technology assessment because it allows for more detailed examination of how treatments affect long-term costs of care.
An extreme example of a treatment affecting both survival and resource use is highly active antiretroviral therapy (HAART) for human immunodeficiency virus infection. HAART dramatically improves survival, meaning a substantial survival effect due to prolonged life spans among patients receiving HAART is likely. In addition, there is also an important intensity effect associated with HAART usage, consisting of increased costs for antiretroviral medications, but lower costs due to prevention of opportunistic infections. However, most cost analyses of HAART have not considered potential survival effects (Schackman et al. 2006). Although most cost-effectiveness analyses do not consider survival effect-induced costs (Gold et al. 1996), failing to incorporate these effects may bias them in favor of therapies that extend life span versus therapies that improve quality of life (Meltzer 1997). Furthermore, if an analytic objective is to forecast long-term expenditures for a third-party payer, incorporation of survival effect-induced costs is essential.
A recently developed approach extends the survival-adjusted methodology to produce consistent estimates for resource use, even when censoring and death occur continuously throughout the follow-up period. The approach also preserves the ability to decompose differences in resource use into survival and intensity effects (Basu and Manning 2010). In addition to these advantages, the authors identify an additional important and poorly appreciated limitation of IPW methods: the potential for considerable bias when IPW estimators are used to evaluate the costs of treatments that have both intensity and survival effects, as well as substantial precision loss. The authors show that this bias is eliminated with the use of their approach. We apply Basu and Manning's new methodology to compare the effects of percutaneous coronary intervention (PCI) versus coronary artery bypass grafting (CABG) on survival and resource use for elderly patients with symptomatic multivessel coronary artery disease.
Clinical Context
PCI and CABG are both treatments for coronary artery disease (CAD; blockages in the arteries that oxygenate the heart). PCI is performed by interventional cardiologists and involves reopening blocked arteries through the use of instruments threaded into the heart via catheters inserted in the patient's arm or leg. CABG is performed by cardiothoracic surgeons and involves sewing vessels from elsewhere in the patient's body onto the heart, allowing blood to bypass the blocked coronary arteries. PCI is less invasive than CABG and is increasingly the CAD procedure elderly patients receive (Sheridan et al. 2008). A systematic review of PCI versus CABG on survival from randomized trials published between 1996 and 2006 found similar overall survival after 1 and 5 years postrevascularization (Bravata et al. 2007). However, elderly patients were routinely excluded from many studies listed in the review, and results from recent randomized trials and observational studies suggest that among elderly patients with complex multivessel coronary disease, CABG provides a survival benefit over PCI (Sheridan et al. 2010; Kappetein et al. 2011; Weintraub et al. 2012). For this reason, a comparison of resource use between PCI and CABG must consider the possibility of differential survival between the two procedures.
We use an innovative approach to determine how PCI differentially affects institutional days and resource use compared to CABG through decomposed survival and intensity effects. Specifically, we assess the effects of PCI versus CABG on survival, institutional (hospital or long-term care) days, and Medicare payments for up to 6 years of follow-up for a national sample of elderly Medicare beneficiaries treated with multivessel coronary revascularization.
Methods
Data and Cohort Identification
Medicare Provider Analysis and Review (MedPAR) records were used to identify fee-for-service Medicare beneficiaries aged 66 and older admitted between January 1, 2003 and October 14, 2004 for symptomatic CAD, defined by the presence of International Classification of Diseases, Ninth Edition, Clinical Modification (ICD-9) diagnosis codes 410.xx, 411.1, and 413.9. Each patient's first such hospitalization during 2003 or 2004 was considered his “index admission.” For identified patients, we obtained all MedPAR, Carrier (Physician), and Outpatient Medicare claims as well as the Medicare Denominator file for calendar years 2002 through 2008, providing up to 6 years of follow-up information as well as 12 months of claims prior to the index admission. Patients were excluded if they were admitted for symptomatic CAD, cardiac surgery, or PCI in the 12 months prior to the index admission. Patients were also excluded from the analytic sample if they opted out of Medicare Part A or B or enrolled in a Medicare Advantage plan at any time between 2002 and 2008.
MedPAR and Carrier records were used to determine whether remaining patients received coronary revascularization during the 30 days following their index admission date based on claim codes (ICD-9 procedure codes, Healthcare Common Procedure Coding System codes, or Diagnosis-Related Group). Patients were included if their initial coronary revascularization procedure was a multivessel PCI or CABG procedure. We also included patients who received a staged PCI procedure by including those patients who received a second PCI procedure within 30 days of an initial single-vessel PCI. Additional detail of the cohort selection methodology has been published previously (Sheridan et al. 2010); a notable difference from the current analysis is that the previous work was limited to patients aged 85 and older.
Outcomes and Covariates
We estimated the association between treatment with PCI or CABG and subsequent survival and resource utilization, measured as days in institutional settings (hospitals and long-term care) and Medicare payments. Mortality data were obtained from the Denominator file. Hospital and skilled nursing facility (SNF) days paid by Medicare came from MedPAR records. Other long-term care days paid by other sources (e.g., private pay or Medicaid) were estimated by identifying physician visits to nursing homes (Iwashyna 2003; Zuckerman et al. 2007). Medicare payments were obtained from MedPAR, Outpatient, and Carrier claims.
Covariates included in adjusted models included clinical indicators, patient socioeconomic status, and hospital characteristics. Cardiac diagnoses identified during the patient's index and/or revascularization-related hospitalization(s) were included from the claims files. Gender and race were obtained from the Denominator file. Patient ZIP code-level median household income data were obtained from the 2000 United States Census; a measure of rural/urban status was obtained by linking patient ZIP code to Rural-Urban Commuting Areas (Hart, Larson, and Lishner 2005). The 2003 Medicare Provider of Service file was used to determine hospital characteristics, including ownership type and medical school affiliation. Clinical comorbidities were measured by applying the Healthcare Cost and Utilization Project's comorbidity criteria to all claims data for the 12 months prior to the index admission (Elixhauser et al. 1998). These criteria normally require that comorbidities be unrelated to a claim's principal diagnosis; we relaxed this assumption to allow for the inclusion of all comorbidities. To account for potential coding errors, comorbidities on Outpatient and Carrier claims were only included if the corresponding codes appeared on at least two claims greater than 30 days apart (Klabunde et al. 2000).
Analytic Method
The estimator proposed by Basu and Manning (2010) first requires construction of a dataset with observations at the person-period level. We selected a period length of 30 days. In addition to including an indicator of treatment choice (T), all other covariates (X), and the measure of resources consumed during each period (Y), several specific variables are needed to implement the estimators. First, we included a binary indicator (D) of whether the patient died within the period. Second, if the patient died within a given period, we include the length of time within the period the patient survived (U; e.g., between 1 and 30 days for a period length of 30 days). Third, we include a binary indicator (C) of whether the patient was censored at any point before the end of the period or died in a previous period. The dataset must be constructed to include a person-period record for all patients for all time periods (i.e., even after death or censoring).
Estimation of the model results in an incremental effect of the treatment variable of interest on resource use, decomposed into that due to survival and that due to intensity. Here, we describe the model in less technical language; for complete details of the model derivation, the reader should consult Basu and Manning (2010). This estimation involves four steps: (1) for each patient-period in which the patient was alive and not censored at the beginning of the period, calculate the predicted probability of survival to the start of the period and a hazard function for death during the period, as well as the associated incremental effects of the treatment variable; (2) for each patient-period in which the patient died, calculate the predicted resource use for the period and the associated incremental effect of the treatment variable; (3) for each patient-period in which the patient was alive and not censored at the beginning of the period, calculate the predicted resource use and the associated incremental effect of the treatment variable; and (4) combine these estimates for all patients and all periods to calculate the incremental effect of the treatment variable on overall resource use, decomposed into the survival effect and the intensity effect.
For each step, we provide general directions as well as details regarding our implementation:
Using the patient-period observations in which the patient was not censored at any point during the period and was alive at the beginning of the period (i.e., C = 0), estimate a survival model as a function of treatment choice and covariates. Relying on estimated coefficients from the survival model, calculate the predicted probability of survival until the start of the period (S(T,X)) and the hazard function for death during the period (h(T, X)) for each patient-period observation. In addition to estimating the predicted probabilities, estimate the incremental effect of the treatment variable on both S and h (ΔS/ΔT and Δh/ΔT, respectively). In our implementation, we calculated all incremental effects using recycled predictions (i.e., after building the model, using it to simulate, for all subjects, expected outcomes from both treatments).
Using the patient-period observations in which the patient was observed to die (i.e., D = 1), estimate a model predicting resource use as a function of T, X, and U. Incorporating U accounts for variability in costs due to the timing of death during the period in which the patient died. For example, if a patient dies on day 2 of a month, he has fewer days to incur costs than a patient who dies on day 19. For all patient-period observations, estimate the predicted resource use (μ1(T, X, U)) and the effect of the treatment variable on predicted resource use (Δμ1(T, X, U)/ΔT)). Of note, U is not available for periods in which the patient did not die; thus, both predicted resource use and the treatment effect were obtained by generating multiple predictions for each person-month observation (reflecting the range of values of U), then taking a weighted average based on the distribution of U among individuals who did die. To reduce computational complexity, we reduced the number of levels of in U by first dividing into five discrete levels (e.g., for 30-day intervals, each 6 days long).
Using the patient-period observations in which the patient was observed to live and was not censored (i.e., D = 0 and C = 0), estimate resource use as a function of T and X. For all patients in all periods (including periods in which the patient died or was censored), use the model estimates to predict resource use (μ2(T, X )) and the effect of the treatment variable on predicted resource use (Δμ2(T, X )/ΔT ).
Using the within-period effects calculated for each patient in the three stages outlined above for each period j = 1 through K (the end of the follow-up period), combine the results into a single incremental effect:
 |
The first term in large curly brackets represents the survival effect, while the second is the intensity effect.
To estimate survival, we applied discrete-time methods using a pooled logistic regression model. Such an approach involves a modest reduction in statistical power when compared with continuous time methods such as Cox proportional hazard models. However, its advantages are that it is both readily estimated using the same person-month analytic dataset needed for the reminder for the model and easily allows for incorporation of time-varying effects through interactions between treatment and time indicators. Hazard rates were approximated using monthly transition probabilities. To estimate resource use in periods in which individuals died, we used a Poisson model for the institutional days outcomes and applied a generalized linear model with a log link and gamma distribution for the Medicare payments outcome. Poisson was chosen rather than negative binomial because the point estimate of regression parameters estimated by Poisson are consistent even with over- or underdispersion of the response variable (Wooldridge 2010). For observations in which patients were observed to live throughout the period, we applied two-part models with logistic regression for the first part; the second part used zero-truncated Poisson and generalized linear regression with log link and gamma distribution models for the institutional days and Medicare payment outcomes, respectively. An exception was made for the first 30-day period (which included the revascularization procedure); since all patients had inpatient days and expenditures related to revascularization, one-part models were used in the first period. The Stata code used to implement the model is provided in an Online Appendix.
To allow for a time-varying effect of PCI/CABG on survival and service use, we specified the effect of treatment using interaction terms between revascularization choice and a linear spline. The linear spline had knots at 2, 3, 4, 5, 6, 12, 24, 36, 48, and 60 months. Confidence intervals were obtained through bias-corrected bootstrapping techniques using 250 repetitions, with bootstrap sampling performed clustered at the person level. Inferential statistics were considered significant at a two-sided alpha level of 0.05. Datasets were constructed in SAS System, Version 9.2 (SAS Institute, Cary, NC, USA), and all statistical calculations were conducted in Stata/IC 12.1 (StataCorp LP, College Station, TX, USA).
Results
Cohort
The analysis cohort included 102,877 Medicare beneficiaries with symptomatic CAD who were treated with PCI or CABG as the initial choice of revascularization therapy for multivessel disease. Of these, 64,727 beneficiaries (62.9 percent) received CABG. When compared with patients receiving PCI (Table 1), CABG patients were younger and less likely to be female. CABG patients were less likely to be receiving state Medicaid buy-in benefits but lived in ZIP codes with lower median household income. ST-elevation myocardial infarction (STEMI) was less common and non-STEMI more common among CABG patients. CABG patients were more likely to have a history of prior stroke and/or have diabetes but less likely to have cancer, congestive heart failure, or valvular disease. Ownership type of the revascularization facility did not significantly differ between PCI and CABG, but CABG was less likely to be performed in a facility with a major medical school affiliation.
Table 1.
Selected Covariates by Initial Revascularization Procedure
| PCI | CABG | p-value | |
|---|---|---|---|
| Number of patients | 38,150 | 64,727 | |
| Patient demographics | |||
| Age (years) | 76.0 | 74.7 | <.001 |
| Female | 47.0 | 36.8 | <.001 |
| Nonwhite race | 7.2 | 7.2 | .95 |
| ZIP-code median household income (1,000s of USD) | 43.2 | 42.4 | <.001 |
| State medicaid buy-in | 10.5 | 9.3 | <.001 |
| Patient clinical status | |||
| ACS diagnosis | |||
| ST-elevation myocardial infarction | 23.9 | 18.3 | <.001 |
| Non-ST-elevation myocardial infarction | 26.1 | 28.1 | |
| Angina | 50.0 | 53.6 | |
| History of prior stroke | 7.2 | 7.6 | .02 |
| Cancer | 8.9 | 7.9 | <.001 |
| Congestive heart failure | 9.0 | 5.7 | <.001 |
| Diabetes mellitus | 31.5 | 35.0 | <.001 |
| Valvular disease | 5.2 | 2.9 | <.001 |
| Revascularization facility characteristics | |||
| Ownership type | |||
| Nonprofit | 79.1 | 79.1 | .38 |
| For-profit | 11.4 | 11.6 | |
| Government | 9.5 | 9.3 | |
| Major medical school affiliation | 32.4 | 30.5 | <.001 |
Impact of Treatment Choice on Survival
Prior to adjustment for patient and provider characteristics, CABG patients were observed to have greater short-term mortality within the year following revascularization when compared with PCI recipients, but they had a growing survival benefit after the first year (Figure 1A). We integrated the survival curves with respect to time to calculate life days and took the difference between CABG and PCI to calculate the incremental difference. Prior to adjustment, patients who received CABG lived, on average, 59.1 days longer than patients receiving PCI at 72 months postrevascularization (Table 2A). Statistical adjustment for covariates reduced this difference to 23.1 days and prolonged the time point at which CABG patients began experiencing longer average survival than PCI; on average, CABG recipients lived fewer life days than PCI recipients until 42 months following revascularization, after which the survival benefit associated with CABG over PCI grew rapidly (Figure 2A).
Figure 1.
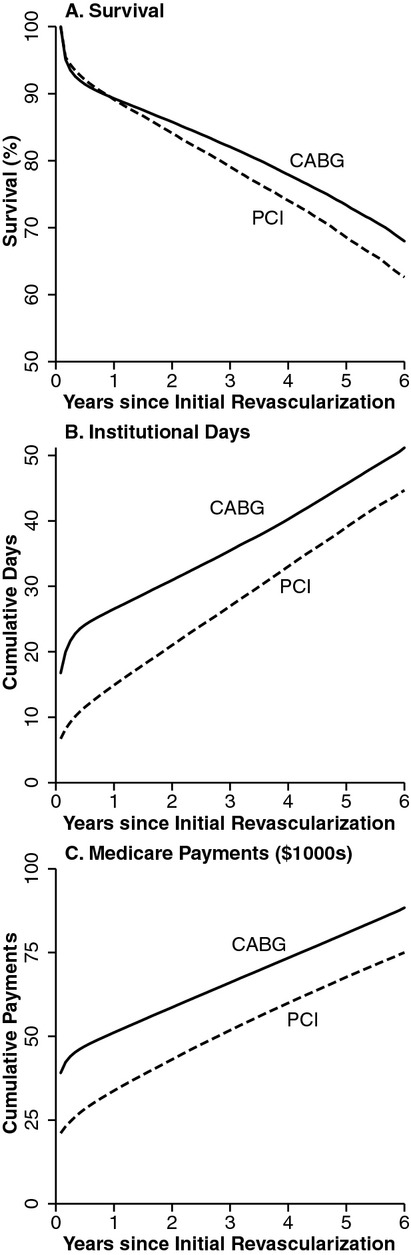
Unadjusted Survival, Days Spent in an Institutional Setting, and Medicare Payments after Revascularization with Percutaneous Coronary Intervention (PCI) or Coronary Artery Bypass Grafting (CABG)
Table 2.
Incremental (CABG – PCI) Differences in Survival and Service Use at Six Years after Coronary Revascularization [95% CI Provided for Selected Estimates]
| (A) Survival (Life days) | Unadjusted | 59.1 days | ||||
|---|---|---|---|---|---|---|
| Adjusted | 23.1 days [14.2, 32.2] | |||||
| Total Difference | Difference due to Intensity Effect | Difference due to Survival Effect | ||||
| (B) Service Use | Unadjusted | Adjusted | Unadjusted | Adjusted | Unadjusted | Adjusted |
| Total institutional days | 8.0 | 10.9 [10.1, 11.8] | 7.2 | 10.5 [9.6, 11.3] | 0.8 | 0.4 [0.2, 0.6] |
| Acute care days | 6.9 | 7.2 | 6.6 | 7.1 | 0.3 | 0.1 |
| SNF/long-term care days | 1.1 | 4.2 | 0.6 | 3.8 | 0.5 | 0.3 |
| Medicare payments | $13,301 | $12,834[$12,032, $13,609] | $12,066 | $12,225 [$11,368, $12,942] | $1,236 | $609 [$366, $856] |
| Adjusted Total Difference | |||
|---|---|---|---|
| (C) Subgroup Analysis | Survival (Days) | Institutional Days | Medicare Payments |
| Gender | |||
| Male | 44.8 | 9.8 | $12,562 |
| Female | −8.1 | 12.1 | $12,984 |
| Age | |||
| 66–74 | 36.4 | 8.4 | $10,618 |
| 75+ | 17.1 | 13.0 | $14,889 |
| Diabetes mellitus | |||
| Yes | 46.5 | 11.9 | $12,184 |
| No | 12.9 | 10.3 | $13,104 |
| Peripheral vascular disease | |||
| Yes | 38.6 | 9.2 | $13,122 |
| No | 20.8 | 11.2 | $12,824 |
| Congestive heart failure | |||
| Yes | 62.4 | 16.0 | $18,964 |
| No | 21.5 | 10.6 | $12,516 |
| (D) Alternative Models | |||
| Propensity Score Matched Cohort (N = 73,846) | 25.6 | 10.9 | $13,099 |
| Monthly indicator variables (main results: linear spline for time) | 23.0 | 9.1 | $12,844 |
Figure 2.
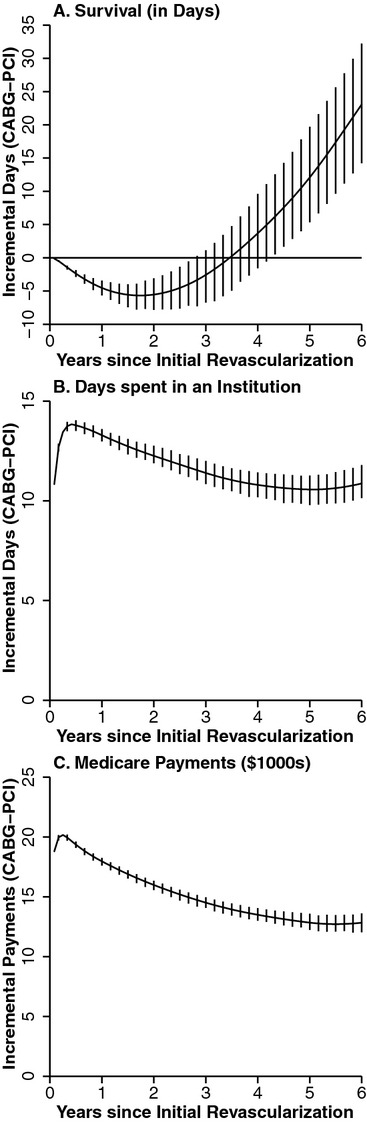
Adjusted Estimates of Incremental Survival and Resource Use after Revascularization with Percutaneous Coronary Intervention (PCI) versus Coronary Artery Bypass Grafting (CABG). (Incremental differences are cumulative from time of the initial revascularization procedure. Vertical bars indicate 95 percent pointwise confidence intervals, displayed at 2-month intervals for clarity)
Impact of Treatment Choice on Resource Use
Prior to adjustment, CABG recipients spent more days in institutional settings than PCI recipients and had higher Medicare payments (Figure 1B and C). After adjustment, at 72 months postrevascularization, CABG recipients on average had spent 10.9 more days in institutional settings than PCI recipients (95 percent CI: [10.1,11.8]) and had total Medicare payments that were $12,834 higher (95 percent CI: [$12,032, $13,609]; Table 2B and C). The greater use of institutional days and total Medicare payments associated with receipt of CABG appeared most strongly associated with the peri-procedural period, as the effects diminished in magnitude over the follow-up period (Figure 2B and C). The differences in resource utilization observed between CABG and PCI were overwhelmingly driven by intensity effects rather than survival effects (Figure 3A and B); 95.3 percent of the difference in Medicare payments was due to intensity effects (Table 2B). CABG recipients had higher institutional days in both acute care and long-term care settings (7.2 and 4.2 days, respectively).
Figure 3.
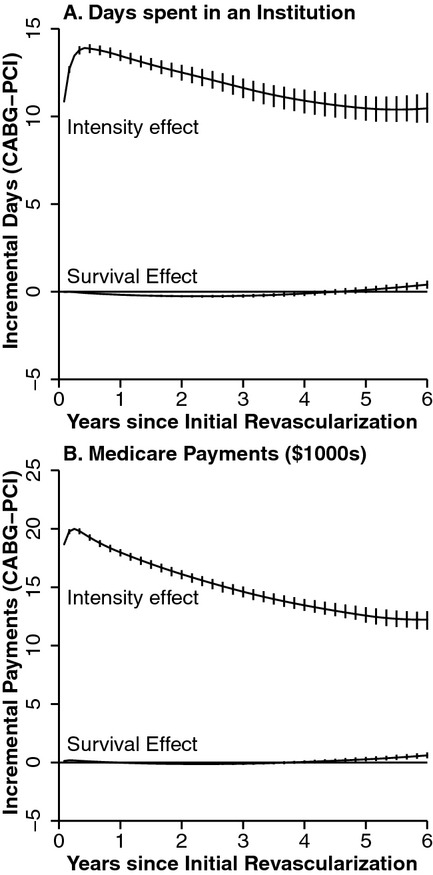
Decomposition of Adjusted Estimates of Incremental Difference between Coronary Artery Bypass Grafting and Percutaneous Coronary Intervention into Portion Attributable to Differences in the Intensity of Service Use among Survivors (Intensity Effect) and Portion Attributable to Changes in Duration of Survival (Survival Effect). (Incremental differences are cumulative from time of initial revascularization procedure. Vertical bars indicate 95 percent pointwise confidence intervals, displayed at 2-month intervals for clarity)
Subgroup Analyses
We performed several adjusted subgroup analyses predicated upon clinically meaningful subpopulations of the elderly (Table 2C). Relative to PCI, CABG use was associated with a greater improvement in survival for men than women (incremental difference: 44.8 days vs −8.1), along with fewer incremental institutional days and lower Medicare payments (9.8 days vs. 12.1 and $12,562 vs. $12,984, respectively). Similarly, CABG was associated with greater incremental life days among patients with diabetes, peripheral vascular disease, and/or congestive heart failure (CHF); however, only CHF appeared to demonstrate a meaningful difference in resource costs by CHF status, with CHF patients having greater incremental institutional days and Medicare payments after CABG versus PCI compared to those without CHF.
Alternative Models
We performed two alternative analyses to assess the robustness of our findings to model specification. In the first, we performed propensity score matching on the sample, and we then used the 73,846 patients for which a match was made in the model. In the second, we specified the effect of CABG treatment on survival and resource use using a series of binary indicators for period (e.g., an indicator for month 1, month 2, etc.) rather than the previously described linear spline. Neither alternative specification altered the findings substantively (Table 2D). Furthermore, although IPW methods may introduce bias if survival effects are substantial, we also calculated IPW estimates and found them similar to the estimates presented due to the limited survival effects (results not shown; available on request).
Discussion
In this study, we outline the implementation and demonstrate the use of an econometric method developed by Basu and Manning to estimate the long-term effects of medical treatments on resource use. Compared with the widely employed methodology of IPW, the Basu/Manning methodology provides two principal benefits. First, it allows the analyst to decompose resource use differences into survival and intensity effects, which provides more detail about the long-term cost trajectories associated with treatment choices. Second, it may avoid biased estimates for those treatments that affect both intensity and survival; bias that may be substantial when analyses are performed using IPW methods in the setting of highly censored data. However, the Basu/Manning method is significantly more complex to implement than IPW and more computationally intensive in large datasets due to the need for bootstrapping. The bootstrapped Basu/Manning result presented here took several weeks to compute on a multiprocessor machine, while the IPW estimates were completed in minutes; this drawback will be ameliorated over time by improvements in software and processing power. Despite these disadvantages, we believe that the potential for bias from IPW means that evaluation for potential differences in survival must precede any decision to use IPW to measure cost differences, even if the ability to decompose cost differences into intensity and survival effects is not of interest. If survival differences are demonstrated, then use of the Basu/Manning approach is the most conservative approach.
In our application, cumulative survival differences between CABG and PCI over a 6-year follow-up period were modest (23.1 days), although the trajectory of the prediction suggests that a longer follow-up period would enlarge this difference. Moreover, net survival benefit of CABG did not begin to occur until 42 months following revascularization. This survival difference occurred at the cost of 10.9 additional days spent in an institution (i.e., hospital or nursing home) as well as $12,834 in additional Medicare payments. Because the survival differences were modest, intensity rather than survival effects accounted for most (95 percent) of the estimated differences in institutional days and Medicare payments. Application of these methods to other medical conditions where treatments result in a larger difference in survival would show a larger portion of the estimated differences being attributable to longer survival and result in greater bias from the use of the IPW method. Furthermore, the available data were limited to only patients continuously enrolled in Fee-for-Service Medicare between 2003 and 2008, meaning that the only source of censoring was the difference in follow-up length caused by patients entering the sample throughout 2003–2004. Applications with higher rates of censoring would be expected to derive greater benefit from the Basu/Manning method.
Several limitations render our results illustrative rather than definitive. In particular, there are concerns about incomplete adjustment for treatment selection and the fact that PCI and CABG likely exhibit heterogeneous treatment effects. Whether a patient receives PCI or CABG is a complex clinical decision based on a number of factors such as the extent of coronary lesions, clinical status, and patient preferences that are not captured in administrative data but may be associated with differences in outcome. Treatment effect heterogeneity is a distinct but related issue. Even within the population of elderly patients with symptomatic angina, for some patients PCI is unquestionably considered the best procedure (e.g., those patients who present with STEMI and receive primary PCI to abort the myocardial infarction), whereas for others CABG is the obvious choice (e.g., patients with left main coronary artery disease). The subgroup analyses performed here further illustrate a possible strong heterogeneity effect for this clinical question. However, the data are not sufficiently granular to permit identification of the patient subpopulations with high clinical uncertainty about whether to provide PCI or CABG. In addition, the use of Medicare payments as an outcome excludes patient and private third party payer costs that would be relevant in comparing the economic implications of PCI versus CABG. Our analysis was also limited by an inability to measure outpatient prescription expenditures, as Part D data were not available before 2006. For these reasons, the differences identified in this study cannot provide clinical guidance.
While many of the limitations outlined above center on the use of Medicare claims data, such data do have several important strengths. Because Medicare coverage is nearly universal and generally retained for life among Americans aged 65 and older, it provides a more generalizable cohort and more complete longitudinal follow-up data than can typically be obtained from cohorts enrolled in private insurance plans. These key benefits justify the continued use of Medicare claims for analyses of those diseases that commonly affect older adults. The ability to merge Medicare claims with clinical registries, such as the Society of Thoracic Surgeons database for CABG and the CathPCI Registry for PCI, offers a potential mechanism through which the ability to control for patient selection may be improved while retaining a broadly generalizable cohort (Hammill et al. 2009; Brennan et al. 2012). Mortality results from such a linkage have recently been reported (Weintraub et al. 2012); future resource use analyses may leverage such merged datasets to provide additional control for patient selection and evaluate potentially heterogeneous treatment effects. Similar matched Medicare-registry data exist for other disease areas, such as the Surveillance, Epidemiology, and End Results Registry used in oncology research. Continued availability of claims for Medicare beneficiaries enrolling in innovative payment arrangements (e.g., accountable care organizations or bundled payments) will facilitate analysis in the above efforts. Finally, additional work is needed to facilitate robust estimation of resource use effects in settings where censoring is likely informative, such as is commonly seen in private health insurance in which insurance enrollment and health may be tightly correlated due to job status or in the case of enrollment in Medicare Advantage.
Although there are valid concerns about the proper role of cost analyses in governing medical decision making, treatment choices cannot be made in a vacuum (Garber and Sox 2010); information on incremental resource differences between procedures is critical for ensuring effective use of limited health care dollars. In general, this application and the ensuing results highlight the importance of considering resource use when evaluating the comparative effectiveness of two procedures and ultimately when making treatment choices. The Basu/Manning method provides an important new tool to support this effort.
Acknowledgments
Joint Acknowledgment/Disclosure Statement: Funding and research support were provided by the National Institute on Aging (R01-AG025801 and T32-AG000272), the National Heart, Lung, and Blood Institute (F30-HL110483), the National Institute of General Medical Sciences (T32-GM008719), and the Agency on Healthcare Research and Quality (T32-HS000032 and R36-HS021074). The funding agencies did not participate in the design and conduct of the study, collection, management, analysis, and interpretation of the data, or publication, review, or approval of the manuscript. John Cantrell and Robert Schwartz provided programming assistance.
Disclosures: This study was presented at the American Society of Health Economists 4th Biennial Conference in Minnesota in June 2012.
Disclaimers: None.
SUPPORTING INFORMATION
Additional supporting information may be found in the online version of this article:
Appendix SA1: Author Matrix.
Appendix SA2: Stata Ado File Implementing Model.
Appendix SA3: Stata Help File for Implementing Model.
References
- Bang H, Tsiatis AS. “Estimating Medical Costs with Censored Data”. Biometrika. 2000;87(2):329–43. [Google Scholar]
- Basu A, Manning WG. “Estimating Lifetime or Episode of Illness Costs under Censoring”. Health Economics. 2010;19(9):1010–28. doi: 10.1002/hec.1640. [DOI] [PubMed] [Google Scholar]
- Bravata DM, Gienger AL, McDonald KM, Sundaram V, Perez MV, Varghese R, Kapoor JR, Ardehali R, Owens DK, Hlatky MA. “Systematic Review: The Comparative Effectiveness of Percutaneous Coronary Interventions and Coronary Artery Bypass Graft Surgery”. Annals of Internal Medicine. 2007;147(10):703. doi: 10.7326/0003-4819-147-10-200711200-00185. [DOI] [PubMed] [Google Scholar]
- Brennan JM, Peterson ED, Messenger JC, Rumsfeld JS, Weintraub WS, Anstrom KJ, Eisenstein EL, Milford-Beland S, Grau-Sepulveda MV, Booth ME, Dokholyan RS, Douglas PS, Duke DT, Clinical Research Institute “Linking the National Cardiovascular Data Registry CathPCI Registry with Medicare Claims Data: Validation of a Longitudinal Cohort of Elderly Patients Undergoing Cardiac Catheterization”. Circulation: Cardiovascular Quality and Outcomes. 2012;5(1):134–40. doi: 10.1161/CIRCOUTCOMES.111.963280. [DOI] [PubMed] [Google Scholar]
- Elixhauser A, Steiner C, Harris DR, Coffey RM. “Comorbidity Measures for Use with Administrative Data”. Medical Care. 1998;36(1):8–27. doi: 10.1097/00005650-199801000-00004. [DOI] [PubMed] [Google Scholar]
- Garber AM, Sox HC. “The Role of Costs in Comparative Effectiveness Research”. Health Affairs. 2010;29(10):1805–11. doi: 10.1377/hlthaff.2010.0647. [DOI] [PubMed] [Google Scholar]
- Gold M, Siegal J, Russell L, Weinstein M. Cost-Effectiveness in Health and Medicine. New York: Oxford University Press; 1996. [Google Scholar]
- Hammill BG, Hernandez AF, Peterson ED, Fonarow GC, Schulman KA, Curtis LH. “Linking Inpatient Clinical Registry Data to Medicare Claims Data Using Indirect Identifiers”. American Heart Journal. 2009;157(6):995–1000. doi: 10.1016/j.ahj.2009.04.002. [DOI] [PMC free article] [PubMed] [Google Scholar]
- Hart LG, Larson EH, Lishner DM. “Rural Definitions for Health Policy and Research”. American Journal of Public Health. 2005;95(7):1149–55. doi: 10.2105/AJPH.2004.042432. [DOI] [PMC free article] [PubMed] [Google Scholar]
- Iwashyna T. “On the Detection of Nursing Home Use in Medicare Claims”. Health Services and Outcomes Research Methdology. 2003;4(3):187–96. [Google Scholar]
- Kappetein AP, Feldman TE, Mack MJ, Morice MC, Holmes DR, Stahle E, Dawkins KD, Mohr FW, Serruys PW, Colombo A. “Comparison of Coronary Bypass Surgery with Drug-Eluting Stenting for the Treatment of Left Main and/or Three-Vessel Disease: 3-Year Follow-up of the SYNTAX Trial”. European Heart Journal. 2011;32(17):2125–34. doi: 10.1093/eurheartj/ehr213. [DOI] [PubMed] [Google Scholar]
- Klabunde CN, Potosky AL, Legler JM, Warren JL. “Development of a Comorbidity Index Using Physician Claims Data”. Journal of Clinical Epidemiology. 2000;53(12):1258–67. doi: 10.1016/s0895-4356(00)00256-0. [DOI] [PubMed] [Google Scholar]
- Lin DY. “Linear Regression Analysis of Censored Medical Costs”. Biostatistics. 2000;1(1):35–47. doi: 10.1093/biostatistics/1.1.35. [DOI] [PubMed] [Google Scholar]
- Lin DY, Feuer EJ, Etzioni R, Wax Y. “Estimating Medical Costs from Incomplete Follow-Up Data”. Biometrics. 1997;53(2):419–34. [PubMed] [Google Scholar]
- Meltzer D. “Accounting for Future Costs in Medical Cost-effectiveness Analysis”. Journal of Health Economics. 1997;16(1):33–64. doi: 10.1016/s0167-6296(96)00507-3. [DOI] [PubMed] [Google Scholar]
- Schackman BR, Gebo KA, Walensky RP, Losina E, Muccio T, Sax PE, Weinstein MC, Seage GR, 3rd, Moore RD, Freedberg KA. “The Lifetime Cost of Current Human Immunodeficiency Virus Care in the United States”. Medical Care. 2006;44(11):990–7. doi: 10.1097/01.mlr.0000228021.89490.2a. [DOI] [PubMed] [Google Scholar]
- Sheridan BC, Stearns SC, Massing MW, Stouffer GA, D'Arcy LP, Carey TS. “Percutaneous Coronary Intervention or Coronary Artery Bypass Grafting: Intervention in Older Persons with Acute Coronary Syndrome-Part I”. Clinical Geriatrics. 2008;16(10):39–44. [PMC free article] [PubMed] [Google Scholar]
- Sheridan BC, Stearns SC, Rossi JS, D'Arcy LP, Federspiel JJ, Carey TS. “Three-year Outcomes of Multivessel Revascularization in Very Elderly Acute Coronary Syndrome Patients”. Annals of Thoracic Surgery. 2010;89(6):1889–94. doi: 10.1016/j.athoracsur.2010.03.003. discussion 94-5. [DOI] [PMC free article] [PubMed] [Google Scholar]
- Weintraub WS, Grau-Sepulveda MV, Weiss JM, O'Brien SM, Peterson ED, Kolm P, Zhang Z, Klein LW, Shaw RE, McKay C, Ritzenthaler LL, Popma JJ, Messenger JC, Shahian DM, Grover FL, Mayer JE, Shewan CM, Garratt KN, Moussa ID, Dangas GD, Edwards FH. “Comparative Effectiveness of Revascularization Strategies”. New England Journal Medicine. 2012;366(16):1467–76. doi: 10.1056/NEJMoa1110717. [DOI] [PMC free article] [PubMed] [Google Scholar]
- Wooldridge JM. Econometric Analysis of Cross Section and Panel Data. Cambridge, MA: MIT Press; 2010. [Google Scholar]
- Zuckerman IH, Sato M, Hsu VD, Hernandez JJ. “Validation of a Method for Identifying Nursing Home Admissions Using Administrative Claims”. BMC Health Services Research. 2007;7:202. doi: 10.1186/1472-6963-7-202. [DOI] [PMC free article] [PubMed] [Google Scholar]
Associated Data
This section collects any data citations, data availability statements, or supplementary materials included in this article.