

Abstract
The in silico reconstruction of metabolic networks has become an effective and useful systems biology approach to predict and explain many different cellular phenotypes. When simulation outputs do not match experimental data, the source of the inconsistency can often be traced to incomplete biological information that is consequently not captured in the model. To address this problem, general approaches continue to be needed that can suggest experimentally-testable hypotheses to reconcile inconsistencies between simulation and experimental data. Here we present such an approach that focuses specifically on correcting cases in which experimental data show a particular gene to be essential but model simulations do not. We use metabolic models to predict efficient compensatory pathways, after which cloning and overexpression of these pathways are performed to investigate whether they restore growth and to help determine why these compensatory pathways are not active in mutant cells. We demonstrate this technique for a ppc knockout of Salmonella enterica serovar Typhimurium; the inability of cells to route flux through the glyoxylate shunt when ppc is removed was correctly identified by our approach as the cause of the discrepancy. These results demonstrate the feasibility of our approach to drive biological discovery while simultaneously refining metabolic network reconstructions.
Keywords: systems biology, metabolic reconstruction, gap filling, mathematical modeling
INTRODUCTION
The in silico reconstruction of metabolic networks is a systems biology framework that serves as a collection of highly-curated genetic and biochemical information for a particular organism (Feist, et al., 2009, Schellenberger, et al., 2010, Kim, et al., 2012). The subsequent conversion of this parts list to a mathematical format allows one to simulate phenotypic states and consequently to investigate different relationships between genotype and phenotype using a computational model. The ability to simulate different phenotypes is a notable strength of this modeling framework and distinguishes this approach from static maps of biochemical pathways. Static maps represent all known pathways in a network, whereas the simulation of metabolic network reconstructions provides additional information concerning which pathways are likely to carry flux – and are therefore active – versus pathways that are present but not used. To date, the simulation of metabolic models has found applications in metabolic engineering (Perez Pulido, et al., 2005, Park, et al., 2011, Licona-Cassani, et al., 2012), network analysis (Almaas, et al., 2005, Lee, et al., 2005, Nam, et al., 2012), biological discovery (Chen & Vitkup, 2006, Reed, et al., 2006, Frezza, et al., 2011), and target identification for drug discovery research (Becker, et al., 2006, Brynildsen, et al., 2013). Metabolic models have also been used to investigate drug off-target effects by incorporating structural data for proteins (Chang, et al., 2010) and to provide context for the analysis of high-throughput -omics data (Chandrasekaran & Price, 2010, Chang, et al., 2010, Frezza, et al., 2011, van Berlo, et al., 2011).
Because these models are constructed from experimental data, attempts to reconcile inconsistencies between experimental data and model simulations often form the basis for hypothesis-driven biological discovery (Orth & Palsson, 2010). In turn, the new discoveries serve to refine the models. This continuous loop in which one performs simulations, carries out experiments to test simulation results, resolves inconsistencies, and then performs new simulations to start a new round of model reconciliation ultimately improves the predictive capabilities of the models and thereby increases their utility. In one example, the use of systems analysis coupled with high-throughput screening and follow-up genetic and biochemical work led to the functional assignment of eight ORFs in E. coli that had two new enzymatic activities and four unidentified transport properties (Reed, et al., 2006). Other studies in E. coli identified a new mechanism that enables growth on myo-inositol (Orth & Palsson, 2012) and the gene that encodes succinate semialdehyde dehydrogenase in this organism (Fuhrer, et al., 2007).
Several computational algorithms have been developed to close gaps in metabolic models and to reconcile inconsistencies between model simulations and experimental data (Orth & Palsson, 2010, Vitkin & Shlomi, 2012); however, there is a constant need for new gap filling strategies that complement existing ones so that the accuracy of metabolic network reconstructions can continue to be refined and improved. Here we present such a method based on an analysis of a metabolic model for a knockout mutant versus the wild-type. Our method focuses specifically on formulating hypotheses that can correct metabolic models when a gene is essential experimentally but it is non-essential in the model. We demonstrate our approach by investigating a case in which a metabolic reconstruction for Salmonella enterica serovar Typhimurium (hereafter referred to as S. Typhimurium) (Thiele, et al., 2011) predicted in silico that a Δppc mutant would be viable in glucose M9 minimal medium but the actual mutant, when constructed and tested in the laboratory, was not. The absence of key regulatory information from the model was found to be the cause of the discrepancy.
MATERIALS AND METHODS
Bacterial Strains
Bacterial strains used in this study are summarized in Table 1. Salmonella enterica serovar Typhimurium strain 14028s was a generous gift provided by Fred Heffron at Oregon Health & Science University.
TABLE 1.
| Strain or Plasmid | Characteristics | Source |
|---|---|---|
| Strains | ||
| Salmonella enterica serovar Typhimurium strain 14028s | Wild-type | See Materials and Methods |
| Δppc | ppc deletion mutant | This study |
| ΔppcΔiclR | ppc and iclR double deletion mutant | This study |
| ppc(pS7) | The Δppc mutant bearing plasmid pS7 | This study |
| ppc(pS8) | The Δppc mutant bearing plasmid pS8 | This study |
| ppc(pS10) | The Δppc mutant bearing plasmid pS10 | This study |
| ppc(pS8 + pS10) | The Δppc mutant bearing the plasmids pS8 and pS10 | This study |
| Plasmids | ||
| pKD13 | PCR template used to generate ppc knockout cassette based on kanamycin resistance | (Datsenko & Wanner, 2000) |
| pKD46 | Encodes arabinose-inducible λ-Red recombination system | (Datsenko & Wanner, 2000) |
| pCP20 | Encodes FLP recombinase | (Datsenko & Wanner, 2000) |
| pASK-IBA33+ | Expression plasmid containing a tetracycline inducible promoter; AmpR | IBA GmbH, Germany |
| pASK1988 | Derivative of pASK-IBA33+ containing CamR in place of AmpR | This study |
| pS7 | pASK-IBA33+ containing aceBAK | This study |
| pS8 | pASK-IBA33+ containing aceBA | This study |
| pS10 | pASK1988 containing aceK | This study |
Strains and plasmids used in this study. AmpR and CapR indicate genes that confer resistance to ampicillin and chloramphenicol, respectively.
Growth Media
Strains of Salmonella Typhimurium 14028s were cultured at 37°C with magnetic stir bars for aeration in either Luria-Bertani (LB) broth or M9 minimal medium. The M9 medium contained 2 g/L glucose, 100 μM CaCl2, 2 mM MgSO4, 6.8 g/L Na2HPO4, 3 g/L KH2PO4, 0.5 g/L NaCl, 1 g/L NH4Cl, and 250 μL trace elements. The trace element solution consisted of (per liter): FeCl3•6H2O (16.67 g), ZnSO4•7H2O (0.18 g), CuCl2•2H2O (0.12 g), MnSO4•H2O (0.12 g), CoCl2•6H2O (0.18 g) and Na2EDTA•2H2O (22.25 g). Antibiotics were added as necessary at the following concentrations: ampicillin at 100 μg/mL, kanamycin at 50 μg/mL, and chloramphenicol at 25 μg/mL. LB powder was purchased from EMD Chemicals (Gibbstown, NJ) and used at the manufacturer’s recommended concentration. All other chemicals were purchased from Sigma-Aldrich (St. Louis, MO).
Construction of the Δppc mutant
The Δppc knockout mutant in S. Typhimurium 14028s was created using the λ-Red recombination system (Datsenko & Wanner, 2000). A kanamycin resistance cassette containing flanking FRT sites was generated by PCR using pkD13 as the template. The ends of the cassette contained 50 nucleotides that are homologous to the 50 bp immediately upstream and downstream of ppc. The plasmids pKD46 and pCP20 were used to insert the kanamycin cassette into the genome via homologous recombination and to remove the kanamycin resistance marker, respectively. Correct insertion of the marker and subsequent removal from the chromosome were confirmed by PCR. All PCR products were purified with the QIAGEN PCR clean-up kit (Valencia, CA).
Growth rate and glucose uptake rate measurements
For growth rate measurements, strains were first cultured in LB media overnight, centrifuged at approximately 3000 × g, washed twice with glucose M9, and an aliquot used to inoculate 25 mL flasks containing 10 mL of glucose M9. Cultures were aerated at 37°C in an air incubator using a magnetic stir bar that spun inside the flask. The next day, an aliquot was inoculated into 250 mL Erlenmeyer flasks containing 100 mL glucose M9 media in triplicate such that the initial OD600 was 0.05. The flasks were then transferred to a 37°C water bath with continuous magnetic stir bar aeration as described above. Cell growth was monitored by measuring the OD600 every 30 minutes. The growth rate was then calculated by fitting an exponential curve to the time course OD600 measurements.
The glucose uptake rate was obtained by collecting supernatant at the same time we took each OD600 measurement. The supernatant was first filtered through 0.22 μM syringe-fitted membranes, then injected into an Waters HPLC system fitted with a Bio-Rad Aminex HPX-87H ion exclusion column (300 mm × 7.8 mm). The mobile phase was 5 mM H2SO4; the flow rate was 0.5mL/min; and the area of the glucose peak in each sample measured using refractive index detection. The glucose concentration in each sample was then obtained through comparison to a standard curve. Lastly, the glucose uptake rate was calculated from the glucose concentration at each time point, the growth rate, and an experimentally-determined value of 0.41 gram dry weight (gDW) per liter per unit OD (R2 = 0.94).
In silico modeling
The genome-scale metabolic models for Salmonella Typhimurium LT2 (Thiele, et al., 2011) and Escherichia coli K-12 MG1655 (Orth, et al., 2011) were implemented using the COBRA toolbox (Schellenberger, et al., 2011). Growth simulations were performed by constraining the model such that model parameters representing the in silico growth environment mimicked glucose M9 media and then by maximizing the default objective function. In both models, the default objective function was an equation representing biomass production from the different cellular components (e.g. DNA, RNA, amino acids, etc.) in stoichiometric amounts (Feist & Palsson, 2010). To compute the minimized sum of fluxes, the growth rate was first fixed to 0.1 h−1 while the sum of all fluxes in the model was minimized (Lewis, et al., 2010). A priority score was defined for each simulated double knockout since some double knockouts do not show a decrease in growth rate despite an increase in the minimal sum of fluxes. This effect stems from the fact that metabolic models do not account for the total cost of protein synthesis. The priority score was defined for each pair of genes as: Minimum flux with knockout of gene 1 and gene 2 - Maximum(Minimum flux with knockout of gene 1, Minimum flux with knockout of gene 2). Synthetic lethality was determined by computationally removing all pairs of enzymes in the model. Gene pairs for which the in silico growth rate was less than 0.001 h−1 were defined as synthetically lethal.
Construction of pASK1988
Plasmid pASK1988 was constructed by replacing the ampicillin resistance gene of pASK-IBA33+ (IBA GmbH, Goettingen, Germany) with the chloramphenicol resistance gene of pACBSR (Herring, et al., 2003). The CamR gene from pACBSR was PCR amplified with primers that included an AgeI restriction site on one end and a BlpI site on the other. The plasmid pASK-IBA33+, excluding the ampicillin resistance gene, was similarly PCR-amplified using primers that introduced AgeI and BlpI restriction sites on each end. All PCR was done using Phusion DNA polymerase. Both PCR products were purified from a 1% agarose gel using the QIAGEN QIAquick Gel Extraction Kit, digested with AgeI and BlpI, and ligated with T4 DNA ligase at 16°C overnight. The ligated products were then transformed into TOP10 cells (Life Technologies, Carlsbad, CA) by heat-shock at 42°C, recovered in SOC media, and plated on LB agar plates containing chloramphenicol. Successful transformants were cultured in LB media with chloramphenicol overnight for plasmid isolation the following day using the QIAprep Spin Miniprep Kit. We confirmed successful replacement of AmpR with CamR by PCR. The AgeI and BlpI restriction enzymes, Phusion DNA polymerase, and T4 DNA ligase were all purchased from New England BioLabs (Ipswich, MA).
Construction of pS7, pS8, pS10
The genes aceBA, aceK, and aceBAK were amplified by PCR using S. Typhimurium 14028s genomic DNA as a template. The full aceBAK operon and the genes aceBA were cloned into pASK-IBA33+ according to the manufacturer’s directions, yielding pS7 and pS8 respectively. The gene aceK was cloned into pASK1988, yielding pS10, All plasmids were isolated using the QIAprep Spin Miniprep Kit.
Induction and protein overexpression
Strains bearing pS7, pS8, pS10, or both pS8 and pS10 were first cultured in LB medium overnight with the appropriate antibiotic. The next day, an aliquot was used to inoculate two 250 mL Erlenmeyer flasks containing 20 mL of LB media such that the initial OD600 was 0.05. After allowing the cultures to grow at 37°C until they reached mid-log phase (OD600 ~0.5), anhydrotetracycline (ATc) was added to one of the flasks to a final concentration of 100 ng/mL. Both flasks were then cultured for an additional 3 hours, after which the cultures were spun down and washed twice with glucose M9 media. The washed cells were then each used to inoculate 250 mL Erlenmeyer flasks containing 100 mL of M9 medium with or without inducer in triplicate. The six flasks were then placed in a 37°C water bath and their OD600 values measured periodically over the following several hours.
RESULTS
In contrast to model simulations, a Salmonella Typhimurium Δppc mutant is non-viable in glucose M9 medium
We implemented the consensus S. Typhimurium metabolic reconstruction (Thiele, et al., 2011), and model simulations suggested that a Δppc knockout mutant would be viable in glucose M9 medium. When the Δppc knockout mutant was experimentally constructed, however, it was found to be viable in LB medium but not in glucose M9. Supplementation of the glucose M9 medium with 5 mM succinate restored growth of the Δppc mutant to a rate of 0.87 ± 0.010 h−1, similar to that of the wild-type 0.86 ± 0.021 h−1. The glucose uptake rate calculated for the Δppc mutant on the supplemented M9 medium was 14 ± 6.2 mmol/gDW/h, which was also similar to the value for the wild-type (15 ± 0.41 mmol/gDW/h).
Comparing efficient flux states enables a hypothesis-driven approach to reconcile metabolic models with experimental data
We hypothesized that overexpressing one or more key genes in the Δppc background might restore growth and thereby reconcile simulation results with the experimental data. Furthermore, if the reactions that correspond to these key genes are indeed compensatory, then they likely form a bottleneck – and therefore become critical reactions – when the first gene is deleted. We have developed a procedure to identify such bottlenecks by first calculating the minimized sum of all fluxes for a reference metabolic model, a value that represents an optimal flux state for the entire network. The reference here is the model for Δppc. Next, one constructs models of all possible double knockouts such that ppc is one of the two deleted genes, and the minimized sum of fluxes is likewise calculated for each member of this set. The reaction corresponding to the second gene in the pair is a potential bottleneck if the double mutant shows a significant increase in the minimized total flux over the single Δppc knockout. This second gene thereby becomes a potential candidate for overexpression.
We performed this analysis for Δppc using both the S. Typhimurium (Thiele, et al., 2011) and E. coli (Orth, et al., 2011) metabolic reconstructions. Even though all experimental work performed here was carried out in S. Typhimurium, we utilized the E. coli reconstruction as well because it is the most extensively curated reconstruction for a microbe and because of the close phylogenetic relationship between the two organisms. Both models pointed to isocitrate lyase, encoded by aceA, as the key compensatory enzyme, but in different ways. In the E. coli model, the minimized sum of fluxes increases 1.3-fold for the ΔppcΔaceA double mutant and has the highest priority score of 23.4 (Supplementary Table 1). In the S. Typhimurium model, the two genes are synthetically lethal (Supplementary Table 2).. Isocitrate lyase is part of the aceBAK operon, which encodes genes for the glyoxylate shunt (Figure 1). Supplementation of glucose M9 media with intermediates of the glyoxylate shunt (glyoxylate, malate, and succinate) restored growth in the Δppc mutant (Supplementary Table 3). In E. coli, a prior study noted increased flux through the glyoxylate shunt in an adaptively evolved Δppc mutant; however, no direct causal link between the two was conclusively proven (Fong, et al., 2006).
Figure 1.
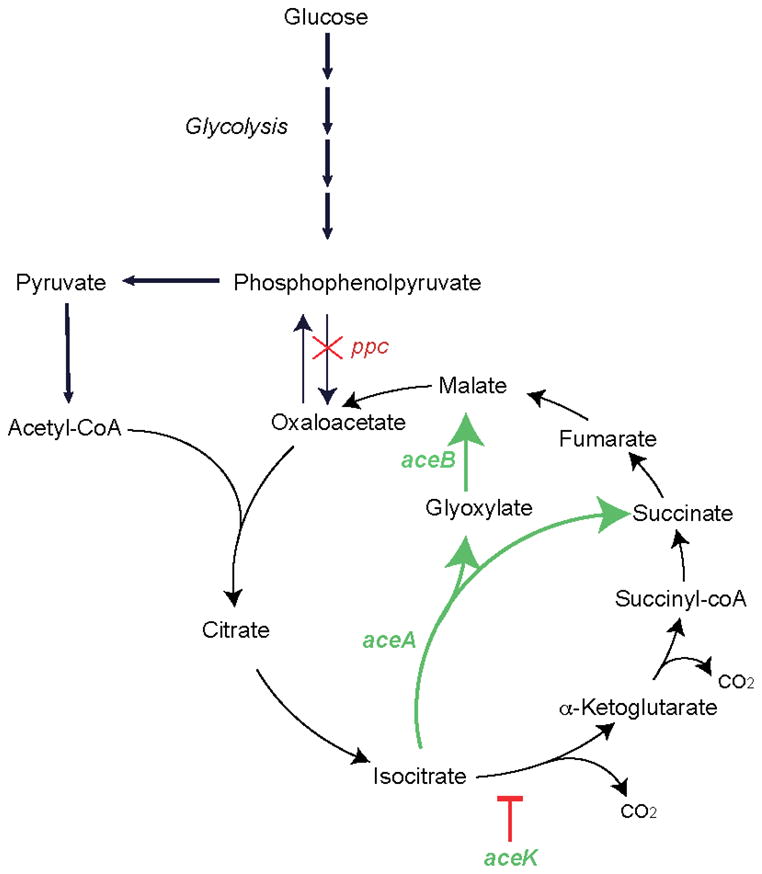
The location of the ppc knockout and the glyoxylate shunt within glycolysis and the TCA cycle.
Deleting iclR from the Δppc mutant restores viability
In E. coli, the Δppc mutant is unable to convert phosphoenolpyruvate (PEP) into oxaloacetate, which diverts PEP toward pyruvate biosynthesis (Peng, et al., 2004). Excess pyruvate, in turn, can activate IclR, a transcription factor that regulates transcription of genes involved in the glyoxylate shunt (Lorca, et al., 2007). We therefore created a ΔppcΔiclR double mutant in S. Typhimurium to investigate this possible mechanism linking deletion of ppc to the glyoxylate shunt and viability. Growth was restored in the ΔppcΔiclR double mutant at a rate of 0.45 ± 0.01 h−1 in glucose M9 medium, which is approximately 60% of the wild-type growth rate (Figure 2).
Figure 2.
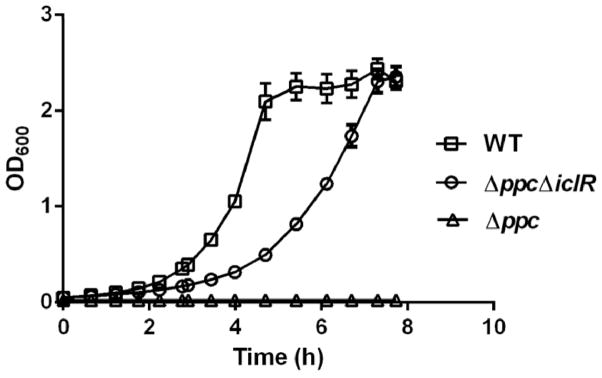
Growth curves for wild-type S. Typhimurium and the Δppc and ΔppcΔiclR mutants in glucose M9 media. Error bars represent the standard deviation from three independent replicates.
Simultaneous expression of aceBA and aceK from two separate plasmids can rescue growth in the Δppc mutant, but overexpression of aceBA, aceK, or aceBAK individually from a single plasmid cannot
We next overexpressed aceBAK using the pASK-IBA33+ inducible expression vector to confirm directly whether this operon by itself can rescue growth in the Δppc mutant. The inducer was anhydrotetracycline (ATc), which can be toxic at high concentrations (Ehrt, et al., 2005). We performed a dose response study to assess its toxicity to S. Typhimurium and found that ATc did not inhibit growth at concentrations up to 100 ng/mL [Supplementary Figure 1]. Both aceBA and aceK were then cloned into pASK-IBA33+ and pASK1988 [Supplementary Figure 2], yielding pS8 and pS10, respectively, and both transformed into the Δppc mutant, yielding strain ppc(pS8+pS10). Induction and simultaneous expression of aceBA and aceK rescued growth in the Δppc mutant (Figure 3). The ppc(pS8+pS10) mutant was no longer viable in glucose M9 when it was cured of one of the two plasmids (data not shown). Consistent with this observation, transformants bearing either pS8 or pS10 were also not viable in glucose M9 (data not shown).
Figure 3.
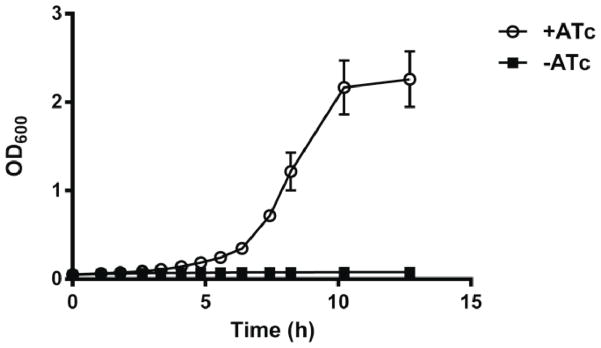
Growth curves for ppc(pS8 + pS10) in glucose M9 media in the presence and absence of the inducer anyhydrotetracycline (ATc). Error bars represent the standard deviation from three independent replicates.
DISCUSSION
The in silico reconstruction of metabolic networks provides a computational framework with which to organize genomic, transcriptomic, proteomic, and metabolomic data, allowing one to compute phenotypic states from genome-scale information. Continual refinement of the models to ensure consistency with experimental data serves to improve their accuracy and predictive ability. We present a method here for model refinement that focuses on reconciling inconsistencies between simulated versus experimental gene essentiality data that is based on an analysis of synthetic lethality and the minimized sum of fluxes in the models. We demonstrate our approach with ppc/aceBAK by showing that overexpression of aceBA and aceK is sufficient to rescue the Δppc mutant. Viewed another way, the S. Typhimurium metabolic model is incorrect because it erroneously allows flux to flow through the glyoxylate shunt when ppc is deleted due to the absence of regulatory information (i.e. iclR and aceK). We also provide indirect evidence that the key regulatory feature is a 184 intergenic region between aceA and aceK. This regulatory information would now ideally be incorporated into the S. Typhimurium model in order to update and refine it, but doing so is challenging computationally as it would require implementing conditional enzyme expression rules into a model that is based primarily on metabolism. However, these data can be more easily incorporated into expanded models that account for both metabolism and gene expression (Lerman, et al., 2012).
Expression of the aceBAK operon must occur on two separate plasmids in order to rescue the Δppc mutant. The proteins AceB and AceA catalyze the two reactions of the glyoxylate shunt, whereas AceK is a regulator that controls the branch point between the TCA cycle and the glyoxylate bypass (Cortay, et al., 1988). The intergenic region between aceB and aceA is only 32 bp long, but between aceA and aceK it is 184 bp (Chung, et al., 1993, Cozzone & El-Mansi, 2005). The long space between the latter two genes is palindromic and therefore is capable of forming a stable stem-loop structure, which might play a significant role in regulating transcription or aceK (Higgins, et al., 1982, Chung, et al., 1988). Data presented here supports this hypothesis: growth could be restored only when aceBA and aceK were cloned separately into two different expression plasmids such that the 184 intergenic region was removed. We did not observe restoration of growth in the Δppc mutant when we cloned and attempted to express the aceBAK operon in its entirety into a single expression vector (pS7).
We re-sequenced the genome of the ppc(pS8+pS10) mutant using Illumina technology to confirm that there were no additional mutations in the genome that might have contributed to restored growth. No mutations were detected, providing further evidence that overexpression of aceBA and aceK by itself is sufficient to rescue growth.
Supplementary Material
Acknowledgments
This work was funded by grant 1R01GM098105 from NIH/NIGMS to B.O.P. The authors thank Ramy Aziz, Kathy Andrews, Howard Li, Mallory Embree, Haythem Latif, Harish Nagarajan, and Edward O’Brien for helpful discussions.
Footnotes
The authors declare no conflicts of interest.
References
- Almaas E, Oltvai ZN, Barabasi AL. The activity reaction core and plasticity of metabolic networks. PLoS computational biology. 2005;1:e68. doi: 10.1371/journal.pcbi.0010068. [DOI] [PMC free article] [PubMed] [Google Scholar]
- Becker D, Selbach M, Rollenhagen C, Ballmaier M, Meyer TF, Mann M, Bumann D. Robust Salmonella metabolism limits possibilities for new antimicrobials. Nature. 2006;440:303–307. doi: 10.1038/nature04616. [DOI] [PubMed] [Google Scholar]
- Brynildsen MP, Winkler JA, Spina CS, Macdonald IC, Collins JJ. Potentiating antibacterial activity by predictably enhancing endogenous microbial ROS production. Nature biotechnology. 2013 doi: 10.1038/nbt.2458. [DOI] [PMC free article] [PubMed] [Google Scholar]
- Chandrasekaran S, Price ND. Probabilistic integrative modeling of genome-scale metabolic and regulatory networks in Escherichia coli and Mycobacterium tuberculosis. Proceedings of the National Academy of Sciences of the United States of America. 2010;107:17845–17850. doi: 10.1073/pnas.1005139107. [DOI] [PMC free article] [PubMed] [Google Scholar]
- Chang RL, Xie L, Bourne PE, Palsson BO. Drug off-target effects predicted using structural analysis in the context of a metabolic network model. PLoS computational biology. 2010;6:e1000938. doi: 10.1371/journal.pcbi.1000938. [DOI] [PMC free article] [PubMed] [Google Scholar]
- Chen L, Vitkup D. Predicting genes for orphan metabolic activities using phylogenetic profiles. Genome biology. 2006;7:R17. doi: 10.1186/gb-2006-7-2-r17. [DOI] [PMC free article] [PubMed] [Google Scholar]
- Chung T, Klumpp DJ, LaPorte DC. Glyoxylate bypass operon of Escherichia coli: cloning and determination of the functional map. Journal of bacteriology. 1988;170:386–392. doi: 10.1128/jb.170.1.386-392.1988. [DOI] [PMC free article] [PubMed] [Google Scholar]
- Chung T, Resnik E, Stueland C, LaPorte DC. Relative expression of the products of glyoxylate bypass operon: contributions of transcription and translation. Journal of bacteriology. 1993;175:4572–4575. doi: 10.1128/jb.175.14.4572-4575.1993. [DOI] [PMC free article] [PubMed] [Google Scholar]
- Cortay JC, Bleicher F, Rieul C, Reeves HC, Cozzone AJ. Nucleotide sequence and expression of the aceK gene coding for isocitrate dehydrogenase kinase/phosphatase in Escherichia coli. Journal of bacteriology. 1988;170:89–97. doi: 10.1128/jb.170.1.89-97.1988. [DOI] [PMC free article] [PubMed] [Google Scholar]
- Cozzone AJ, El-Mansi M. Control of isocitrate dehydrogenase catalytic activity by protein phosphorylation in Escherichia coli. Journal of molecular microbiology and biotechnology. 2005;9:132–146. doi: 10.1159/000089642. [DOI] [PubMed] [Google Scholar]
- Datsenko KA, Wanner BL. One-step inactivation of chromosomal genes in Escherichia coli K-12 using PCR products. Proceedings of the National Academy of Sciences of the United States of America. 2000;97:6640–6645. doi: 10.1073/pnas.120163297. [DOI] [PMC free article] [PubMed] [Google Scholar]
- Ehrt S, Guo XV, Hickey CM, Ryou M, Monteleone M, Riley LW, Schnappinger D. Controlling gene expression in mycobacteria with anhydrotetracycline and Tet repressor. Nucleic acids research. 2005;33:e21. doi: 10.1093/nar/gni013. [DOI] [PMC free article] [PubMed] [Google Scholar]
- Feist AM, Palsson BO. The biomass objective function. Current opinion in microbiology. 2010;13:344–349. doi: 10.1016/j.mib.2010.03.003. [DOI] [PMC free article] [PubMed] [Google Scholar]
- Feist AM, Herrgard MJ, Thiele I, Reed JL, Palsson BO. Reconstruction of biochemical networks in microorganisms. Nature reviews Microbiology. 2009;7:129–143. doi: 10.1038/nrmicro1949. [DOI] [PMC free article] [PubMed] [Google Scholar]
- Fong SS, Nanchen A, Palsson BO, Sauer U. Latent pathway activation and increased pathway capacity enable Escherichia coli adaptation to loss of key metabolic enzymes. The Journal of biological chemistry. 2006;281:8024–8033. doi: 10.1074/jbc.M510016200. [DOI] [PubMed] [Google Scholar]
- Frezza C, Zheng L, Folger O, et al. Haem oxygenase is synthetically lethal with the tumour suppressor fumarate hydratase. Nature. 2011;477:225–228. doi: 10.1038/nature10363. [DOI] [PubMed] [Google Scholar]
- Fuhrer T, Chen L, Sauer U, Vitkup D. Computational prediction and experimental verification of the gene encoding the NAD+/NADP+-dependent succinate semialdehyde dehydrogenase in Escherichia coli. Journal of bacteriology. 2007;189:8073–8078. doi: 10.1128/JB.01027-07. [DOI] [PMC free article] [PubMed] [Google Scholar]
- Herring CD, Glasner JD, Blattner FR. Gene replacement without selection: regulated suppression of amber mutations in Escherichia coli. Gene. 2003;311:153–163. doi: 10.1016/s0378-1119(03)00585-7. [DOI] [PubMed] [Google Scholar]
- Higgins CF, Ames GF, Barnes WM, Clement JM, Hofnung M. A novel intercistronic regulatory element of prokaryotic operons. Nature. 1982;298:760–762. doi: 10.1038/298760a0. [DOI] [PubMed] [Google Scholar]
- Kim TY, Sohn SB, Kim YB, Kim WJ, Lee SY. Recent advances in reconstruction and applications of genome-scale metabolic models. Current opinion in biotechnology. 2012;23:617–623. doi: 10.1016/j.copbio.2011.10.007. [DOI] [PubMed] [Google Scholar]
- Lee SJ, Lee DY, Kim TY, Kim BH, Lee J, Lee SY. Metabolic engineering of Escherichia coli for enhanced production of succinic acid, based on genome comparison and in silico gene knockout simulation. Applied and environmental microbiology. 2005;71:7880–7887. doi: 10.1128/AEM.71.12.7880-7887.2005. [DOI] [PMC free article] [PubMed] [Google Scholar]
- Lerman JA, Hyduke DR, Latif H, et al. In silico method for modelling metabolism and gene product expression at genome scale. Nature communications. 2012;3:929. doi: 10.1038/ncomms1928. [DOI] [PMC free article] [PubMed] [Google Scholar]
- Lewis NE, Hixson KK, Conrad TM, et al. Omic data from evolved E. coli are consistent with computed optimal growth from genome-scale models. Molecular systems biology. 2010;6:390. doi: 10.1038/msb.2010.47. [DOI] [PMC free article] [PubMed] [Google Scholar]
- Licona-Cassani C, Marcellin E, Quek LE, Jacob S, Nielsen LK. Reconstruction of the Saccharopolyspora erythraea genome-scale model and its use for enhancing erythromycin production. Antonie van Leeuwenhoek. 2012;102:493–502. doi: 10.1007/s10482-012-9783-2. [DOI] [PubMed] [Google Scholar]
- Lorca GL, Ezersky A, Lunin VV, et al. Glyoxylate and pyruvate are antagonistic effectors of the Escherichia coli IclR transcriptional regulator. The Journal of biological chemistry. 2007;282:16476–16491. doi: 10.1074/jbc.M610838200. [DOI] [PubMed] [Google Scholar]
- Nam H, Lewis NE, Lerman JA, Lee DH, Chang RL, Kim D, Palsson BO. Network context and selection in the evolution to enzyme specificity. Science. 2012;337:1101–1104. doi: 10.1126/science.1216861. [DOI] [PMC free article] [PubMed] [Google Scholar]
- Orth JD, Palsson BO. Systematizing the generation of missing metabolic knowledge. Biotechnology and bioengineering. 2010;107:403–412. doi: 10.1002/bit.22844. [DOI] [PMC free article] [PubMed] [Google Scholar]
- Orth JD, Palsson B. Gap-filling analysis of the iJO1366 Escherichia coli metabolic network reconstruction for discovery of metabolic functions. BMC systems biology. 2012;6:30. doi: 10.1186/1752-0509-6-30. [DOI] [PMC free article] [PubMed] [Google Scholar]
- Orth JD, Conrad TM, Na J, Lerman JA, Nam H, Feist AM, Palsson BO. A comprehensive genome-scale reconstruction of Escherichia coli metabolism--2011. Molecular systems biology. 2011;7:535. doi: 10.1038/msb.2011.65. [DOI] [PMC free article] [PubMed] [Google Scholar]
- Park JM, Kim TY, Lee SY. Genome-scale reconstruction and in silico analysis of the Ralstonia eutropha H16 for polyhydroxyalkanoate synthesis, lithoautotrophic growth, and 2-methyl citric acid production. BMC systems biology. 2011;5:101. doi: 10.1186/1752-0509-5-101. [DOI] [PMC free article] [PubMed] [Google Scholar]
- Peng L, Arauzo-Bravo MJ, Shimizu K. Metabolic flux analysis for a ppc mutant Escherichia coli based on 13C-labelling experiments together with enzyme activity assays and intracellular metabolite measurements. FEMS microbiology letters. 2004;235:17–23. doi: 10.1016/j.femsle.2004.04.003. [DOI] [PubMed] [Google Scholar]
- Perez Pulido R, Ben Omar N, Abriouel H, Lucas Lopez R, Martinez Canamero M, Galvez A. Microbiological study of lactic acid fermentation of Caper berries by molecular and culture-dependent methods. Applied and environmental microbiology. 2005;71:7872–7879. doi: 10.1128/AEM.71.12.7872-7879.2005. [DOI] [PMC free article] [PubMed] [Google Scholar]
- Reed JL, Patel TR, Chen KH, et al. Systems approach to refining genome annotation. Proceedings of the National Academy of Sciences of the United States of America. 2006;103:17480–17484. doi: 10.1073/pnas.0603364103. [DOI] [PMC free article] [PubMed] [Google Scholar]
- Schellenberger J, Park JO, Conrad TM, Palsson BO. BiGG: a Biochemical Genetic and Genomic knowledgebase of large scale metabolic reconstructions. BMC bioinformatics. 2010;11:213. doi: 10.1186/1471-2105-11-213. [DOI] [PMC free article] [PubMed] [Google Scholar]
- Schellenberger J, Que R, Fleming RM, et al. Quantitative prediction of cellular metabolism with constraint-based models: the COBRA Toolbox v2.0. Nature protocols. 2011;6:1290–1307. doi: 10.1038/nprot.2011.308. [DOI] [PMC free article] [PubMed] [Google Scholar]
- Thiele I, Hyduke DR, Steeb B, et al. A community effort towards a knowledge-base and mathematical model of the human pathogen Salmonella Typhimurium LT2. BMC systems biology. 2011;5:8. doi: 10.1186/1752-0509-5-8. [DOI] [PMC free article] [PubMed] [Google Scholar]
- van Berlo RJ, de Ridder D, Daran JM, Daran-Lapujade PA, Teusink B, Reinders MJ. Predicting metabolic fluxes using gene expression differences as constraints. IEEE/ACM transactions on computational biology and bioinformatics / IEEE, ACM. 2011;8:206–216. doi: 10.1109/TCBB.2009.55. [DOI] [PubMed] [Google Scholar]
- Vitkin E, Shlomi T. MIRAGE: a functional genomics-based approach for metabolic network model reconstruction and its application to cyanobacteria networks. Genome biology. 2012;13:R111. doi: 10.1186/gb-2012-13-11-r111. [DOI] [PMC free article] [PubMed] [Google Scholar]
Associated Data
This section collects any data citations, data availability statements, or supplementary materials included in this article.