

Abstract
Obesity, as a primary risk factor for osteoarthritis, has been shown to alter joint loading, but may also result in metabolic changes characterized by chronic, low-level inflammation due to increased circulating levels of adipose-derived cytokines, or “adipokines”. The presence of the infrapatellar fat pad in the knee suggests that local changes in adipokine concentrations may influence knee osteoarthritis. This study examined the hypotheses that the volume of the infrapatellar fat pad is correlated to the body mass index (BMI) of osteoarthritis patients, and that fat pad volume is greater in subjects with osteoarthritis. Fat pad volume was measured in sequential magnetic resonance images taken over one year in a cohort of 15 control and 15 knee osteoarthritis subjects. No differences were observed in the fat pad volume between the two groups at baseline, 3, 6, or 12 months. In control subjects, no significant correlations were present between any parameters (age, BMI, weight, volume of fat pad at any time point). However, in the osteoarthritic group, fat pad volume was correlated with age at every time point. One possible explanation is that local factors related to knee osteoarthritis may also induce enlargement of the fat pad with age. Alternatively, subjects who are prone to growth or enlargement of the fat pad may also be more prone to symptomatic osteoarthritis. These findings provide intriguing preliminary data on the potential role of the infrapatellar fat pad in osteoarthritis, although additional study is required to better understand the mechanisms of this relationship.
Keywords: arthritis, obesity, Hoffa’s fat pad, leptin, adipokine, cytokine, magnetic resonance imaging
Introduction
Osteoarthritis (OA) is a painful and debilitating disease of the synovial joints, affecting an estimated 21 million people in the United States 1. An important hallmark of this disease is the progressive degeneration of the articular cartilage, indicating that the normal balance of anabolic and catabolic activities of the chondrocytes has been disrupted 2. These activities are regulated by a variety of factors in the local microenvironment, consisting of soluble biochemical mediators, extracellular matrix (ECM) composition, and biophysical signals secondary to mechanical loading of the joint. There is increasing evidence that local and systemic inflammatory cytokines such as interleukin-1 (IL-1), tumor necrosis factors alpha (TNF-α), and inflammatory mediators such as free fatty acids, nitric oxide, or prostaglandins may play a major role in OA pathogenesis and pain. Additionally, biomechanical loading plays an important role in cartilage homeostasis, and under abnormal conditions, mechanical stress may be a significant factor in the initiation and progression of OA 3.
Within this context, obesity is often considered as the primary preventable risk factor for OA 4,5. However, the mechanisms linking obesity and OA are not fully understood. While the effects of obesity on the joint historically have been dismissed as simply increased “wear-and-tear”, there is increasing evidence of multifactorial, systemic links between obesity and OA. For example, only a small reduction in body weight (5 kg), and in particular body fat (2.4%), is associated with significant improvements in lowering the risk or progression of OA 6,7. Furthermore, in some studies, obesity has been associated with increased OA of the hand and wrist 8–10, which are not “weight-bearing” joints per se. Fat is a source of local and systemic inflammation and excess adiposity has been implicated in a number of diseases, such as type 2 diabetes, cardiovascular disease, and cancer, 11–13. A number of studies have shown that pro-inflammatory cytokines associated with adipose tissue (i.e., adipokines), such as IL-1, IL-6, or TNF-α, may have a catabolic effect on cartilage. In particular, the knee joint, which shows a strong relationship between obesity and OA, also contains a relatively large adipose depot, termed the infrapatellar fat pad, which may serve as a localized source of adipokines within the joint 14,15.
The function of the infrapatellar fat pad is not well understood. In the past it was believed that it only provided a blood supply to the patellar tendon. While it has been proposed that the volume and configuration of the fat pad is important to knee function 16, other studies have suggested that the fat pad may be a source of anterior knee pain 17,18. Importantly, recent studies provide evidence of the local production of adipokines by cells of the infrapatellar fat pad 19–21. However, there is little direct evidence supporting the relationship between level of adiposity present in the knee (i.e., fat pad volume) and the progression of knee osteoarthritis. The objective of this study was to examine the hypotheses that the volume of the infrapatellar fat pad is correlated to body mass index (BMI), and that in OA patients, the fat pad is enlarged and its size is correlated to pain. These relationships were examined by measuring fat pad size in sequential magnetic resonance (MR) images taken in a cohort of control and OA subjects.
Materials and Methods
MR Imaging and Analysis
For this study, two series of 3D sagittal images were obtained with T1 and T2* weighted contrasts, respectively (Figure 1). Both scans were obtained using 3D gradient echo sequences with the same spatial resolution, 150 mm field of view, 512 x 512 matrix, 1.5 mm slice partition with the same spatial prescription, with an in-plane pixel size of 0.293 mm. The T1 weighted sequence was obtained using a 20 ms TR, 6.73 ms TE, water excitation (for fat suppression) with pixel bandwidth of 170 Hz and elliptical sampling for a 6 minute 53 second scan time. The T2* weighted sequence was obtained using a 21 ms TR, 14 ms TE, no fat suppression with pixel bandwidth of 170 Hz and elliptical sampling, for a scan time of 7 minutes 13 seconds. The scans were obtained in a transmit/receive knee coil on a 3 Tesla Siemens TRIO MRI system.
Figure 1.
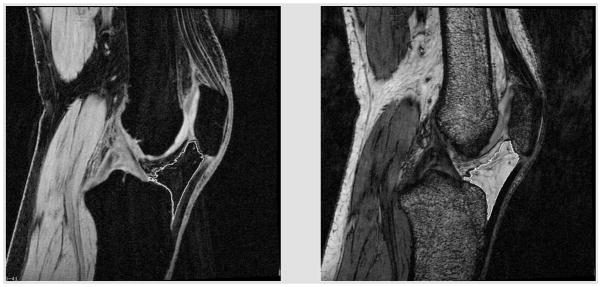
Water excite T1 (left) and T2* (right) of human MR images showing the outlined fat pad regions used to determine fat pad volume.
The two contrasts were used to eliminate non-fat pad structures, and the volume of the infrapatellar fat pad was extracted from each MR images using a region growing strategy, as described previously 22. Briefly, this method involves a seed-based region-growing algorithm with a ‘auto gap’ feature. This latter feature is simply a post growing processing step that performs a morphologic open to the existing region, thus eliminating ‘thin’ regions from the seeded region. The seed ‘grows’ based on a threshold range set by the user to include pixels with ‘similar characteristics’. A general formulation of this algorithm has been described previously (e.g., 23).
MRI Validation study
To validate the MRI-based method for measuring fat pad volume, knees of pigs (n=8, female, 2–3 years old) were obtained immediately post mortem from a local slaughterhouse and imaged with MRI at 3 Tesla using the same protocol utilized with the human subjects. The fat pad was dissected, measured (height, width, length), and volume determined by displacement of water. MR imaging was performed on fresh tissue. Fat pad volume was also analyzed using an ellipsoidal approximation using the following equation:
Control and OA subjects
Data from 30 subjects from a prior study were deidentified and made available for image analysis. All protocols were performed in concordance with the Duke University Institutional Review Board. Subjects (all female) were included from the original study in a control group (normal knee, n=15) and in a primary knee OA group (n=15). For inclusion in this study, OA patients met American College of Rheumatology diagnostic criteria for radiographic knee OA, with a Kellgren Lawrence grade 2 or 3 of the signal knee, 24 and were overweight (body mass index ≥ 25 kg/m2). A total of 15 controls were recruited; they were age-matched to within 5 years of the OA subjects, had neither knee pain symptoms nor radiographic knee OA, and were not overweight 25. Patients with evidence of rheumatoid arthritis or other inflammatory joint disease, injury of the knee, or history of knee surgery were excluded from this study. The demographics of these subjects are shown in Table 1. In addition, pain was measured by Western Ontario and McMasters University Osteoarthritis Index (WOMAC) pain score, which consists of 5 items scored 0–4 for a possible score of 0–20 26. Magnetic resonance imaging (MRI) of the knee was performed on all subjects at baseline, 3, 6 and 12 months.
Table 1. Demographics of the two subject groups.
All subjects were female. Statistical comparisons of BMI, weight, or pain were not made as these parameters were part of the inclusion criteria. (mean ± standard deviation).
| Control | Osteoarthritic | |
|---|---|---|
| Age (years) | 61.5 ± 8.8 | 60.8 ± 9.3 |
| BMI (kg/m2) | 23.6 ± 2.12 | 34.96 ± 4.03 |
| Weight | 65.0 ± 8.55 kg (143 ± 18.8 lbs) | 94.5 ± 10.0 kg (208 ± 22.1 lbs) |
| Total WOMAC Score | 1.4 ± 3.7 | 29.2 ± 15.3 |
Volumetric analysis of the fat pad from MR images
The volume of each infrapatellar fat pad was determined from MR images using the image analysis program ANALYZE (Analyze Direct Overland Park, KS, USA). A single analyst who was blinded with respect to all subject information did all of the image analysis. The baseline image findings were analyzed with respect to subject’s age, weight and body mass index (BMI), height, and pain score by group (control vs. OA) status. Results of the baseline analysis were compared to the subsequent scans (3, 6 and 12 months).
Statistical analysis
The mean fat pad volumes were compared by two-tailed t-test between control and OA groups. Bivariate analyses of fat pad volume versus age and BMI were performed for each time point. Multivariate correlational analysis was performed with dependent variable volume of fat pad (at baseline 3 months, 6 months and 12 months) and age, BMI or weight, and pain. Statistical significance was reported at the 95% confidence level.
Results
MRI validation study
The dissected volume (55.87 ± 13.84 ml, mean ± SD) of the porcine fat pad determined by water displacement was strongly correlated with MRI extracted volume (50.57 ± 14.04 ml; R2=0.989, p<0.0001), although the MRI images were consistently ~10% lower than the dissected volume. This difference may reflect the actual difference dissected vs. MR imaged boundaries of the fat pad, or may be due to numerical errors due to the anisotropy of the MR voxels. The volume by water displacement was less strongly correlated with a calculated volume of the fat pad using the height/width/length data and assuming an ellipsoidal shape (50.56 ± 22.9 ml; R2=0.728, p<0.01) determined. These results demonstrate that the MR volume represents a relatively accurate description of the fat pad volume determined by dissection and fluid displacement measurement.
Human Subject Results
No significant differences were observed in the mean volume of the fat pad of the knee between control and OA groups at any time point (baseline, 3, 6, or 12 months) (Table 2). In the control group, multivariate analysis showed no significant correlation between fat pad volume at baseline, 3 months, 6 months and 12 months) and (age, BMI, weight, or pain score. In particular, there was no association of age and BMI for either group (R2=0.0007, p=0.89 overall; R2=0.09, p=0.26 for control group; and R2=0.017, p=0.007 for OA group). There was no association of age and pain (R2=0.001, p=0.853 overall; R2=0.013, p=0.675 for control group; and R2=0.015, p=0.659 for OA group). However, in the OA group, a significant relationship was found between subject age and fat pad volume at every time point by bivariate analysis (Table 3). Furthermore, multivariable analysis showed that the association of fat pad volume and age was independent of BMI, pain, and knee OA status Table 4). Similar trends were found if the fat pad volume was normalized to subject height, height-squared, or height-cubed (data not shown).
Table 2. MRI-measured volume of the fat pad over time for control and osteoarthritic groups.
No significant differences were observed between control and OA groups at any time point. (mean ± standard deviation)
| Control Fat Pad Volume (cm3) | Osteoarthritic Fat Pad Volume (cm3) | p value | |
|---|---|---|---|
| Baseline | 20.70±3.30 | 21.45±3.08 | p=0.54 |
| 3 months | 21.91±3.97 | 22.68±3.82 | p=0.59 |
| 6 months | 21.27±3.93 | 21.59±3.80 | p=0.82 |
| 12 months | 22.48±3.96 | 23.28±4.05 | p=0.59 |
Table 3. Bivariate analyses of Fat Pad volume.
A significant correlation was observed between age and fat pad volume in the OA and combined overall groups.
| Fat Pad Volume | |||||
|---|---|---|---|---|---|
| Group | Baseline | 3 months | 6 months | 12 months | |
| Control | Age | R2=0.093 (p=0.268) | R2=0.08 (p=0.313) | R2=0.02 (p=0.642) | R2=0.08 (p=0.230) |
| BMI | R2=0.04 (p=0.465) | R2=0.017 (p=0.644) | R2=0.030 (p=0.534) | R2=0.040 (p=0.473) | |
| Pain* | R2=0.002 (p=0.885) | R2=0.003 (p=0.855) | R2=0.0005 (p=0.939) | R2=0.004 (p=0.830) | |
| OA | Age | R2=0.30 (p=0.036) | R2=0.36 (p=0.019) | R2=0.36 (p=0.018) | R2=0.47 (p=0.0005) |
| BMI | R2=0.0006 (p=0.93) | R2=0.019 (p=0.626) | R2=0.0006 (p=0.933) | R2=0.031 (p=0.536) | |
| Pain* | R2=0.001 (p=0.904) | R2=0.008 (p=0.747) | R2=0.0005 (p=0.936) | R2=0.005 (p=0.799) | |
| Overall | Age | R2=0.172 (p=0.02) | R2=0.187 (p=0.017) | R2=0.132 (p=0.048) | R2=0.235 (p=0.007) |
| BMI | R2=0.006 (p=0.675) | R2=0.0008 (p=0.883) | R2=0.00 (p=0.99) | R2=0.00 (p=0.974) | |
| Pain* | R2=0.008 (p=0.649) | R2=0.015 (p=0.515) | R2=0.0005 (p=0.906) | R2=0.002 (p=0.813) | |
Total WOMAC Score
Table 4. Multivariable analysis of age, BMI, pain, and OA status.
The dataset was analyzed using multivariate analysis to examine the influence of these variables on fat pad volume. There was an association of fat pad volume with age, independent of BMI, pain and knee OA status, which was statistically significant at baseline, 3, 6, and 12 months. Results show parameter estimates and p values.
| Overall | Fat Pad Volume | ||||
|---|---|---|---|---|---|
| Baseline | 3 months | 6 months | 12 months | ||
| Model R2 | 0.20 | 0.22 | 0.15 | 0.30 | |
| Age | 151.39 (p=0.025) | 188.74 (p=0.021) | 159.45 (p=0.055) | 224.63 (p=0.0057) | |
| BMI | −72.86 (p=0.691) | −161.82 (p=0.464) | −108.69 (p=0.633) | −256.83 (p=0.236) | |
| Pain | −21.11 (p=0.692) | 0.442 (p=0.995) | −25.708) (p=0.698) | −53.35 (p=0.394) | |
| OA status | −1132.72 (p=0.447) | −1357.45 (p=0.448) | −1185.89 (p=0.521) | −2669.32 (p=0.131) | |
Discussion
Obesity is now considered to be a low-grade systemic inflammatory disease,27 based on previous studies showing that overweight and obese adults have elevated serum levels of inflammatory markers and mediators such as IL-1, leptin, IL-6, and TNF–α 28. These findings have suggested that the link between obesity and OA may not be solely biomechanical, but may in fact reflect the influence of local as well as systemic adipokines associated with obesity 29. However, our findings showed no relationship between the size of the infrapatellar fat pad of the knee and body weight, BMI, or the presence of OA. These findings suggest that fat pad size, in and of itself, is not predictive of OA, and appears unlikely to be regulated by overall body adiposity.
A novel and intriguing finding of this study was the correlation between fat pad volume and subject age in OA subjects at all time points examined. However, because the methods of this study are correlative, the direct mechanism(s) responsible for this association cannot be determined without further study. Nonetheless, the fact that the association of fat pad size with age was present in OA subjects and not controls suggests several potential explanations. For example, local factors related to knee OA could also induce enlargement of the fat pad with age. The fat pad contains multipotent stem cells with the ability to form fibrous or cartilaginous tissues 30, and it is often removed during knee replacement surgery to prevent fibrosis 31. The cytokine environment associated with OA may thus be responsible for proliferation or fibroblastic differentiation. For example, the adipokines leptin and adiponectin have been shown to upregulate collagen and hyaluronic acid production by fibroblasts32.
Alternatively, the correlation between fat pad size and age may suggest a more causative role of the fat pad in OA, i.e., that subjects whose fat pads enlarge with age are more prone to OA. Although no correlation was observed between body adiposity (BMI) and fat pad volume in the present study, the infrapatellar fat pad shows increased lymphocytic infiltration with age 33, and cells of the fat pad have been shown to release various growth factors and adipokines such as basic fibroblast growth factor, vascular endothelial growth factor, TNF-α, and IL-6 19,21. These cytokines have been shown to induce a local inflammatory response and are potentially linked to other characteristics of OA. Thus an increased number of adipocytes in the knee joint may be related to higher concentrations of these factors and other adipokines.
While the majority of previous studies of the infrapatellar fat pad have focused on its anatomy, radiographic findings, and pathology 16,34–37, the fat pad may also be a source of knee pain 35,38,39 especially in the anterior region of the knee 39,40. Given the high innervation of the fat pad and its pain sensitivity 41, an additional explanation of our current findings is that subjects who exhibit fat pad enlargement or growth with age may also show symptomatic OA (i.e., pain). While the current study focused on the fat pad of the knee, it is important to note that other joints of the body such as the elbow, shoulder, and ankle also contain intra- and extra-articular fat depots that may also influence joint pain or function 42–44.
In summary, our findings suggest a potential role of the fat pad in knee OA, although a cause-and-effect relationship cannot be determined in the present study. Further study of the relationship between the local biomechanical and inflammatory environments of the knee joint, and their influence on the cells of the fat pad, may provide new insights into the etiology and pathogenesis of obesity-induced OA.
Acknowledgments
We would like to thank Dr. Nancy Major for advice during the initial portions of this study. This work was supported in part by NIH grants AR48182, AR50245, AG15768, and AR48852, and the Duke Translational Research Institute.
References
- 1.Praemer A, Furner S, Rice DP. Musculoskeletal Conditions in the United States. American Academy of Orthopaedic Surgeons; Rosement, IL: 1999. [Google Scholar]
- 2.Poole AR. Imbalances of anabolism and catabolism of cartilage matrix components in osteoarthritis. In: Keuttner KE, Goldberg VM, editors. Osteoarthritic Disorders. AAOS; Rosemont: 1995. pp. 247–260. [Google Scholar]
- 3.Griffin TM, Guilak F. The role of mechanical loading in the onset and progression of osteoarthritis. Exerc Sport Sci Rev. 2005;33:195–200. doi: 10.1097/00003677-200510000-00008. [DOI] [PubMed] [Google Scholar]
- 4.Powell A, Teichtahl AJ, Wluka AE, Cicuttini FM. Obesity: a preventable risk factor for large joint osteoarthritis which may act through biomechanical factors. Br J Sports Med. 2005;39:4–5. doi: 10.1136/bjsm.2004.011841. [DOI] [PMC free article] [PubMed] [Google Scholar]
- 5.Felson DT, Anderson JJ, Naimark A, et al. Obesity and knee osteoarthritis. The Framingham Study. Ann Intern Med. 1988;109:18–24. doi: 10.7326/0003-4819-109-1-18. [DOI] [PubMed] [Google Scholar]
- 6.Felson DT, Zhang Y, Anthony JM, et al. Weight loss reduces the risk for symptomatic knee osteoarthritis in women. The Framingham Study. Ann Intern Med. 1992;116:535–539. doi: 10.7326/0003-4819-116-7-535. [DOI] [PubMed] [Google Scholar]
- 7.Toda Y, Toda T, Takemura S, et al. Change in body fat, but not body weight or metabolic correlates of obesity, is related to symptomatic relief of obese patients with knee osteoarthritis after a weight control program. J Rheumatol. 1998;25:2181–2186. [PubMed] [Google Scholar]
- 8.Carman WJ, Sowers M, Hawthorne VM, Weissfeld LA. Obesity as a risk factor for osteoarthritis of the hand and wrist: a prospective study. Am J Epidimiol. 1994;139 doi: 10.1093/oxfordjournals.aje.a116974. [DOI] [PubMed] [Google Scholar]
- 9.Cicuttini FM, Baker JR, Spector TD. The association of obesity with osteoarthritis of the hand and knee in women: a twin study. J Rheumatol. 1996;23:1221–1226. [PubMed] [Google Scholar]
- 10.Felson DT, Chaisson CE. Understanding the relationship between body weight and osteoarthritis. Baillieres Clin Rheumatol. 1997;11:671–681. doi: 10.1016/s0950-3579(97)80003-9. [DOI] [PubMed] [Google Scholar]
- 11.Gunter MJ, Leitzmann MF. Obesity and colorectal cancer: epidemiology, mechanisms and candidate genes. J Nutr Biochem. 2006;17:145–156. doi: 10.1016/j.jnutbio.2005.06.011. [DOI] [PubMed] [Google Scholar]
- 12.Lowell BB, Shulman GI. Mitochondrial dysfunction and type 2 diabetes. Science. 2005;307:384–387. doi: 10.1126/science.1104343. [DOI] [PubMed] [Google Scholar]
- 13.Pilz S, Scharnagl H, Tiran B, et al. Free fatty acids are independently associated with all-cause and cardiovascular mortality in subjects with coronary artery disease. J Clin Endocrinol Metab. 2006 doi: 10.1210/jc.2006-0195. [DOI] [PubMed] [Google Scholar]
- 14.Distel E, Cadoudal T, Durant S, et al. The infrapatellar fat pad in knee osteoarthritis: an important source of interleukin-6 and its soluble receptor. Arthritis Rheum. 2009;60:3374–3377. doi: 10.1002/art.24881. [DOI] [PubMed] [Google Scholar]
- 15.Presle N, Pottie P, Dumond H, et al. Differential distribution of adipokines between serum and synovial fluid in patients with osteoarthritis. Contribution of joint tissues to their articular production. Osteoarthritis Cartilage. 2006;14:690–695. doi: 10.1016/j.joca.2006.01.009. [DOI] [PubMed] [Google Scholar]
- 16.Saddick D, Mcnally EG, Richardson M. MRI of Hoffa’s fat pad. Skeletal Radiol. 2004;33:433–444. doi: 10.1007/s00256-003-0724-z. [DOI] [PubMed] [Google Scholar]
- 17.Bohnsack M, Meier F, Walter GF, et al. Distribution of the substance-P nerves inside the infrapatellar fat pad and the adjacent synovial tissue: a Neurohitological approach to anterior knee pain syndrome. Arch Orthop Trauma Surg. 2005;125:592–597. doi: 10.1007/s00402-005-0796-4. [DOI] [PubMed] [Google Scholar]
- 18.Keser S, Bayar A, Numanoglu G. An unusual cause for anterior knee pain: strangulated intraarticular lipoma. Knee Surg Sports Traumatol Arthrosc. 2005;13:585–588. doi: 10.1007/s00167-004-0595-4. [DOI] [PubMed] [Google Scholar]
- 19.Presle N, Pottie P, Dumond H, et al. Differential disruption of adipokines between serum and synovial fluid in patients with osteoarthritis. Contribution of joint tissues to their articular production. OsteoArthritis and Cartilage. 2006 doi: 10.1016/j.joca.2006.01.009. in press. [DOI] [PubMed] [Google Scholar]
- 20.Teichtahl AJ, Wluka AE, Proietto J, Cicuttini FM. Obesity abd the female sex, risk factors for knee osteoarthritis that may be attributable to systemic or local leptin biosynthesis and its cellular effects. Medical Hypothesis. 2005;65:312–315. doi: 10.1016/j.mehy.2005.02.026. [DOI] [PubMed] [Google Scholar]
- 21.Ushiyama T, Chano T, Inoue K, Matsusue Y. Cytokine production in the infrapatella fat pad: another source of cytokine in knee synovial fluids. Ann Rheum Dis. 2003;62:108–112. doi: 10.1136/ard.62.2.108. [DOI] [PMC free article] [PubMed] [Google Scholar]
- 22.Goldszal AF, Pham DL. Volumetric Segmentation of Magnetic Resonance Images of the Brain. In: Bankman I, editor. Handbook of Medical Image Processing. Academic Press; San Diego: 2000. pp. 185–194. [Google Scholar]
- 23.Gonzalez RC, Woods RE. Digital Image Processing. Addison-Wesley; New York: 1992. [Google Scholar]
- 24.Kellgren JH, Lawrence JS. Radiological assessment of osteo-arthrosis. Ann Rheum Dis. 1957;16:494–502. doi: 10.1136/ard.16.4.494. [DOI] [PMC free article] [PubMed] [Google Scholar]
- 25.Altman R, Asch E, Bloch D. Development of criteria for the classification and reporting of osteoarthritis: classification of osteoarthritis of the knee. Arthritis Rheum. 1986;29:1039–1049. doi: 10.1002/art.1780290816. [DOI] [PubMed] [Google Scholar]
- 26.Bellamy N, Buchanan WW, Goldsmith CH, et al. Validation study of WOMAC: a health status instrument for measuring clinically important patient relevant outcomes to antirheumatic drug therapy in patients with osteoarthritis of the hip or knee. J Rheumatol. 1988;15:1833–1840. [PubMed] [Google Scholar]
- 27.Das UN. Is obesity an inflammatory condition? Nutrition. 2001;17:953–966. doi: 10.1016/s0899-9007(01)00672-4. [DOI] [PubMed] [Google Scholar]
- 28.Visser M, Bouter LM, McQuillan GM, et al. Elevated C-reactive protein levels in overweight and obese adults. Jama. 1999;282:2131–2135. doi: 10.1001/jama.282.22.2131. [DOI] [PubMed] [Google Scholar]
- 29.Griffin TM, Huebner J, Kraus VB, Guilak F. Extreme obesity due to impaired leptin signaling in mice does not cause knee osteoarthritis. Arthritis & Rheumatism. 2009 doi: 10.1002/art.24854. in press. [DOI] [PMC free article] [PubMed] [Google Scholar]
- 30.Wickham MQ, Erickson GR, Gimble JM, et al. Multipotent stromal cells derived from the infrapatellar fat pad of the knee. Clin Orthop Relat Res. 2003:196–212. doi: 10.1097/01.blo.0000072467.53786.ca. [DOI] [PubMed] [Google Scholar]
- 31.Tanaka N, Sakahashi H, Sato E, et al. Influence of the infrapatellar fat pad resection in a synovectomy during total knee arthroplasty in patients with rheumatoid arthritis. J Arthroplasty. 2003;18:897–902. doi: 10.1016/s0883-5403(03)00271-7. [DOI] [PubMed] [Google Scholar]
- 32.Ezure T, Amano S. Adiponectin and leptin up-regulate extracellular matrix production by dermal fibroblasts. Biofactors. 2007;31:229–236. doi: 10.1002/biof.5520310310. [DOI] [PubMed] [Google Scholar]
- 33.Jedrzejczyk T, Mikusek J, Rudnicki P, Lopata P. The infrapatellar adipose body in humans of various age groups. Folia Morphol (Warsz) 1996;55:51–55. [PubMed] [Google Scholar]
- 34.Gallagher J, Tierner P, Murray P, O’Brien M. The infrapatellar fat pad: anatomy and clinical correlations. Knee Surg Sports Traumatol Arthrosc. 2005;13:268–272. doi: 10.1007/s00167-004-0592-7. [DOI] [PubMed] [Google Scholar]
- 35.Ozkur A, Adaletti I, Sirikei A, Kervancioglu R. Hoffa’s recess in the infrapatellar fat pad of the knee on the MR imaging. Surg Radiol Anat. 2005;27:61–63. doi: 10.1007/s00276-004-0275-6. [DOI] [PubMed] [Google Scholar]
- 36.Patel SJ, Kaplan PA, Sussault RG, Kahler DM. Anatomy and clinical significance of the horizontal cleft in the infrapatellar fat pad of the knee: MR imaging. Am J Roentgenol. 1998;170:1551–1555. doi: 10.2214/ajr.170.6.9609172. [DOI] [PubMed] [Google Scholar]
- 37.Vahlensieck M, Linneborn G, Schild HH, Schmidt HM. Hoffa’s recess: incidence, morphology and differential diagnosis of the globular shape cleft in the infrapatellar fat pad of the knee on MRI and cadaver dissections. Eur Radiol. 2002;12:90–93. doi: 10.1007/s003300100982. [DOI] [PubMed] [Google Scholar]
- 38.Morrini G, Chiodi E, Centanni F, Gattazzo D. Hoffa’s disease of the adipose pad: Magnetic resonanceversus surgical findings. Radiol Med. 1998;95:278–285. [PubMed] [Google Scholar]
- 39.Ogilvie-Harris DJ, Giddens J. Hoffa’s disease: arthroscopic resection of the infrapatellar fat pad. Arthroscopy. 1994;10:184–187. doi: 10.1016/s0749-8063(05)80091-x. [DOI] [PubMed] [Google Scholar]
- 40.Canizares-Perez AC, Stallenberg B. Magnetic resonance Imaging of the infra patellar fat pad: correlation with patellar articular cartilage abnormalities. JBR-BTR. 2005;88:1–6. [PubMed] [Google Scholar]
- 41.Dye SF, Vaupel GL, Dye CC. Conscious neurosensory mapping of the internal structures of the human knee without intraarticular anesthesia. Am J Sports Med. 1998;26:773–777. doi: 10.1177/03635465980260060601. [DOI] [PubMed] [Google Scholar]
- 42.Awaya H, Schweitzer ME, Feng SA, et al. Elbow synovial fold syndrome: MR imaging findings. AJR Am J Roentgenol. 2001;177:1377–1381. doi: 10.2214/ajr.177.6.1771377. [DOI] [PubMed] [Google Scholar]
- 43.Ghazzawi A, Theobald P, Pugh N, et al. Quantifying the motion of Kager’s fat pad. J Orthop Res. 2009;27:1457–1460. doi: 10.1002/jor.20900. [DOI] [PubMed] [Google Scholar]
- 44.Vahlensieck M. MRI of the shoulder. Eur Radiol. 2000;10:242–249. doi: 10.1007/s003300050040. [DOI] [PubMed] [Google Scholar]