

Abstract
Background
We evaluated the clinical validity of serum FT4 measurements by assessing its correlation with log TSH. To provide pediatric reference intervals (representative ranges) for FT4, and TSH on the Architect ci8200 integrated system.
Methods
This population-based study encompassed 6023 children (3369 females and 2654 males). The percentile and Hoffmann approaches for obtaining reference intervals on these analytes were also compared. Results: FT4 correlation with log TSH was poor ( r=0.010 for males and 0.050 for females). Reference intervals were established. TSH and FT4 did not show a significant sex difference; moreover, the intervals decreased with age for FT4 and TSH.
Conclusions
Whereas in a previous study ultrafiltration tandem mass spectrometry yielded a correlation of r=0.90 for FT4 vs. log TSH this present study reveals a poor FT4 vs. log TSH correlation in the pediatric population studied and indicates the FT4 immunoassay conducted on the Abbott Architect ci8200 is less useful clinically than might have been expected. Reference intervals using the Hoffmann approach for pediatric in- and out-patients compare well with previously published results utilizing the percentile approach.
Keywords: Children, Immunoassay, Reference intervals, Free thyroxine, Thyroid-stimulating hormone
1. Introduction
Circulating TSH (thyroid-stimulating hormone) and FT4 (free thyroxine) are measured to ascertain the cause for thyroid dysfunction (if it is of pituitary or of primary thyroid origin) [1–7]. When both TSH and FT4 are above (or below) normal a pituitary origin is suspected, while increased TSH and decreased FT4 indicate primary hypothyroidism, a decreased TSH and increased FT4 indicates primary hyperthyroidism. The objectives of this study were: To evaluate the validity of the direct analogue immunoassay for FT4 on the Architect ci8200 by assessing its correlation with log TSH for FT4/TSH assays performed on the same serum/plasma samples. To provide pediatric reference intervals for FT4 and TSH on the Architect ci8200 integrated system; and to compare the percentile and Hoffmann approaches [8] for determination of reference intervals [9]. Pediatric reference intervals for these analytes on alternative platforms are also available [10–12]. Our recent publication suggests superior correlation of FT4 with log TSH if the measurement of FT4 is performed by tandem mass spectrometry [7,13].
2. Methods
2.1. Reference population
Blood samples were drawn from 6023 children and were from both in-patients and out-patients (the latter drawn at hospital clinic visits) between November 2007 and June 2009. Patients were from the Hampton Roads area of Southeastern, Virginia, mainly of African American and Caucasian ethnicity. Samples (serum or plasma) were collected in vacutainer tubes and processed according to usual laboratory procedures. All samples were analyzed at the Children’s Hospital of The King’s Daughters within 6 h of blood collection. For this study, the only information provided was the child’s sex and age and the dates of sample collection. All other personal patient identifiers were removed thus providing absolute patient confidentiality and meeting the Health Insurance Portability and Accountability Act (HIPAA) requirements. A waiver was obtained from the Georgetown University Medical Center Institutional Review Board.
2.2. Analytical system and assays
All specimens were tested using the Architect ci2800 integrated system (Abbott Diagnostics, Abbott Park, IL). The ci8200 system consists of a c800 clinical chemistry analyzer and an i2000SR immunoassay analyzer connected by a robotic sample handler (RSH) that moves samples between the 2 analyzers. Each specimen was objectively evaluated for endogenous interferents, hemolysis, icterus, and lipemia (HIL), using an automated feature on the Architect ci8200 system. HIL index measurements estimated the amount of hemolysis (H), icterus (I), and lipemia (L) in the specimens to ensure the validity of test results. Specimens with abnormal HIL levels were not included in the study. Calibrator traceability information, related to the metrological standardization of assays, is method specific and is available in Abbott’s package inserts. Prior to testing, calibration of all assays and establishment of quality control limits for each were completed. Quality control samples were tested and specimen testing only proceeded when controls were within limits. All daily, weekly, and monthly preventive maintenance was performed as required by the manufacturer.
2.3. Statistical analysis
All assay results were stratified by sex and age. Furthermore, in calculating reference intervals for FT4, data points with associated TSH values >7.00 mIU/l or <0.30 mIU/l were discarded. This removal of FT4 and TSH values did not pertain to the FT4 vs. log TSH studies. A computer-adapted Hoffmann approach was utilized to calculate the reference intervals, since it separates normal and abnormal values [9]. Distributions were either Gaussian or were made Gaussian by calculating the logarithm of the analyte values. A Gaussian distribution results in a bell shaped curve and provides a linear Hoffmann plot for the central 20–80th percentiles. Percent cumulative frequency was then plotted against analyte or log analyte value. As indicated this resulted in an s-shaped curve with a linear central section. A straight line is drawn through the central points and this line then extrapolated to estimate the 2.5th and 97th percentiles.
3. Results and discussion
Reference intervals were successfully established for 7 separate age groups for both sexes. As recommended by the IFCC, it was aimed that each age group had at least 120 data points [14]. Results for each of these analytes are shown in Tables 1 and 2. For FT4 and TSH, the reference intervals decreased as age increased, with little difference found between males and females. The FT4 and TSH reference intervals for the youngest age bracket also tended to be significantly wider than the intervals for other age groups. For FT4, there was little sex difference in reference intervals. There was a trend of narrower intervals for older populations. Furthermore, TSH intervals did not differ much between males and females, and the intervals also became narrower for older age groups. Also for TSH, it could be seen that values generally declined with age. These results are similar to those published for FT4 and TSH by the Canadian Laboratory Initiative [8] and therefore emphasize the validity of the Hoffmann approach [9]. In addition they suggest that the ethnicity of the populations studied is not an issue.
Table 1.
2.5th and 97.5th percentiles for free thyroxine (FT4).
| Ages | Males |
Females |
||||
|---|---|---|---|---|---|---|
| N | ng/dl | pmol/l | N | ng/dl | pmol/l | |
| <2 months | 189 | 0.78–1.83 | 10.06–23.61 | 160 | 0.69–1.85 | 8.90–23.87 |
| 2 to <12 months | 125 | 0.71–1.56 | 9.16–20.12 | 138 | 0.69–1.49 | 8.90–19.22 |
| 12 to <24 months | 190 | 0.82–1.32 | 10.58–17.03 | 202 | 0.73–1.41 | 9.42–18.19 |
| 2 to <5 years | 286 | 0.80–1.32 | 10.32–17.03 | 253 | 0.79–1.38 | 10.19–17.80 |
| 5 to <10 years | 516 | 0.78–1.29 | 10.06–16.64 | 655 | 0.77–1.32 | 9.93–17.03 |
| 10 to <15 years | 722 | 0.69–1.23 | 8.90–15.87 | 1003 | 0.66–1.22 | 8.51–15.74 |
| 15 to <20 years | 507 | 0.67–1.22 | 8.64–15.74 | 802 | 0.67–1.22 | 8.64–15.74 |
Table 2.
2.5th and 97.5th percentiles for thyroid-stimulating hormone.
| Ages | Males |
Females |
||
|---|---|---|---|---|
| N | mIU/l | N | mIU/l | |
| <2 months | 212 | 1.12–6.31 | 171 | 1.12–5.50 |
| 2 to <12 months | 138 | 0.96–4.90 | 152 | 1.12–4.47 |
| 12 to <24 months | 197 | 0.93–4.79 | 203 | 1.00–4.37 |
| 2 to <5 years | 297 | 0.83–4.37 | 264 | 0.85–4.07 |
| 5 to <10 years | 537 | 0.81–4.07 | 697 | 0.89–4.07 |
| 10 to <15 years | 746 | 0.79–3.98 | 1063 | 0.67–3.72 |
| 15 to <20 years | 547 | 0.55–3.55 | 877 | 0.47–3.63 |
Due to the TSH surge associated with delivery there is a rise in TSH levels in neonates. The US National Academy of Clinical Biochemistry recommended reference intervals for normal term infants at birth ranging from 1.3 to 19 μIU/ml [15]. Normal TSH intervals decrease to 0.6–10 μIU/ml at 10 weeks old, 0.4–7.0 μIU/ml at 14 months and gradually range between 0.4 and 4.0 μIU/ml during childhood and puberty to 18 years. These ranges are in agreement with the pediatric reference intervals we obtained for TSH (Table 2).
Patients with TSH values that are higher than the 97.5th percentiles should have low FT4’s. This should be true because TSH is secreted in the presence of low thyroid hormones. However, our data from the patients studied did not meet this expectation. Tables 3 and 4 show that the FT4 measured by direct analogue immunoassay on the Architect very frequently provides results which are not in clinical agreement with those found for TSH. Also Figs. 1 and 2 show the poor correlation found between the Architect FT4 and log TSH for both males (r=0.010) and females(r=0.050). These poor correlations with log TSH should be compared to the excellent correlation found for a pediatric population using ultrafiltration tandem mass spectrometry for the measurement of FT4 (r=0.90) [7,13].
Table 3.
TSH and FT4 correlations for abnormal values — males.
| Ages (n) | #of TSH values over 97.5th %tile |
# of associated FT4 values not under 2.5th %tile |
# of TSH values under 2.5th %tile |
# of associated FT4 values not over 97.5th %tile |
|---|---|---|---|---|
| <2 months (212) |
25 | 23 (92%) | 34 | 33 (97.1%) |
| 2 to <12 months (138) |
21 | 19 (90.5%) | 20 | 20 (100%) |
| 12 to <24 months (197) |
12 | 11 (91.7%) | 19 | 17 (89.5%) |
| 2 to <5 years (297) |
19 | 16 (84.2%) | 28 | 25 (89.3%) |
| 5 to <10 years (537) |
48 | 45 (93.8%) | 40 | 39 (97.5%) |
| 10 to <15 years (746) |
55 | 50 (90.9%) | 81 | 78 (96.3%) |
| 15 to <20 years (547) |
56 | 51 (91.1%) | 38 | 31 (81.6%) |
Table 4.
TSH and FT4 correlations for abnormal values — females.
| Ages (n) | #of TSH values over 97.5th %tile |
# of associated FT4 values not under 2.5th %tile |
# of TSH values under 2.5th %tile |
# of associated FT4 values not over 97.5th %tile |
|---|---|---|---|---|
| <2 months (171) |
12 | 12 (100%) | 19 | 19 (100.0%) |
| 2 to <12 months (152) |
24 | 23 (95.8%) | 21 | 20 (95.2%) |
| 12 to <24 months (203) |
16 | 16 (100%) | 20 | 18 (90.0%) |
| 2 to <5 years (264) |
30 | 30 (100%) | 34 | 31 (91.2%) |
| 5 to <10 years (697) |
66 | 62 (93.9%) | 49 | 41 (83.7%) |
| 10 to <15 years (1063) |
89 | 83 (93.3%) | 100 | 71 (71.0%) |
| 15 to <20 years (877) |
62 | 52 (83.9%) | 84 | 45 (53.6%) |
Fig. 1.

Correlation of FT4 vs. log TSH: Males y=−0.0066x+1.013, r=0.010, n=2654.
Fig. 2.
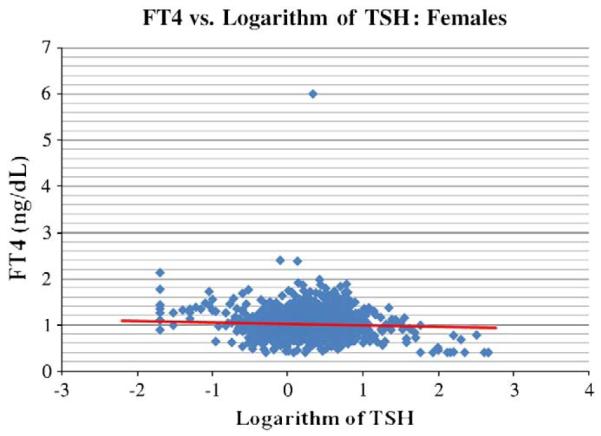
Correlation of FT4 vs. log TSH: Females y=−0.0305x+1.0241, r=0.050, n=3369.
In summary, this paper shows that FT4 on the Abbott Architect does frequently not give data clinically consistent with the TSH measurements made on the same platform. These data are further evidence that there are problems with the direct analogue method for FT4. Such problems are avoided when the FT4 is measured by ultrafiltration tandem mass spectrometry [7,13].We also provide reference intervals using the Hoffmann approach which are very similar to those published previously using the percentile approach thereby validating utility of the Hoffmann method in these cases. Our reference intervals were developed using a significantly larger sample size in accordance with IFCC recommendations [14], potentially making our findings more reliable.
Acknowledgements
Dr. O.P. Soldin is partially supported by grants 5U10HD047890-03 NIH=NICHD Obstetrics-Fetal Pharmacology Research Unit Network (OPRU) and by the Office of Research on Women’s Health. Dr. S.J. Soldin is partially supported by NIH GCRC grant M01-RR-020359. Ms. Nam and Mr. Cheng were Colaco scholarship summer students with Drs. Soldin.
References
- [1].Dayan CM. Interpretation of thyroid function tests. Lancet. 2001;357:619–24. doi: 10.1016/S0140-6736(00)04060-5. [DOI] [PubMed] [Google Scholar]
- [2].Lazar L, Frumkin RB, Battat E, Lebenthal Y, Phillip M, Meyerovitch J. Natural history of thyroid function tests over 5 years in a large pediatric cohort. J Clin Endocrinol Metab. 2009;94:1678–82. doi: 10.1210/jc.2008-2615. [DOI] [PubMed] [Google Scholar]
- [3].Keffer JH. Preanalytical considerations in testing thyroid function. Clin Chem. 1996;42:125–34. [PubMed] [Google Scholar]
- [4].Gu J, Soldin OP, Soldin SJ. Simultaneous quantification of free triiodothyronine and free thyroxine by isotope dilution tandem mass spectrometry. Clin Biochem. 2007;40:1386–91. doi: 10.1016/j.clinbiochem.2007.08.007. [DOI] [PubMed] [Google Scholar]
- [5].Jonklass J, Soldin SJ. Tandem mass spectrometry as a novel tool for elucidating pituitary–thyroid relationships. Thyroid. 2008;18:1303–11. doi: 10.1089/thy.2008.0155. [DOI] [PMC free article] [PubMed] [Google Scholar]
- [6].Jonklaas J, Nsouli-Maktabi H, Soldin SJ. Endogenous thyrotropin and triiodothyronine concentrations in individuals with thyroid cancer. Thyroid. 2008;18:943–52. doi: 10.1089/thy.2008.0061. [DOI] [PMC free article] [PubMed] [Google Scholar]
- [7].Jonklaas J, Kahric-Janicic N, Soldin OP, Soldin SJ. Correlations of free thyroid hormones measured by tandem mass spectrometry and immunoassay with thyroid-stimulating hormone across 4 patient populations. Clin Chem. 2009;55:1380–8. doi: 10.1373/clinchem.2008.118752. [DOI] [PMC free article] [PubMed] [Google Scholar]
- [8].Hoffmann RG. Statistics in the practice of medicine. JAMA. 1963;185:864–73. doi: 10.1001/jama.1963.03060110068020. [DOI] [PubMed] [Google Scholar]
- [9].Chan MK, Seiden-Long I, Aytekin M, et al. Canadian Laboratory Initiative on Pediatric Reference Interval Database (CALIPER): pediatric reference intervals for an integrated clinical chemistry and immunoassay analyzer, Abbott Architect ci8200. Clin Biochem. 2009;42:885–91. doi: 10.1016/j.clinbiochem.2009.01.014. [DOI] [PubMed] [Google Scholar]
- [10].Ghoshal AK, Soldin SJ. Evaluation of the Dade Behring Dimension RxL: integrated chemistry system-pediatric reference ranges. Clin Chim Acta. 2003;331:135–46. doi: 10.1016/s0009-8981(03)00114-1. [DOI] [PubMed] [Google Scholar]
- [11].Soldin SJ, Morales A, Albalos F, Lenherr S, Rifai N. Pediatric reference ranges on the Abbott IMx for FSH, LH, prolactin, TSH, T4, T3, free T3, T-uptake, IgE, and ferritin. Clin Biochem. 1995;28:603–66. doi: 10.1016/0009-9120(95)00038-5. [DOI] [PubMed] [Google Scholar]
- [12].Murthy JN, Hicks JM, Soldin SJ. Evaluation of the Technicon Immuno 1 random access analyzer and calculation of pediatric reference ranges for endocrine tests, T-uptake and ferritin. Clin Biochem. 1995;28:181–5. doi: 10.1016/0009-9120(94)00080-f. [DOI] [PubMed] [Google Scholar]
- [13].Soldin SJ, Soldin OP, Kahric-Janicic N, Jonklaas J. Reply. Clin Chem. 2009;55:2229. doi: 10.1373/clinchem.2008.118752. [DOI] [PMC free article] [PubMed] [Google Scholar]
- [14].Solberg HE. The IFCC recommendation on estimation of reference intervals. The RefVal Program. Clin Chem Lab Med. 2004;42:710–4. doi: 10.1515/CCLM.2004.121. [DOI] [PubMed] [Google Scholar]
- [15].Demers LM, Spencer CA. Laboratory medicine practice guidelines: laboratory support for the diagnosis and monitoring of thyroid disease. Clinical endocrinology. 2003;58:138–40. doi: 10.1046/j.1365-2265.2003.01681.x. [DOI] [PubMed] [Google Scholar]