Abstract
Background and Purpose
It is hypothesized that early DWI lesions accurately estimate the size of the irreversibly injured core and thresholded PWI lesions (Tmax > 6 seconds) approximate the volume of critically hypoperfused tissue. With incomplete reperfusion, the union of baseline DWI and post-treatment PWI is hypothesized to predict infarct volume.
Methods
This is a substudy of DEFUSE 2; all patients with technically adequate MRI scans at three time points were included. Baseline DWI and early follow-up PWI lesion volumes were determined by the RAPID software program. Final infarct volumes were assessed with Day 5 FLAIR and corrected for edema. Reperfusion was defined based on the reduction in PWI lesion volume between baseline and early follow-up MRI. DWI and PWI volumes were correlated with final infarct volumes.
Results
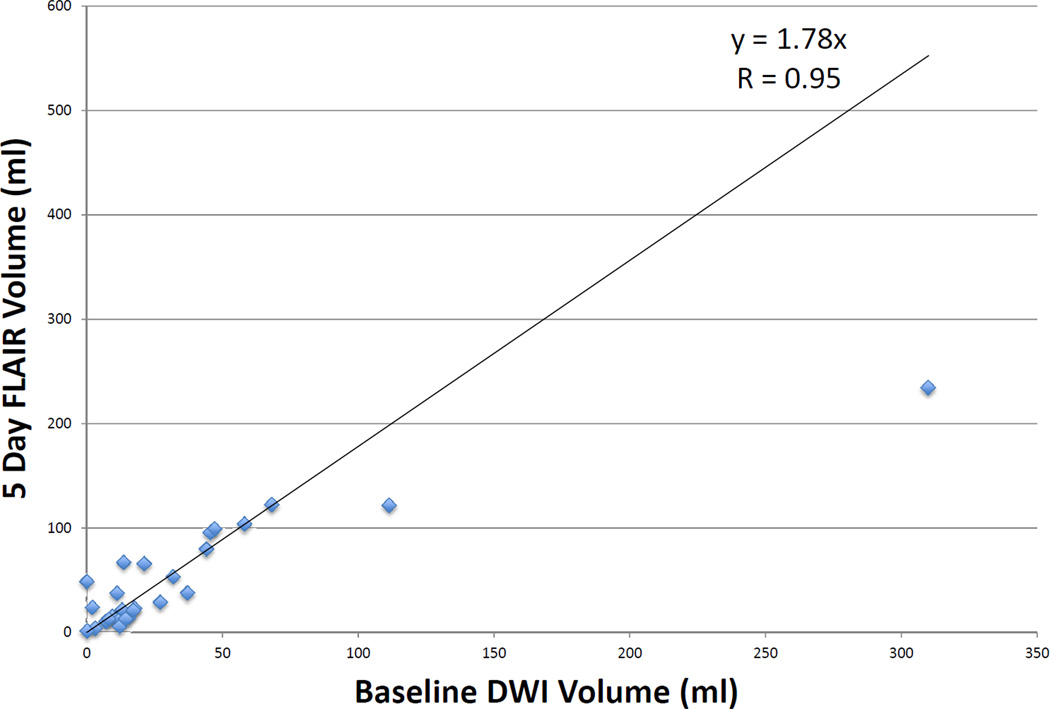
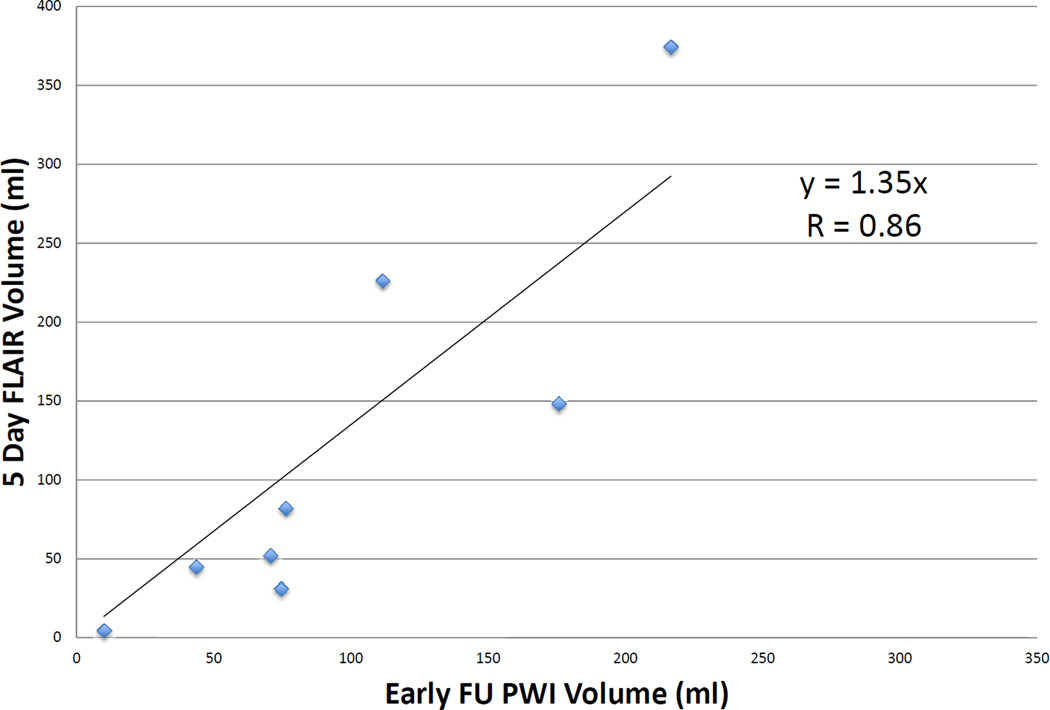
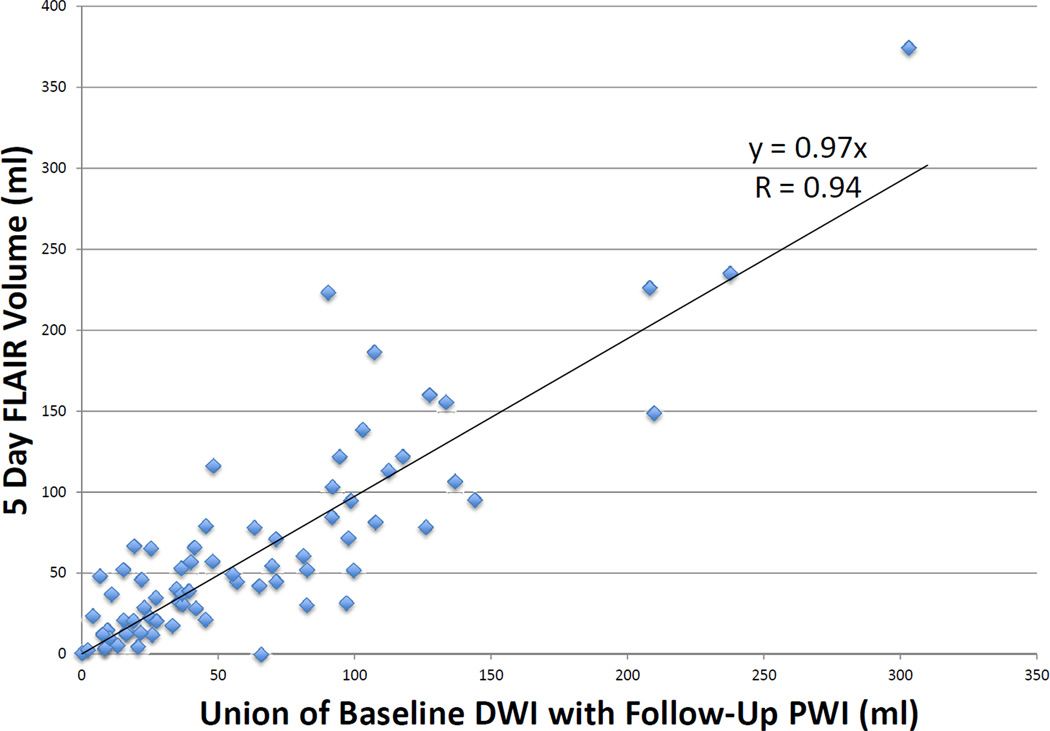
73 patients were eligible. 26 patients with >90% reperfusion show a high correlation between early DWI volume and final infarct volume (r = 0.95, p < 0.001). Nine patients with <10% reperfusion have a high correlation between baseline PWI (Tmax >6 sec) volume and final infarct volume (r = 0.86, p = 0.002). Using all 73 patients, the union of baseline DWI and early follow-up PWI is highly correlated with final infarct volume (r = 0.94, p < 0.001). The median absolute difference between observed and predicted final volume is 15 ml (IQR, 5.5–30.2).
Conclusions
Baseline DWI and early follow-up PWI (Tmax > 6 sec) volumes provide a reasonable approximation of final infarct volume following endovascular therapy.
Keywords: stroke, ischemic, diffusion-weighted imaging, perfusion imaging, magnetic resonance imaging, irreversible injury
Introduction
Early prediction of final infarct volume in ischemic stroke patients is challenging because ischemic lesions evolve over several days in response to numerous variables, including the timing and extent of reperfusion. Severe brain ischemia leads to an intracellular shift of water molecules, which dramatically reduces the normal diffusion of water molecules into and out of cells. Reduced diffusion can be visualized on diffusion weighted imaging (DWI) scans and quantified on apparent diffusion coefficient (ADC) maps. For patients who achieve early and complete reperfusion, it has been hypothesized that the diffusion weighted imaging (DWI) lesion volume obtained just prior to reperfusion can provide an accurate estimate of irreversibly injured tissue that will progress to permanent infarction. However, since increased signal on DWI begins to occur at cerebral blood flow values that are in the penumbral range, DWI lesions are potentially reversible; permanent reversal of DWI lesions has been documented in both experimental models and clinical series. The estimated frequency and volume of DWI reversibility has been controversial with recent large series reporting that this phenomenon is uncommon and typically only involves a small volume of tissue.1, 2, 3 Data from the DEFUSE study suggests that using an ADC threshold of approximately 600 can limit the degree of DWI reversibility.4
Perfusion weighted imaging (PWI) identifies hypoperfused tissue and has the potential to identify tissue that is likely to progress to infarction if timely reperfusion does not occur. An essential issue related to PWI is that an appropriate threshold must be applied to exclude ischemic tissue that is unlikely to become permanently injured even if reperfusion does not occur (i.e. benign oligemia). Recent studies, including DEFUSE and EPITHET, have used Tmax (time to maximum of tissue residue function) as the perfusion parameter of choice and found that a Tmax contrast arrival delay of greater than 4–6 seconds optimally predicts ischemic tissue destined to become infarcted in patients who do not reperfuse.5 Furthermore, a Tmax threshold in the range of 5–6 seconds has been shown to correspond well with penumbral cerebral blood flow values on positron emission tomography6 and Xenon CT.5
The accuracy of DWI and PWI for prediction of final infarct volume has not been well established. Multiple different definitions of non-viable vs. penumbral tissue have been proposed and most thresholds have not been prospectively evaluated.7 Based on post-hoc analyses of DEFUSE and EPITHET, the DEFUSE 2 trial chose an ADC threshold of < 600 as the optimal DWI threshold for identification of ischemic core and a Tmax > 6 sec threshold for identification of tissue that is likely to progress to infarction if early reperfusion does not occur. We performed a prospective assessment of these pre-specified DWI and PWI thresholds to determine the accuracy of early DWI and PWI lesion for predicting infarct volume. We hypothesized that the baseline DWI lesion would predict the size of the 5 day infarct in patients who experience complete reperfusion as documented on the follow-up PWI scan. We also predicted that tissue that had Tmax delays greater than 6 seconds on the baseline scan would go on to infarction if reperfusion did not occur. Furthermore, we hypothesized that the combination of the baseline DWI and the brain regions that remained PWI positive on the follow-up MRI would predict the 5 day infarct volume.
DEFUSE 2 represents a unique opportunity to examine the role of diffusion and perfusion weighted imaging to predict infarct volume because patients had an MRI performed just before, and shortly after, endovascular reperfusion. This provided a group of patients who had a variety of different degrees of reperfusion.
Methods
The methodology and main results of DEFUSE 2 have been published.8 In this NIH sponsored multicenter prospective cohort study, MRI scans were obtained prior to endovascular stroke therapy (femoral puncture within 12 hours of symptom onset). An MRI was repeated within 12 hours after completion of the procedure and again at 5 days after onset. For inclusion in this sub-study, subjects were required to have technically adequate MRI scans at all 3 time points.
Initial baseline and early follow-up PWI images were generated using the RAPID software.9 When needed, the DEFUSE 2 core lab corrected the automated volume assessments to adjust for overestimation or underestimation of lesion volume, using the software mipav.10 Five-day FLAIR volumes were outlined and subsequently corrected for cytotoxic edema utilizing a validated technique.11 The edema corrected 5 day FLAIR was defined as the “final infarct volume”. The initial DWI scan was co-registered with the early follow-up PWI (Tmax>6sec) scan, creating the union of the two volumes.
Reperfusion was defined based on the reduction in PWI lesion volume between baseline and early follow-up MRI. Percent reperfusion was calculated by taking the difference between baseline PWI (Tmax>6sec) volume and follow-up PWI (Tmax>6sec), divided by the baseline PWI (Tmax>6sec). Patients were then separated into a complete reperfusion group (>90%) and a no reperfusion group (<10%). Patients with 90–100% reperfusion were defined as having “complete reperfusion” and for these patients the initial DWI volume was compared with the final infarct volume. Patients with <10% reperfusion were considered to have “no reperfusion” and for these patients the final infarct volume was compared to the baseline PWI lesion. For all patients the union of baseline DWI with early follow-up PWI was compared to the final infarct volume.
Linear regression analysis was used to assess the relationship between predictor volumes and final infarct volumes. In particular, regression line slopes (using no-intercept regression) and correlation coefficients were estimated. We used robust regression with least trimmed squares estimation to account for outliers.12 Additionally, the median values were calculated for the difference between predicted final volumes and actual final volumes. Since an individual patient could have a final lesion volume that was larger or smaller than their predicted volume, the absolute value of the difference was also utilized to generate the median of the absolute value of the difference between predicted and observed volumes.
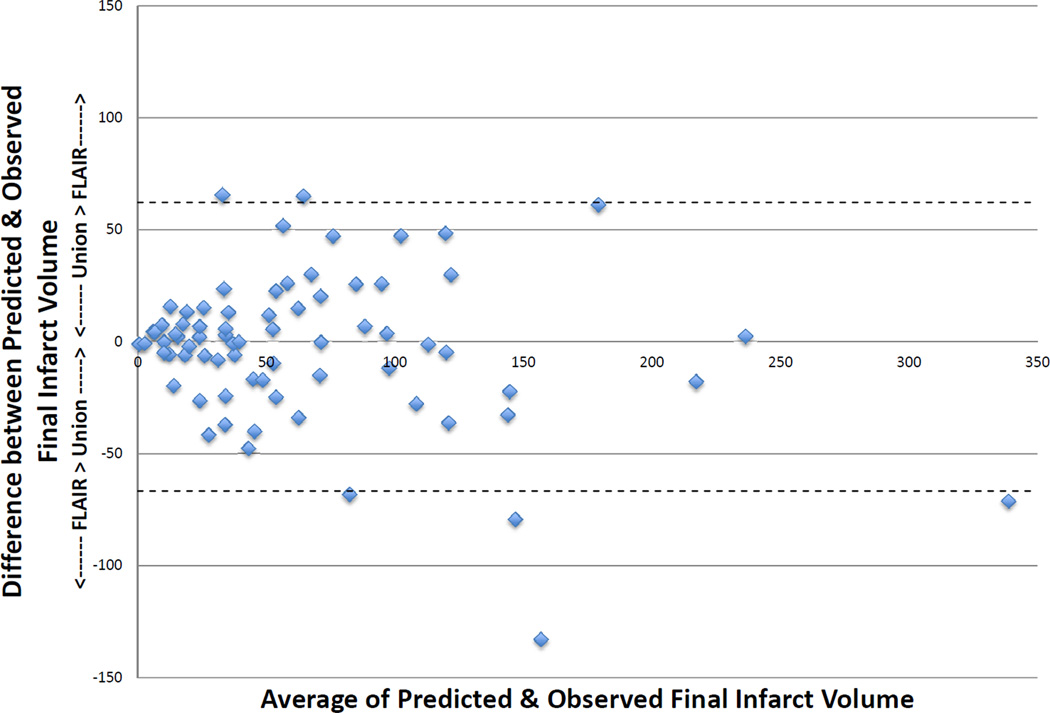
In addition to calculating a slope and correlation coefficient for all 3 analyses described above, a Bland-Altman analysis of agreement13 was created to examine if the discrepancy between the predictor volume (union of DWI and PWI) and the final infarct volume consistently varied towards overestimation or underestimation. Additionally, this allowed for analysis of the percentage of patients with an actual final infarct volume within 25 ml or 35 ml of predicted.
Results
One hundred and ten patients were in the endovascular cohort of DEUFSE 2 and of these 104 had a technically adequate baseline DWI and PWI. Five of these patients were excluded from analysis due to an inability to assess reperfusion status. Of the 99 patients analyzed, 5 did not have an early follow-up scan, 16 did not have a 5 day FLAIR, and 5 had longer than 18 hours between catheterization and follow-up MRI scan. Therefore, 73 patients were eligible for this analysis. The timing of the MRI scans and baseline characteristics of the patients are summarized in Table 1. The core lab made adjustments in the DWI lesion volume of 4 patients
Table 1.
Baseline characteristics, endovascular therapies employed and time between scans for patients analyzed.
| CHARACTERISTICS | |
| Age - mean (SD) | 62 (16) |
| Male sex - no. (%) | 38 (52%) |
| White ethnicity - no. (%) | 64 (88%) |
| COMORBIDITIES – no. (%) | |
| Previous MI | 7 (11%) |
| Hypertension | 46 (66%) |
| Atrial Fibrillation | 25 (36%) |
| Diabetes | 15 (21%) |
| Hyperlipidemia | 35 (49%) |
| VOLUMES – median (IQR), ml | |
| Baseline DWI | 16.0 (8.0–32.8) |
| Baseline PWI | 81.0 (58.4–117.0) |
| Early Follow-Up PWI | 19.3 (3.1–50.8) |
| 5 Day FLAIR (uncorrected) | 74.7 (25.1–137.6) |
| 5 Day FLAIR (corrected) | 48.4 (21.6–81.7) |
| DEVICES USED – no. (%) | |
| IV tPA pretreatment | 38 (52%) |
| Merci device | 36 (49%) |
| Penumbra system | 35 (48%) |
| Intra-arterial tPA | 32 (44%) |
| Other | 18 (25%) |
| TIME – median (IQR), hours | |
| Onset to MRI | 4.6 (2.7–6.8) |
| Onset to femoral puncture | 6.0 (3.8–8.3) |
| Baseline MRI to early follow-up MRI | 3.7 (2.0–6.6) |
| Onset to FLAIR | 119.7 (97.2–131.1) |
Twenty-seven patients had >90% reperfusion. The regression line between baseline DWI lesion and final infarct volumes (see Figure 1) in these patients had a slope of 1.78 (r = 0.95, p < 0.001) using robust regression. The median of the absolute values of the difference between the baseline DWI volume and the final infarct volume was 8.3 ml (IQR 2.4–45.0), and the median difference between baseline DWI volume and final volume was 5.62 (IQR 0.9–39.9). Only 2 patients had a final infarct volume that was more than 2 mL smaller than the baseline DWI. Nine patients had <10% reperfusion. The regression line between baseline PWI (Tmax >6sec) volume and final infarct volume (see Figure 2) had a slope of 1.35 (r = 0.86, p = 0.002). Among all 73 patients, the union of the co-registered baseline DWI with early follow-up PWI lesions was highly correlated with final volume (r = 0.94, p < 0.001) with a slope of 0.97 (see Figure 3) using robust regression. The median of the absolute values of the differences between observed and predicted final volume was 15 ml (IQR, 4.8–32.8), and the median difference between predicted and actual final infarct volume was −0.1 ml (IQR, −19.8–12.5) (see Figure 4). Sixty-seven percent of patients had a predicted volume that fell within 25 ml of their actual final infarct volume, and 79% were within 35 ml of their actual final lesion volume.
Figure 1.
Correlation of baseline DWI volume to final infarct FLAIR volume in patients with >90% reperfusion
Figure 2.
Correlation of early follow-up PWI volume to final infarct FLAIR volume in patients with <10% reperfusion
Figure 3.
Correlation of union of baseline DWI with early follow-up PWI volume to final infarct FLAIR volume in patients with partial reperfusion
Figure 4.
Bland Altman with 95% Limits of Agreement
Discussion
Identification of salvageable tissue remains an important consideration in the treatment of acute stroke and identification of patients who are likely to have continued infarct growth may have therapeutic implications.8 The key finding of this pre-specified analysis of DEFUSE 2 is that early DWI and PWI volumes are predictive of final infarct volume.
Early DWI volume appears to provide a reasonable surrogate of irreversibly-injured lesion core; patients who had complete reperfusion had final lesion volumes that were highly correlated to the baseline DWI volume. Final infarct volumes were virtually never smaller than the baseline DWI, suggesting that permanent DWI reversal is minimal following endovascular reperfusion. Final infarct was typically about 5.62 mL larger than the baseline DWI which could be a result of continued growth of the DWI lesion between the time of MRI and the time of reperfusion. The median time from MRI to femoral puncture was 0.7 hours (IQR 0.6–1.0), and the median time from start of the MRI to completion of the procedure was 1.5 hours (IQR 1.1–2.2).
PWI (Tmax > 6sec) provides a reasonable surrogate for critically-hypoperfused tissue that will likely die without successful reperfusion. In patients who did not reperfuse, baseline PWI was highly correlated with final infarct volume. However, the sample size for this analysis was very small due to the low rate of “no reperfusion” in DEFUSE 2.
More complete data regarding the accuracy of PWI (Tmax >6 s) for identification of tissue that is likely to go on to infarction is provided by the analysis of the union of baseline DWI and early follow-up PWI for prediction of final infarct volume (n=73). Our hypothesis was that the baseline DWI represents the ischemic core and the follow-up PWI represents the tissue that was not salvaged by reperfusion; thus, the union of these two volumes should predict the final infarct. We found a strong correlation with a slope of 1, indicating an accurate estimation of the final infract. A slope significantly greater than one would indicate that the PWI volume is likely to underestimate critical hypoperfusion while a slope less than one would suggest underestimation. Overestimation of critical hypoperfusion has been a common limitation of PWI5 and is the reason why a more stringent Tmax threshold (>6 s) was chosen for DEFUSE 2. These data provide prospective validation that Tmax > 6 s does not consistently over- or under-estimate the region of critically hypoperfused tissue.
The overall accuracy for predicting final infarct volume was reasonable; the median absolute difference between predicated and actual infarct volume was 15 ml. Brain ischemia is a dynamic process, which may be influenced by numerous unforeseen events such a hemodynamic factors, metabolic changes and ongoing thromboemboism and hemorrhage. Therefore, it is not unexpected that imaging assessments at one or two early time points are not able to precisely predict infarct volume in all patients.
This study has a number of limitations. Multiple techniques for endovascular therapy were employed in this study; this additional variable could have impacted the time between baseline MRI and revascularization and the degree of reperfusion obtained. The time between symptom onset and the baseline and follow-up MRI was also variable. Final infarct volume was estimated from MRI scans obtained 5 days after symptom onset. Automated DWI and PWI volumes required manual correction in some cases.
These results have implications for future clinical trials. As permanent reversal of early DWI lesions (even following complete reperfusion) appears to be very rare, DWI reversal does not appear to be a realistic endpoint for clinical trials. The fact that the Tmax threshold of >6 seconds neither consistently over- or under-estimated infarct volume suggests that this threshold is appropriate for use in future trials. However, since the Tmax >6 volume did not accurately predicted infarct volume in a number of individual patients, further efforts to identify additional factors that can improve infarct volume prediction should be explored. For example, parameters that may reflect the degree of collateral circulation, such as cerebral blood volume measurements, are currently being explored in the DEFUSE 2 data set.
In summary, the union of the early DWI (ADC <600) and follow-up PWI (Tmax > 6 sec) volumes provides a reasonable approximation of final infarct volume following endovascular therapy. Automated DWI and PWI volumes can be useful for predicting which acute stroke patients are most likely to have continued infarct growth.
Acknowledgments
Funding
The study was funded by grants from the National Institute for Neurological Disorders and Stroke (NINDS) [R01 NS03932505 (G. Albers), K23 NS051372 (M. Lansberg) and the Stanford Medical Scholars Fellowship Program.
Footnotes
Publisher's Disclaimer: This is a PDF file of an unedited manuscript that has been accepted for publication. As a service to our customers we are providing this early version of the manuscript. The manuscript will undergo copyediting, typesetting, and review of the resulting proof before it is published in its final citable form. Please note that during the production process errors may be discovered which could affect the content, and all legal disclaimers that apply to the journal pertain.
Predicted final infarct volume is the union of the baseline DWI and the follow-up PWI volumes. Observed final infarct volume is the corrected 5 day FLAIR volume. Patients with a positive difference have a predicted volume that is greater than observed volume; patients with a negative difference have a predicted volume that is less than the observed volume.
Disclosures
G. Albers has equity interest in iSchemaView and has worked as a consultant for Covidien and Stryker. R Bammer has equity interest in iSchemaView. G. Zaharchuk receives modest research funding support from GE Healthcare. All other authors report no conflicts of interest.
References
- 1.Albers GW, Thijs VN, Wechsler L, Kemp S, Schlaug G, Skalabrin E, et al. Magnetic resonance imaging profiles predict clinical response to early reperfusion: the diffusion and perfusion imaging evaluation for understanding stroke evolution (DEFUSE) study. Annals of Neurology. 2006;60:508–517. doi: 10.1002/ana.20976. [DOI] [PubMed] [Google Scholar]
- 2.Campbell BC, Purushotham A, Christensen S, Desmond PM, Nagakane Y, Parsons MW, et al. The infarct core is well represented by the acute diffusion lesion: sustained reversal is infrequent. Journal of Cerebral Blood Flow & Metabolim. 2012 Jan;32:50–56. doi: 10.1038/jcbfm.2011.102. [DOI] [PMC free article] [PubMed] [Google Scholar]
- 3.Lansberg MG, Lee J, Christensen S, Straka M, De Silva DA, Mlynash M, et al. RAPID automated patient selection for reperfusion therapy: a pooled analysis of the Echoplanar Imaging Thrombolytic Evaluation Trial (EPITHET) and the Diffusion and Perfusion Imaging Evaluation for Understanding Stroke Evolution (DEFUSE) Study. Stroke. 2011;42:1608–1614. doi: 10.1161/STROKEAHA.110.609008. [DOI] [PMC free article] [PubMed] [Google Scholar]
- 4.Purushotham A, Campbell BCV, Straka M, Mlynash M, Olivot JM, Bammer R, et al. Apparent Diffusion Coefficient Threshold for Delineation of Ischemic Core. International Journal of Stroke. doi: 10.1111/ijs.12068. In press. [DOI] [PMC free article] [PubMed] [Google Scholar]
- 5.Olivot JM, Mlynash M, Thijs VN, Kemp S, Lansberg MG, Wechsler L, et al. Optimal Tmax threshold for predicting penumbral tissue in acute stroke. Stroke. 2009;40:469–475. doi: 10.1161/STROKEAHA.108.526954. [DOI] [PMC free article] [PubMed] [Google Scholar]
- 6.Zaro-Weber O, Moeller-Hartmann W, Heiss -D, Sobesky J. Maps of maximum and time to peak for mismatch definition in clinical stroke studies validated with positron emission tomography. Stroke. 2010;41:2817–2821. doi: 10.1161/STROKEAHA.110.594432. [DOI] [PubMed] [Google Scholar]
- 7.Dani KA, Thomas RG, Chappell FM, Shuler K, MacLeod MJ, Muir KW, et al. Translational Medicine Research Collaboration Multicentre Acute Stroke Imaging Study. Ann Neurol. 2011 Sep;:70. doi: 10.1161/STROKEAHA.111.629923. [DOI] [PubMed] [Google Scholar]
- 8.Lansberg MG, Straka M, Kemp S, Mlynash M, Wechsler LR, Jovin TG, et al. MRI profile and response to endovascular reperfusion after stroke (DEFUSE 2): a prospective cohort study. The Lancet Neurology. 11:860–867. doi: 10.1016/S1474-4422(12)70203-X. [DOI] [PMC free article] [PubMed] [Google Scholar]
- 9.Straka M, Albers GW, Bammer R. Real-time diffusion-perfusion mismatch analysis in acute stroke. Journal of Magnetic Resonance Imaging. 2010;32:1024–1037. doi: 10.1002/jmri.22338. [DOI] [PMC free article] [PubMed] [Google Scholar]
- 10.McAuliffe MJ, Lalonde FM, McGarry D, Gandler W, Csaky K, Trus BL. Medical Image Processing, Analysis & Visualization In Clinical Research. IEEE Computer-Based Medical Systems (CBMS) 2001:381–386. [Google Scholar]
- 11.Tipirneni A, Straka M, Lansberg MG, Mlynash M, Bammer R, Parsons MW, et al. A Novel Method for Quantification of Brain Edema in Ischemic Stroke. Stroke. 2012;43:A50. [Google Scholar]
- 12.Rousseeuw PJ. SAS procedure ‘robustreg’, "Least Median of Squares Regression". Journal of the American Statistical Association. 1984;79:871–880. [Google Scholar]
- 13.Bland JM, Altman DG. Statistical methods for assessing agreement between two methods of clinical measurement. The Lancet. 1986;327:307–310. [PubMed] [Google Scholar]
- 14.del Zoppo GJ, Sharp FR, Heis WD, Albers GW. Heterogeneity in the penumbra. Journal of Cerebral Blood Flow & Metabolism. 2011;31:1836–1851. doi: 10.1038/jcbfm.2011.93. [DOI] [PMC free article] [PubMed] [Google Scholar]
- 15.Donnan GA, Baron JC, Ma H, Davis DM. Penumbral selection of patients for trials of acute stroke therapy. The Lancet Neurology. 2009;8:261–269. doi: 10.1016/S1474-4422(09)70041-9. [DOI] [PubMed] [Google Scholar]
- 16.Grigoryan M, Tung CE, Albers GW. Role of Diffusion and Perfusion MRI in Selecting Patients for Reperfusion Therapies. Neuroimaging Clinics of North America. 2011;21:247–257. ix–x. doi: 10.1016/j.nic.2011.01.002. [DOI] [PubMed] [Google Scholar]
- 17.Hatazawa J, Shimosegawa E, Toyoshima H, Ardekani B, Suzuki A, Okudera T, et al. Cerebral Blood Volume in Acute Brain Infarction: A Combined Study with Dynamic Susceptibility. Stroke. 1999;30:800–806. doi: 10.1161/01.str.30.4.800. [DOI] [PubMed] [Google Scholar]
- 18.Maas MB, Lev MH, Ay H, Singhal AB, Greer DM, Smith WS, et al. Collateral vessels on CT Angiography Predict Outcome in Acute Ischemic Stroke. Stroke. 2009;40:3001–3005. doi: 10.1161/STROKEAHA.109.552513. [DOI] [PMC free article] [PubMed] [Google Scholar]
- 19.Mlynash M, Lansberg MG, De Silva DA, Lee J, Christensen S, Straka M, et al. Refining the definition of the malignant profile: insights from the DEFUSE-EPITHET pooled data set. Stroke. 2011;42:1270–1275. doi: 10.1161/STROKEAHA.110.601609. [DOI] [PMC free article] [PubMed] [Google Scholar]
- 20.Ogata T, Nagakane Y, Christensen S, Ma H, Campbell BC, Churilov L, et al. A topographic study of the evolution of the MR DWI/PWI mismatch pattern and its clinical impact: a study by the EPITHET and DEFUSE Investigators. Stroke. 2011;42:1596–1601. doi: 10.1161/STROKEAHA.110.609016. [DOI] [PubMed] [Google Scholar]
- 21.Olivot JM, Albers GW. Diffusion-perfusion MRI for triaging transient ischemic attack and acute cerebrovascular syndromes. Current Opinion in Neurology. 2011;24:44–49. doi: 10.1097/WCO.0b013e328341f8a5. [DOI] [PubMed] [Google Scholar]


