

Abstract
Objective
To examine the association between apolipoprotein E (APOE) gene variants and waist circumference, fasting plasma glucose, serum insulin, serum high-density lipoprotein cholesterol, and serum triglycerides, all metabolic traits known as cardiovascular disease (CVD) endophenotypes, in a population of stressed individuals and controls. Abdominal obesity, insulin resistance, elevated serum lipid concentration, and APOE polymorphisms have been associated with CVD risk. Current evidence supports the hypothesis that gene-environment interactions modulate serum lipid concentrations.
Methods
The association between rs769450, rs405509, rs439401, and metabolic traits were analyzed in a U.S. sample of 126 white caregivers of a relative with Alzheimer's disease or other major dementia and 122 white controls. The associations were analyzed, using multivariate analysis of variance adjusted for age, sex, and medications.
Results
Significant multivariate interactions were found, using both additive (p = .009) and dominant (p = .047) models between rs439401 (C/T) and caregiver stress in relation to a profile of metabolic variables. Univariate analyses found the TT genotype to be associated with more adverse levels of waist circumference (interaction, p = .026), triglycerides (interaction, p = .001) and high-density lipoprotein cholesterol (interaction, p = .001) among caregivers but with a more favorable profile of these endophenotypes among controls. There were no significant associations or interactions involving the other two single nucleotide polymorphisms.
Conclusion
The APOE rs439401 TT genotype is associated with an adverse metabolic profile among chronically stressed individuals compared with individuals not similarly stressed in whom a more favorable profile is expressed. Confirmation of these results in further research would indicate that the TT genotype can be used to identify persons at high risk for CVD when subjected to chronic stress.
Keywords: apolipoprotein E, obesity, metabolic traits, stress, epidemiology, gene-environment interaction
INTRODUCTION
Molecular genetic studies attempting to find genes that cause complex multidetermined disorders like alcoholism, schizophrenia, Type 2 diabetes (T2D), and cardiovascular disease (CVD) have had limited success because the development of the disease occurs in persons with varying combinations, or clusters, of vulnerability traits—endophenotypes (1)—whose expression is more proximally affected by genes acting either directly or via interaction with environmental factors (2–4). Molecular genetic studies are more likely to be successful, therefore, in identifying genetic variation that affects expression of endophenotypes, both single ones and clusters, than they have been when the entity under study is the more complexly determined disease phenotype. Abdominal obesity, insulin resistance, and an adverse serum lipid profile make up one such cluster of endophenotypes that has been associated with increased T2D and CVD risk (5,6).
The gene that encodes apolipoprotein E (APOE) is an attractive candidate to test for effects on the expression of these T2D and CVD metabolic endophenotypes. APOE is a structural constituent of several atherogenic lipoprotein particles, such as triglyceride-rich chylomicrons and high-density lipoproteins (HDLs), and plays a key role in the metabolisms of cholesterol and triglyceride by serving as a receptor-binding ligand mediating the clearance of chylomicron and remnants of very-low-density lipoprotein cholesterol from serum (7). There is consensus that APOE (chromosome 19q13.2) plays an important role in determining interindividual differences in lipid metabolism (7,8). Three common isoforms, E2, E3, and E4, which are encoded by three alleles, ε2, ε3, ε4, defined by two variable sites in exon 4 of the APOE gene have been studied extensively, demonstrating that ε4 is associated with elevated low-density lipoprotein, triglycerides, and CVD (9,10). However, results from several studies (11,12) suggested that the 5′ regulatory region of APOE has a larger domain of biological functionality than the nonsynonymous variations in exon 4 and that variation in the 5′ promoter region has pleiotropic effects on lipid metabolism. APOE seems to have single nucleotide polymorphisms (SNPs) that may be important in affecting dyslipidemia independently of ε4 (11), but these variations have not been considered in the large numbers of studies that have focused only on variations in exon 4 (11,12). This conclusion comes from another study (13) that observed an association between an APOE SNP and percentage of fat mass assessed by DXA scan.
In addition to evaluating altered lipid metabolism due to variations in APOE as a potential mediator of increased CVD risk (7), several association studies have examined insulin resistance and diabetes, as they are also major predictors of CVD (8) but with less consistent results (14). One study (15) found that APOE ε4 carriers have increased glucose and insulin levels, but only in persons who are obese, and other studies (10,16) found that obesity enhanced the impact of ε4 on higher triglyceride levels. These findings suggested that obesity may moderate effects of APOE variants on CVD endophenotypes.
Another potential moderator of APOE effects on CVD endophenotypes is psychosocial stress. Both metabolic disturbances and blood pressure reactivity have been associated with the deleterious effects of stress (8,17). Humans respond to stress through activation of the central sympathetic nervous system and the hypothalamic-pituitary-adrenal axis. Secretion of cortisol is elevated under stress and binds to glucocorticoid receptors, which have a particularly high density in visceral adipose tissue. Cortisol also inhibits lipid mobilization in the presence of insulin. These activities lead to triglyceride accumulation and retention in visceral adipose tissue (18). This means that stress-induced increases in levels of cortisol are followed by increased abdominal fat accumulation. Elevated activity of the hypothalamic-pituitary-adrenal axis has been related to perceived stress and is related to insulin resistance (18). There is also consensus that the insulin resistance caused by stress will be followed by compensatory hyperinsulinemia, which in turn creates dyslipidemia (18).
Studying a disease with multifactorial etiology is rather complex due to multiple genetic and environmental factors that may influence disease risk due to an adaptive system of interactions, each with possible subtle effects (19,20). Nevertheless, it has been recognized that examination of associations between psychosocial factors, such as living under chronic stress and susceptibility for life-style-related diseases, and health outcomes must go beyond the simple examination of main effects hypotheses (21). We believe that altered metabolism under stress needs to be taken into consideration when studying the genetic epidemiology of metabolic quantitative traits that contribute to disease development.
The aim of the present study, therefore, was to assess the impact of a major chronic life stressor (caregiving for a relative with Alzheimer's disease) (22–24) on the associations between a panel of APOE SNPs and metabolic quantitative traits in a sample of caregivers and controls. We hypothesized that any associations of SNP genotypes with an adverse metabolic profile would be more pronounced in the chronically stressed caregivers compared with controls.
MATERIALS AND METHODS
Study Population
The study was conducted at Duke University Medical Center, where participants were enrolled in 2001 to 2004 to be part of a study that aimed to examine the underlying biological and behavioral mechanisms, whereby stressful social and physical environments lead to health disparities. Caregivers, defined as having the primary responsibility for care of a spouse or relative (96% of whom were parents) with diagnosed Alzheimer's disease or other major dementia, were recruited using flyers, advertisements in the local media, and community outreach efforts conducted under the auspices of a Community Outreach and Education Program. Controls were identified by asking caregivers to nominate two to five friends who lived in their neighborhood and were similar to them with respect to demographic factors (e.g., gender, age, and race). Informed consent was obtained from all subjects, using a form approved by the Duke University Medical Center Institutional Review Board.
Data were collected in two venues; a questionnaire battery was given to participants during a home visit by a nurse and returned on their visit to the General Clinical Research Center at Duke University Medical Center. The home assessment was scheduled during the same week as the physical examination. During the clinic visit, participants received a general physical examination, and a blood sample was drawn for assessment of biological parameters. In total, 344 participants were recruited and genotyped, consisting of 175 caregivers (n = 45 men, 130 women; 126 whites, 49 blacks) and 169 controls (n = 40 men, 129 women; 122 whites, 47 blacks). Te present report includes results only from the whites.
Measurements
Molecular Genetic Analyses
Genomic deoxyribonucleic acid was extracted for genotyping by standard procedure (Puregene D-50K isolation kit, Gentra, Minneapolis, Minnesota) from fresh or frozen samples of peripheral blood collected from the participants. Because we examined multiple polymorphisms, we used Haploview (25) to assist us in identifying “haplotype tagging” SNPs, such that we reduced the repetitive information coming from SNPs within the same haplotype block, selecting markers with r2 <.64 and minor allele frequency of at least 0.07 in whites, as this racial group comprised the majority of our study population. Four APOE polymorphisms (rs769450, rs405509, rs439401, rs449647) were identified from NCBI's Single Nucleotide Polymorphism database (http://www.ncbi.nlm.nih.gov/SNP). The choice of the four SNPs that we genotyped was based on the HapMap data available at that time (2005); a larger set of SNPs would be selected now, given the current state of knowledge. The three major alleles of the polymorphic APOE ε (E2, E3, and E4) were also genotyped based on allele combinations at SNP + 3937/rs429358 and SNP + 4075/rs7412. All genotyping was accomplished, using the ABI 7900 Taqman system (Applied Biosystems, Carlsbad, California). Each marker was required to achieve 95% efficiency (at least 95% of the genotypes could be scored with certainty). Additionally, a series of blinded QC samples were included for each marker and required to match 100% for the marker to be considered for statistical analysis. For analysis purposes, all genotypes were categorized and are presented as wild type (homozygous for major allele), heterozygote, and homozygote (homozygous for minor allele). The polymorphisms were in low linkage disequilibrium (LD) with each other, except for rs769450 and rs405509, which were in moderate LD (r2 = .54). In particular, none of the SNPs were in high LD with E4 (all r2 <.23). Due to a low number of heterozygous and homozygous participants for the minor allele, rs449647 and APOE ε4 have not been included in the present analyses. Genotype distributions in controls obeyed Hardy-Weinberg equilibrium (p = .99 for rs769450, p = .67 for rs405509, and p = .91 for rs439401).
Metabolic Trait Measurements
Fasting plasma glucose (mg/dL), serum insulin (μU/mL), serum HDL cholesterol (mg/dL), and serum triglyceride levels (mg/dL) in all participants were assayed by the Centers for disease Control and Prevention-approved laboratory facility at LabCorp in Burlington, North Carolina, and the homeostatic model of insulin resistance (HOMA-IR) was computed (26). Waist circumference was measured by a nurse to the nearest 0.5 cm with the subjects standing, using a nonexpendable linen tape measure, according to the American Heart Association recommendations.
Stress
Due to the sampling design of caregivers and controls, caregivers are defined as chronically stressed individuals (22–24). We have previously reported (27) that, compared with the controls, the caregivers in this study have significantly more adverse (all p < .01) levels of depressive symptoms, hopelessness, anxiety, perceived stress, social support, and sleep quality. When these analyses were run comparing caregivers with controls among the white participants only, whose data are the focus of this study, the caregivers' scores were even more strongly (all p < .001) adverse.
Statistical Methods
Multivariate analysis of variance (MANOVA) was conducted to examine the effects of each polymorphism, stress condition (caregiver versus control), and their interaction in determining an altered profile of metabolic variables—waist circumference, fasting glucose and insulin, HOMA-IR, HDL cholesterol, and triglycerides. Because there was no a priori reason to assume a dominance pattern of allele effects, we ran the MANOVAs, using both additive and dominant models. The MANOVA adjusts for the presence of multiple tests and correlations among the dependent variables. All analyses were adjusted for age as a continuous variable, sex, and use of medications (coded as 0 = no; 1 = yes) commonly prescribed to treat diabetes or hypertension or to lower blood lipids. Serum insulin and triglycerides and HOMA were log-transformed to achieve a more normal distribution. Due to racial differences in minor allele frequencies and to mitigate confounding by population stratification, the analyses were run separately in blacks and whites. Statistically significant MANOVA results were found only in the whites, which could be due to the lower frequency among blacks of the minor allele (T) for the only APOE SNP (rs439401) with a significant MANOVA. In this report, therefore, only the results in the whites—with complete metabolic and medication data on 122 of126 caregivers and 119 of 122 controls—are presented. A p < .05 was considered statistically significant. Analyses were performed, using SAS statistical procedures (version 9.1, SAS Institute Inc., Cary, North Carolina).
RESULTS
Descriptive Characteristics
The genotype frequencies and minor allele frequencies of the APOE polymorphisms among white caregivers and controls are given in Table 1. Minor allele frequencies did not differ significantly between caregivers and controls for any of the SNPs tested. In Table 2, mean values of age, metabolic traits, medication use, and diabetes diagnosis (based on interview by nurse coordinator) are given for caregivers and controls. Only age was significantly higher in caregivers (p = .052), but the range was similar (24–84 for caregivers and 22–89 for controls). Neither education (p = .58) nor income (p = .38) differed between the two groups.
TABLE 1.
Genotype Distribution and Minor Allele Frequencies for the Apolipoprotein E Single Nucleotide Polymorphisms in Whites
| dbSNP | SNPa | Genotype |
|||||||
|---|---|---|---|---|---|---|---|---|---|
| Caregivers |
Controls |
||||||||
| Wt | He | Ho | MAF | Wt | He | Ho | MAF | ||
| Rs769450 | A/G | 22 | 65 | 37 | 0.56 | 16 | 61 | 41 | 0.60 |
| Rs405509 | A/C | 25 | 69 | 31 | 0.54 | 25 | 69 | 27 | 0.51 |
| Rs439401 | C/T | 56 | 54 | 16 | 0.34 | 37 | 68 | 16 | 0.41 |
The minor alleles are shown in boldface type.
dbSNP = single nucleotide polymorphism database; SNP = single nucleotide polymorphisms; Wt = wild type; He = heterozygote; Ho = homozygote; MAF = minor allele frequency.
TABLE 2.
Study Population Characteristic by Stress Status in Whites
| Caregivers n = 122a | Controls n = 119a | |
|---|---|---|
| Age (yrs) | 63.2 ± 13.1 | 60.0 ± 14.4b |
| Waist circumference (cm) | 89.3 ± 14.7 | 89.6 ± 15.0 |
| Serum glucose (mg/dL) | 91.0 ± 18.8 | 89.3 ± 16.0 |
| Serum insulin (μU/mL) | 16.0 ± 20.5 | 15.9 ± 21.2 |
| HOMA-IR | 69.9 ± 127.6 | 67.5 ± 118.4 |
| Serum HDL cholesterol (mg/dL) | 56.7 ± 15.9 | 55.6 ± 14.9 |
| Serum triglycerides (mg/dL) | 122.0 ± 68.7 | 125.4 ± 84.7 |
| Females/males (n) | 91/35 | 91/31 |
| Diabetes medications (n) | 6 | 6 |
| Antihypertensive medications (n) | 40 | 34 |
| Lipid-lowering medications (n) | 21 | 17 |
| Diabetes diagnosed (n) | 2 | 2 |
All values are given as mean ± standard deviation except for gender, medications, and diabetes diagnosis, which are given in actual numbers.
Numbers are the same for all metabolic and medication variables; diabetes diagnosis data available for 121 caregivers and 114 controls.
p = .052; all other comparisons were p > .05.
HOMA-IR = homeostatic model of insulin resistance; HDL = high-density lipoprotein.
Regression Analyses
The multivariate analyses of variances did not reveal significant main effects for rs769450, rs405509, and rs439401 or stress group status. As shown in Table 3, however, there were significant multivariate interactions between rs439401 and stress group status, using both additive and dominant models, with the dominant model being more robust. There were no significant multivariate interactions involving rs769450 or rs405509. Based on these significant multivariate effects, we next conducted univariate analysis of variance of each metabolic component separately for rs439401. As shown in Table 3, significant interactions for the univariate analyses of variances between rs439401 and stress group status, using both additive and dominant models, were observed for waist circumference (Fig. 1), serum HDL cholesterol (Fig. 2), and serum triglycerides (Fig. 3). No significant univariate associations were seen for serum glucose, insulin, or HOMA-IR.
TABLE 3.
Overall MANOVA Tests for Gene (rs439401) × Group (Caregiver/Control) Effects on Metabolic Variables, With Univariate Tests of the Gene × Group Interaction for Each Variable
| Metabolic Variable | Gene × Groupa (Additive Model) F (df) | p | Gene × Groupa (Dominant Model) F (df) | p |
|---|---|---|---|---|
| MANOVA (Wilk's Lambda) | 1.83 (12 of 450) | .041 | 2.93 (6/227) | .009 |
| Waist circumference | 3.10 (2 of 230) | .047 | 5.00 (1 of 232) | .026 |
| Fasting glucose | 0.67 (2 of 230) | .515 | 0.03 (1 of 232) | .86 |
| Fasting insulin (log) | 1.67 (2 of 230) | .19 | 1.18 (1 of 232) | .28 |
| HOMA-IR (log) | 1.90 (2 of 230) | .15 | 1.08 (1 of 232) | .30 |
| Fasting HDL cholesterol | 5.68 (2 of 230) | .001 | 11.14 (1 of 232) | .001 |
| Fasting triglycerides (log) | 5.35 (2 of 230) | .005 | 10.84 (1 of 232) | .001 |
Covariates: age, gender, diabetes medications, hypertension medications, lipid-lowering medications.
MANOVA = multivariate analysis of variance; HOMA-IR = homeostatic model of insulin resistance; HDL = high-density lipoprotein.
Figure 1.

The rs439401 genotype in relation to waist circumference (cm, adjusted means) in caregivers and controls, dominant and additive models. APOE = apolipoprotein E.
Figure 2.

The rs439401 genotype in relation to serum high-density lipoprotein (HDL) cholesterol (mg/dL, adjusted means) in caregivers and controls, dominant and additive models. APOE = apolipoprotein E.
Figure 3.
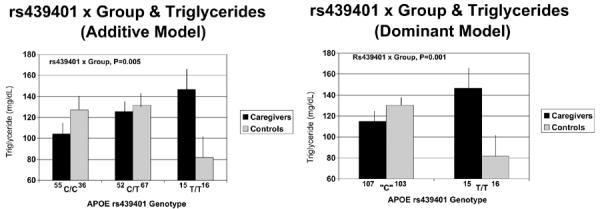
The rs439401 genotype in relation to serum triglyceride levels in caregivers and controls, dominant and additive models. Levels are expressed in mg/dL based on actual triglyceride levels, but all statistical analyses, including pairwise comparisons, were done using log-transformed triglyceride values adjusted for covariates. APOE = apolipoprotein E.
These interactions all followed a similar pattern, whereby C carriers in both groups did not differ from each other, whereas those in the stressed caregiver group with the TT genotype exhibited a more adverse metabolic profile than other groups, in contrast to controls with the TT genotype who exhibited a more positive profile. This pattern was clearest for serum HDL cholesterol levels (Fig. 2), where pairwise comparisons using t tests adjusted for covariates showed that caregivers with the TT genotype had lower levels than caregiver C carriers (p = .006), TT controls (p = .005), and control C carriers (p = .07), whereas controls with the TT genotype had higher levels than the other three groups (p = .05–.07). A similar pattern was seen for serum triglyceride levels (Fig. 3), where caregivers with the TT genotype had higher levels than controls with the TT genotype (p = .004), whose triglyceride levels were also lower than control C carriers (p = .002). Controls with the TT genotype had a smaller waist circumference (Fig. 1) than C carrier controls (p = .005) and caregiver C carriers (p = .03) and those with the TT genotype (p = .06).
DISCUSSION
The most important finding of the present study is that, in whites, chronic psychosocial stress moderates the association of the TT genotype of APOE SNP rs439401 with quantitative metabolic traits. Multivariate analysis found that rs439401 is associated with a cluster of metabolic traits in a way that differs as a function of exposure to a major chronic life stressor, being the primary caregiver for a relative with Alzheimer's disease or other major dementia. The pattern of association was consistent across several metabolic variables: caregivers with the TT genotype exhibited a more adverse profile of metabolic traits, with lower HDL cholesterol and higher triglyceride levels than caregiver C carriers and all controls; in marked contrast, controls with the TT genotype had a more favorable profile, with higher HDL cholesterol and lower triglyceride levels than control C carriers and all caregivers. Controls with the TT genotype also had a smaller waist circumference that all other groups. There have been previous reports that stress moderates, for example, the association of the serotonin transporter promoter polymorphism (5HTTLPR) with increased prevalence of depression (28) and poorer sleep quality (29). To our knowledge, the current findings are the first report of psychosocial stress moderation of an association between a gene that affects lipid and glucose metabolism, APOE, and a cluster of metabolic quantitative traits.
As with all association studies, there is the potential that the present finding is a false-positive. Concerns related to intra- and interindividual factors, such as inadequate sample sizes, diverse study populations, race, sex, and environmental issues between the study populations examined, are common to all candidate gene association studies. However, we believe this current finding to be robust because rs439401 genotype was associated with several metabolic variables that, although related, are not perfectly correlated, suggesting that rs439401 is indexing an APOE variant that has pleiotropic effects on both lipid metabolism and abdominal fat accumulation that vary as a function of exposure to a major, pervasive life stressor, being the primary caregiver for a relative with Alzheimer's disease or other major dementia. In addition to biological plausibility, a strategy to reduce the potential for false-positive associations is to validate the results in a second sample (2), and work to accomplish this goal is currently under way.
Our confidence in the current findings is further reinforced by an analysis of recent genome-wide association studies of loci affecting serum lipid levels in 16 European population-based cohorts, with numbers ranging from 17,797 to 22,562 persons, in which the APOE rs439401 C allele was found associated (p = 1.8E-9) with higher levels of serum triglycerides (30). This pattern of association is consistent with that observed in the current study of U.S. caregivers and controls, in which the controls carrying the C allele had higher triglyceride levels (p = .002) than controls with the TT genotype. Like controls in the current study, persons in the large European genome-wide association studies sample (30) are unlikely to be exposed to the sort of chronic, pervasive stress experienced by caregivers of a relative with Alzheimer's disease. It is not surprising, therefore, that they showed a similar pattern of association between rs439401 genotype and triglyceride levels.
Our findings are consistent with other research showing that there are APOE SNPs that are associated with lipid and glucose metabolism and CVD risk in ways that are independent of the ε4 polymorphism (11–13). Because rs439401 is in a noncoding region of APOE, if the effects of the TT genotype on metabolic traits we found are real, it may be because rs439401 is in LD with another site (or part of a haplotype containing that site) that is affecting gene function or that the effect is mediated through other functions of the noncoding deoxyribonucleic acid, e.g., via noncoding ribonucleic acid. Further research will be required to confirm this mechanism.
In addition to genetic factors that have been found to be associated with complex diseases, such as T2D and CVD, environmental factors like stress may also increase risk of these diseases (8). It is also important to consider gene-environment interactions when attempting to understand the role of genetic and environmental factors in the development of disease. For example, in a previous study, caregivers, compared with controls, were found to have poorer sleep quality that was mediated by more negative affect and less social support among caregivers (25) and moderated by serotonin promoter polymorphism genotype (29). We have also found associations between genotype of a polymorphism of the monoamine oxidase A gene promoter and lipid levels (31) and sleep quality and depressive symptom levels (32). In the current study, the TT genotype of the APOE SNP rs439401 was associated with higher levels of triglycerides and waist circumference and lower levels of HDL cholesterol but only for those who were exposed to the stress of caregiving. This suggests the testable hypothesis that individuals with the rs439401 TT genotype who experience chronic stress are at elevated risk for the development of diseases associated with metabolic dysregulation, such as T2D and CVD.
The diathesis-stress model that proposes certain individuals are particularly vulnerable to adversity is one of the fundamental underlying propositions asserted by psychiatric research that examines gene-environment interactions (33). Another view is one of differential susceptibility that suggests those most susceptible to adversity due to their genetic makeup are simultaneously most likely to benefit from supportive or enriching experiences or even just the absence of adversity (34). In a recent commentary on this topic, we reviewed recent gene-environment interaction findings that are consistent with this perspective. The results presented suggest that putative vulnerability genes, or risk alleles, can also be conceptualized as “plasticity genes” that make individuals more susceptible to environmental influences for better and for worse (35). The data from the present study are consistent with this plasticity model, as the TT genotype of rs439401 is associated with a more favorable pattern for waist circumference, triglycerides, and HDL cholesterol among individuals in our lower stress, noncaregiver control group.
The varying levels of serum triglycerides and HDL cholesterol found in caregivers versus controls with the rs439401 TT genotype in this study suggest the likelihood that these two groups will experience different rates of coronary heart disease (CHD) prevalence, despite having the same genotype. The larger proportion (73%) of women in the current sample could mean such effects of the TT genotype on CHD risk may be limited to women. Although we had limited power to detect gender moderation of the rs439401 × group effect on metabolic traits in this sample, there was not even a trend to a significant MANOVA gender × rs439401 × group interaction (p = .61), suggesting that the clinical implications of the varying HDL cholesterol and triglyceride levels as a function of rs439401 genotype and stress level will likely extend to men as well.
To provide an estimate of the potential clinical significance of the rs439401 × group interaction effects we observed in this study, we used the Framingham 10-Year Risk Calculator (http://hp2010.nhlbihin.net/atpiii/CALCULATOR.asp?usertype=prof) to estimate CHD risk in a 60-year-old male with total cholesterol of 200 mg/dL, systolic blood pressure of 120 mm Hg, who is not a smoker or on medication for high blood pressure with an HDL cholesterol level of 58 mg/dL (the level seen in controls with the TT genotype) and who will have a 10-year risk score of 7%; in contrast, a man with the same levels of other risk factors but an HDL cholesterol level of 43 mg/dL (the level seen in caregivers with the TT genotype) will have a 10-year risk score of 9% to 28.6% higher than controls with the TT genotype. Ten-year risk scores for a 65-year-old female with a similar profile of other factors are 2% for an HDL cholesterol of 58 mg/dL versus 3% for an HDL cholesterol of 43 mg/dL, a 50% increase in risk. Similarly, research by Tirosh et al. (36) suggested that the fasting serum triglyceride level of 76 mg/dL seen in controls with the TT genotype will not be associated with an increase in CHD risk (hazard ratio, 1.04) relative to persons with low triglyceride levels. In contrast, the fasting triglyceride of 123 mg/dL seen in the TT caregivers was associated with a CHD hazard ratio of >3.0 (36). An important clinical implication of the present findings is that behavioral interventions that reduce stress levels in chronically stressed persons with the APOE rs439401 TT genotype might have the potential to convert their adverse metabolic profile not just to “average” risk levels but to low-risk levels.
In conclusion, we found the APOE SNP rs439401 TT genotype was associated with an adverse metabolic profile (increased waist circumference and triglycerides, decreased HDL cholesterol) in a sample of chronically stressed U.S. caregivers. Further research will be required, first to replicate these effects of rs439401, to confirm the association of the TT genotype with endophenotypes of T2D and CVD in stressed persons, and then to characterize the molecular genetic mechanisms responsible for those effects. This research could confirm that the rs439401 TT genotype can be used to identify persons with high levels of chronic psychosocial stress who are at high risk of T2D and CVD and who could be targeted for preventive interventions that have the potential to convert their profile to low risk.
Acknowledgments
This study was supported, in part, by the Center for Pharmacogenomics at the University of Copenhagen, Denmark; Grant R01 AG019605 from the National Institute on Aging; Grant P01HL36587 from the National Heart, Lung and Blood Institute; and the Behavioral Medicine Research Center, Duke University Medical Center, Durham, North Carolina.
Glossary
- APOE
apolipoprotein E
- CVD
cardiovascular disease
- SNPs
single nucleotide polymorphisms
Footnotes
The authors have not disclosed any potential conflicts of interest.
REFERENCES
- 1.Leboyer M, Bellivier F, Nosten-Bertrand M, Jouvent R, Pauls D, Mallet J. Psychiatric genetics: search for phenotypes. Trends Neurosci. 1998;21:102–5. doi: 10.1016/s0166-2236(97)01187-9. [DOI] [PubMed] [Google Scholar]
- 2.Cornblatt BA, Malhotra AK. Impaired attention as an endophenotype for molecular genetic studies of schizophrenia. Am J Med Genet. 2001;105:11–5. [PubMed] [Google Scholar]
- 3.Iacono WG, Carlson SR, Malone SM. Identifying a multivariate endophenotype for substance use disorders using psychophysiological measures. Int J Psychophysiol. 2000;38:81–96. doi: 10.1016/s0167-8760(00)00132-x. [DOI] [PubMed] [Google Scholar]
- 4.Moffitt TE, Caspi A, Rutter M. Strategy for investigating interactions between measured genes and measured environments. Arch Gen Psychiatry. 2005;62:473–81. doi: 10.1001/archpsyc.62.5.473. [DOI] [PubMed] [Google Scholar]
- 5.Despres JP. Health consequences of visceral obesity. Ann Med. 2001;33:534–41. doi: 10.3109/07853890108995963. [DOI] [PubMed] [Google Scholar]
- 6.Kahn SE, Hull RL, Utzschneider KM. Mechanisms linking obesity to insulin resistance and type 2 diabetes. Nature. 2006;444:840–6. doi: 10.1038/nature05482. [DOI] [PubMed] [Google Scholar]
- 7.Song Y, Stampfer MJ, Liu S. Meta-analysis: apolipoprotein E genotypes and risk for coronary heart disease. Ann Intern Med. 2004;141:137–47. doi: 10.7326/0003-4819-141-2-200407200-00013. [DOI] [PubMed] [Google Scholar]
- 8.Breslow JL. Genetics of lipoprotein abnormalities associated with coronary artery disease susceptibility. Annu Rev Genet. 2000;34:233–54. doi: 10.1146/annurev.genet.34.1.233. [DOI] [PubMed] [Google Scholar]
- 9.Bennet AM, Di Angelantonio E, Ye Z, Wensley F, Dahlin A, Ahlbom A, Keavney B, Collins R, Wiman B, de Faire U, Danesh J. Association of apolipoprotein E genotypes with lipid levels and coronary risk. JAMA. 2007;298:1300–11. doi: 10.1001/jama.298.11.1300. [DOI] [PubMed] [Google Scholar]
- 10.Fumeron F, Rigaud D, Bertiere MC, Bardon S, Dely C, Apfelbaum M. Association of apolipoprotein epsilon 4 allele with hypertriglyceridemia in obesity. Clin Genet. 1988;34:258–64. doi: 10.1111/j.1399-0004.1988.tb02873.x. [DOI] [PubMed] [Google Scholar]
- 11.Frikke-Schmidt R, Sing CF, Nordestgaard BG, Steffensen R, Tybjaerg-Hansen A. Subsets of SNPs define rare genotype classes that predict ischemic heart disease. Hum Genet. 2007;120:865–77. doi: 10.1007/s00439-006-0233-y. [DOI] [PMC free article] [PubMed] [Google Scholar]
- 12.Stengard JH, Kardia SL, Hamon SC, Frikke-Schmidt R, Tybjaerg-Hansen A, Salomaa V, Boerwinkle E, Sing CF. Contribution of regulatory and structural variations in APOE to predicting dyslipidemia. J Lipid Res. 2006;47:318–28. doi: 10.1194/jlr.M500491-JLR200. [DOI] [PMC free article] [PubMed] [Google Scholar]
- 13.Long JR, Liu PY, Liu YJ, Lu Y, Xiong DH, Elze L, Recker RR, Deng HW. APOE and TGF-beta1 genes are associated with obesity phenotypes. J Med Genet. 2003;40:918–24. doi: 10.1136/jmg.40.12.918. [DOI] [PMC free article] [PubMed] [Google Scholar]
- 14.Eichner JE, Dunn ST, Perveen G, Thompson DM, Stewart KE, Stroehla BC. Apolipoprotein E polymorphism and cardiovascular disease: a HuGE review. Am J Epidemiol. 2002;155:487–95. doi: 10.1093/aje/155.6.487. [DOI] [PubMed] [Google Scholar]
- 15.Elosua R, Demissie S, Cupples LA, Meigs JB, Wilson PW, Schaefer EJ, Corella D, Ordovas JM. Obesity modulates the association among APOE genotype, insulin, and glucose in men. Obes Res. 2003;11:1502–8. doi: 10.1038/oby.2003.201. [DOI] [PubMed] [Google Scholar]
- 16.Jemaa R, Elasmi M, Naouali C, Feki M, Kallel A, Souissi M, Sanhaji H, Hadj TS, Souheil O, Kaabachi N. Apolipoprotein E polymorphism in the Tunisian population: frequency and effect on lipid parameters. Clin Biochem. 2006;39:816–20. doi: 10.1016/j.clinbiochem.2006.04.018. [DOI] [PubMed] [Google Scholar]
- 17.Bjorntorp P. Do stress reactions cause abdominal obesity and comorbidities? Obes Rev. 2001;2:73–86. doi: 10.1046/j.1467-789x.2001.00027.x. [DOI] [PubMed] [Google Scholar]
- 18.Bjorntorp P. Neuroendocrine perturbations as a cause of insulin resistance. Diabetes Metab Res Rev. 1999;15:427–41. doi: 10.1002/(sici)1520-7560(199911/12)15:6<427::aid-dmrr68>3.0.co;2-c. [DOI] [PubMed] [Google Scholar]
- 19.Sing CF, Stengard JH, Kardia SL. Genes, environment, and cardiovascular disease. Arterioscler Thromb Vasc Biol. 2003;23:1190–6. doi: 10.1161/01.ATV.0000075081.51227.86. [DOI] [PubMed] [Google Scholar]
- 20.Clement K, Sørensen TIA, editors. Obesity: Genomics and Postgenomics. Informa Healthcare; New York: 2007. [Google Scholar]
- 21.Williams RB, Barefoot JC, Schneiderman N. Psychosocial risk factors for cardiovascular disease: more than one culprit at work. JAMA. 2003;290:2190–2. doi: 10.1001/jama.290.16.2190. [DOI] [PubMed] [Google Scholar]
- 22.Schulz R, Beach SR. Caregiving as a risk factor for mortality: the caregiver health effects study. JAMA. 1999;282:2215–9. doi: 10.1001/jama.282.23.2215. [DOI] [PubMed] [Google Scholar]
- 23.Vitaliano PP, Zhang J, Scanlan JM. Is caregiving hazardous to one's physical health? A meta-analysis. Psychol Bull. 2003;129:946–72. doi: 10.1037/0033-2909.129.6.946. [DOI] [PubMed] [Google Scholar]
- 24.Vitaliano PP, Scanlan JM, Zhang J, Savage MV, Hirsch IB, Siegler IC. A path model of chronic stress, the metabolic syndrome, and coronary heart disease. Psychosom Med. 2002;64:418–35. doi: 10.1097/00006842-200205000-00006. [DOI] [PubMed] [Google Scholar]
- 25.Barrett JC, Maller J, Daly MJ. Haploview: analysis and visualization of LD and haplotype maps. Bioinformatics. 2005;21:263–5. doi: 10.1093/bioinformatics/bth457. [DOI] [PubMed] [Google Scholar]
- 26.Matthews DR, Hosker JP, Rudenski AS, Naylor BA, Treacher DF, Turner RC. Homeostasis model assessment: insulin resistance and beta-cell function from fasting plasma glucose and insulin concentrations in man. Diabetologia. 1985;28:412–9. doi: 10.1007/BF00280883. [DOI] [PubMed] [Google Scholar]
- 27.Brummett BH, Babyak MA, Siegler IC, Vitaliano PP, Ballard EL, Gwyther LP, Williams RB. Associations among perceptions of social support, negative affect, and quality of sleep in caregivers and noncaregivers. Health Psychol. 2006;25:220–5. doi: 10.1037/0278-6133.25.2.220. [DOI] [PubMed] [Google Scholar]
- 28.Caspi A, Sugden K, Moffitt TE, Taylor A, Craig IW, Harrington H, McClay J, Mill J, Martin J, Braithwaite A, Poulton R. Influence of life stress on depression: moderation by a polymorphism in the 5-HTT gene. Science. 2003;301:386–9. doi: 10.1126/science.1083968. [DOI] [PubMed] [Google Scholar]
- 29.Brummett BH, Krystal AD, Ashley-Koch A, Kuhn CM, Züchner S, Siegler IC, Barefoot JC, Ballard EL, Gwyther LP, Williams RB. Sleep quality varies as a function of 5-HTTLPR genotype and stress. Psycho-som Med. 2007;69:621–4. doi: 10.1097/PSY.0b013e31814b8de6. [DOI] [PMC free article] [PubMed] [Google Scholar]
- 30.Aulchenko YS, Ripatti S, Lindqvist I, Boomsma D, Heid IM, Pramstaller PP. Loci influencing lipid levels and coronary heart disease risk in 16 European population cohorts. Nat Genet. 2009;41:47–55. doi: 10.1038/ng.269. [DOI] [PMC free article] [PubMed] [Google Scholar]
- 31.Brummett BH, Boyle SH, Siegler IC, Zuchner S, Ashley-Koch A, Williams RB. Lipid levels are associated with a regulatory polymorphism of the monoamine oxidase-A gene promoter (MAOA-uVNTR) Med Sci Monit. 2008;14:CR57–61. [PMC free article] [PubMed] [Google Scholar]
- 32.Brummett BH, Krystal AD, Siegler IC, Kuhn C, Surwit RS, Zuchner S, Ashley-Koch A, Barefoot JC, Williams RB. Associations of a regulatory polymorphism of monoamine oxidase-A gene promoter (MAOA-uVNTR) with symptoms of depression and sleep quality. Psychosom Med. 2007;69:396–401. doi: 10.1097/PSY.0b013e31806d040b. [DOI] [PMC free article] [PubMed] [Google Scholar]
- 33.Rutter M, Moffitt TE, Caspi A. Gene-environment interplay and psychopathology: multiple varieties but real effects. J Child Psychol Psychiatry. 2006;47:226–61. doi: 10.1111/j.1469-7610.2005.01557.x. [DOI] [PubMed] [Google Scholar]
- 34.Belsky J. Differential susceptibility to rearing influences: an evolutionary hypothesis and some evidence. In: Ellis B, Bjorklund D, editors. Origins of the Social Mind: Evolutionary Psychology and Child Development. Guildford; New York: 2005. [Google Scholar]
- 35.Belsky J, Jonassaint C, Pluess M, Stanton M, Brummett BH, Williams R. Vulnerability genes or plasticity genes? Mol Psychiatry. 2009;14:746–54. doi: 10.1038/mp.2009.44. [DOI] [PMC free article] [PubMed] [Google Scholar]
- 36.Tirosh A, Rudich A, Shochat T, Tekes-Manova D, Israeli E, Henkin Y, Kochba I, Shai I. Changes in triglyceride levels and risk for coronary heart disease in young men. Ann Intern Med. 2007;147:377–85. doi: 10.7326/0003-4819-147-6-200709180-00007. [DOI] [PubMed] [Google Scholar]