Abstract
The development of hyperpolarized technology utilizing dynamic nuclear polarization (DNP) has enabled the rapid measurement of 13C metabolism in vivo with very high SNR. However, with traditional DNP equipment, consecutive injections of a hyperpolarized compound in an animal have been subject to a practical minimum time between injections governed by the polarization build-up time, which is on the order of an hour for [1-13C]pyruvate. This has precluded the monitoring of metabolic changes occurring on a faster time scale. In this study, we demonstrated the ability to acquire in vivo dynamic magnetic resonance spectroscopy (MRS) and 3D magnetic resonance spectroscopic imaging (MRSI) data in normal rats with a 5 minute interval between injections of hyperpolarized [1-13C]pyruvate using a prototype, sub-Kelvin dynamic nuclear polarizer with the capability to simultaneously polarize up to 4 samples and dissolve them in rapid succession. There were minimal perturbations in the hyperpolarized spectra as a result of the multiple injections, suggesting that such an approach would not confound the investigation of metabolism occurring on this time scale. As an initial demonstration of the application of this technology and approach for monitoring rapid changes in metabolism as a result of a physiological intervention, we investigated the pharmacodynamics of the anti-cancer agent dichloroacetate (DCA), collecting hyperpolarized data before administration of DCA, 1 minute after administration, and 6 minutes after administration. Dramatic increases in 13C-bicarbonate were detected just 1 minute (as well as 6 minutes) after DCA administration.
Keywords: Hyperpolarized carbon-13, Dynamic nuclear polarization (DNP), Pyruvate metabolism, Dichloroacetate (DCA), SpinLab™ prototype
Introduction
Development of hyperpolarized (HP) MRI technology utilizing dissolution dynamic nuclear polarization (DNP) has enabled the rapid measurement of 13C metabolism in vivo with very high SNR (1). [1-13C]Pyruvate, which metabolically converts to [1-13C]lactate, [1-13C]alanine, and 13C-bicarbonate via enzyme-mediated reactions, has been the most widely used DNP agent for both in vitro and in vivo applications thus far (2). The levels of these hyperpolarized metabolic products have been used to assess disease state in many preclinical studies (2). For example, in cancer animal models, dramatic increases in [1-13C]lactate have been detected (3–6). The most widely used dynamic nuclear polarizer is a commercial polarizer (HyperSense™, Oxford Instruments) based on a design (1) that is limited to polarization and dissolution of one sample at a time. With this traditional design, consecutive injections of a hyperpolarized compound in an animal have been subject to a practical minimum time between injections governed by the polarization build-up time, which is on the order of an hour for [1-13C]pyruvate. This has precluded the monitoring of metabolic changes occurring on a time scale faster than the polarization build-up time but slower than the spin-lattice relaxation of the hyperpolarized species. In other words, this prior polarizer is not designed to acquire hyperpolarized images every few minutes, which would have utility for applications such as observing the temporal dynamics of drug action or reperfusion after ischemia on this time scale.
The purpose of this study was to utilize new DNP technology to dissolve and inject in vivo multiple hyperpolarized [1-13C]pyruvate samples in rapid succession. This was accomplished by using a prototype, sub-Kelvin polarizer (SpinLab™, General Electric) with the capability to simultaneously polarize up to 4 samples (7). In this project, up to 4 samples of hyperpolarized [1-13C]pyruvate were injected into normal rats at time points of 0, 5, 10, and 15 minutes with the goal of testing feasibility and analyzing the reproducibility of serial hyperpolarized magnetic resonance spectroscopy (MRS) and magnetic resonance spectroscopic imaging (MRSI) data. This preliminary study, characterizing the perturbations in hyperpolarized spectra due to rapid sequential injections, is important before proceeding to studies assessing responses to physiological interventions. A secondary goal of this study was to investigate a test application with a physiological intervention. Thus, we employed the new DNP technology and methodology to evaluate the pharmacodynamics of dichloroacetate (DCA) action. DCA has shown promise as an anticancer agent in numerous in vitro studies, preclinical experiments, and most recently, a clinical trial (8–9) and is a drug whose effect on hyperpolarized pyruvate metabolism in normal rats is known to result in increased conversion of [1-13C]pyruvate to 13C-bicarbonate via pyruvate dehydrogenase (PDH) (10).
Methods
Polarizer and Preparations
All hyperpolarizations were performed using a prototype SpinLab™ DNP polarizer (General Electric, Waukesha, WI) (7). For the experiments not involving DCA, a mixture consisting of 80 µL (approximately 100 mg) of C1-labeled pyruvic acid and 15 mM trityl radical was used. For the DCA experiments, 1.5 mM Dotarem® gadolinium was also added. The preparation was polarized for more than 1 hour and then dissolved and neutralized in an aqueous solution with 40 mM Tris, 100 mM NaOH, and 0.3 mM Na2EDTA. The final dissolved pyruvate had a concentration of 100mM and a pH of ~7.7. The liquid state polarizations of [1-13C]pyruvate with and without gadolinium were typically >30% and >50% respectively at the time of dissolution. A detailed description of the fluid path and dissolution process has already been reported (7). For these animal experiments, the pyruvate samples were not prepared under sterile conditions. Instead, in order to preserve flexibility, the components of the fluid path (7) were manually assembled in a non-sterile laboratory environment. In addition, the trityl radical was not filtered from the dissolved material.
Animal Handling
All animal studies were carried out under a protocol approved by the Institutional Animal Care and Use Committee. Normal male Sprague-Dawley rats were used. For each experiment, a rat was anesthetized with an initial dose of isoflurane (2–3%), placed on a heated pad, and had a tail vein catheter inserted while under continuous anesthesia (1–2% isoflurane). An extension tube was attached to the main catheter to facilitate the administration of the hyperpolarized substrate. The rat was then transferred to a heated water pad (37 °C, continuous flow) in the radiofrequency (RF) coil in the MR scanner, strapped in place, kept under anesthesia with continuous delivery of isoflurane (1–2%) through a long tube to a nose cone (oxygen flow of 1 L/min), and periodically monitored. For all experiments, 2.5 mL of the dissolved hyperpolarized material was injected into the rat over 12 sec. The amount of pyruvate left in the catheter extension tubing after each injection was ~0.5 mL, which was flushed into the rat with saline after the completion of the MR scan. In the DCA studies, sodium dichloroacetate (Sigma Aldrich, St. Louis, MO, USA) was dissolved in saline (100 mg/mL) and administered to each rat intravenously at a dose of 300 mg/kg over ~10 sec.
MR Studies
All experiments were performed on a 3T MR scanner (GE Healthcare, Waukesha, WI, USA) equipped with multinuclear spectroscopy capability. A custom dual-tuned 1H/13C rat coil with a quadrature 13C channel and a linear 1H channel was used. The coil design was the same as in (11), and the coil measured 15.25 cm in length with an 8.3 cm inner diameter. Axial T2-weighted anatomical images were acquired with a standard fast spin-echo sequence. For the experiments not involving DCA, carbon-13 acquisitions were performed at time points of 0, 5, 10, and, in cases of 4 samples, 15 minutes. In the other studies, just three serial HP pyruvate injections were performed due to time and logistical constraints. For the dynamic MRS experiments, a double spin-echo sequence with adiabatic refocusing pulses (12) with TE = 35 ms, TR = 3 sec, and 5 degree 80 mm slab excitation (covering from top of liver to top of bladder) was used. During this scan, which started at the beginning of injection of pyruvate, 64 FIDs were acquired, resulting in a scan time of 3 min and 12 sec. The first 32 FIDs with the highest SNR were used for quantification. For the 3D-echo-planar spectroscopic (EPSI) experiments, the double-spin echo sequence (12) was modified to use a single 180 degree adiabatic refocusing pulse, converting it to a single spin-echo EPSI sequence. The imaging parameters were: 8×8×16 x/y/z imaging matrix with flyback readout on the z-axis, 1 cm3 isotropic resolution, TE = 120 ms, TR = 195 ms, 12.5 sec imaging time, and 25 sec delay between start of injection and start of imaging. The other parameters were the same as those described previously (13). For the experiments involving DCA, the same dynamic MRS sequence was used, and all parameters were the same except only 32 FIDs were acquired, resulting in a scan time of 1 min and 36 sec. Carbon-13 acquisitions were performed at 0, 5, and 10 minutes, and the DCA was administered at the 4 minute mark. Thus, baseline, 1 minute post-DCA, and 6 minutes post-DCA data were acquired.
Data Analysis
For the MRS acquisitions, a 10 Hz Gaussian apodization filter was applied to each FID, a 1D FFT was performed, and a zero-order phase correction was employed. The first 32 spectra were summed together, and for metabolite quantification, noise-subtracted area ratios were used. For quantification, total carbon was defined as the sum of the areas of all the resonances, specifically lactate, alanine, pyruvate, and bicarbonate resonances. The pyruvate area included the contribution from its hydrate form resonance as well. For the 3D-MRSI acquisitions, specialized software was used for processing, the details of which are described in (13). Quantification was the same as in the MRS acquisitions except the bicarbonate signal was not detected at adequate SNR and therefore not included.
Statistical analysis was performed with the JMP software package on the 0, 5, and 10 minute time point groups (the groups for which complete data existed). The MANOVA (multivariate ANOVA) with repeated measures setting was used to determine whether a significant difference existed among the 0, 5, and 10 minute groups. This was appropriate given the study design, in which each rat was measured multiple times by HP MR, and the purpose was to determine whether the time point had an effect on the hyperpolarized spectra. Note: the p-values reported in the subsequent tables refer to the repeated measures ANOVA value calculated by JMP, indicating whether any difference exists among the 0, 5, and 10 minute groups.
Results
Dynamic MRS
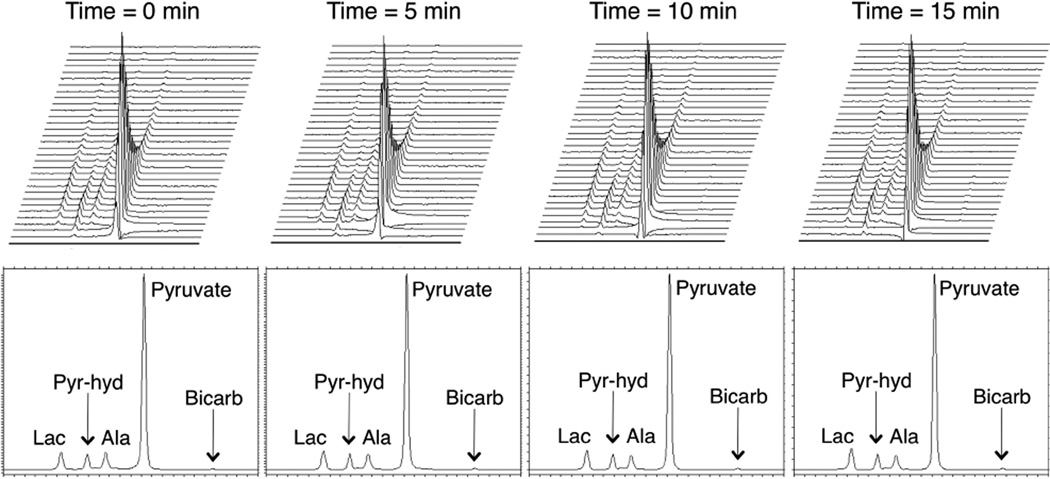
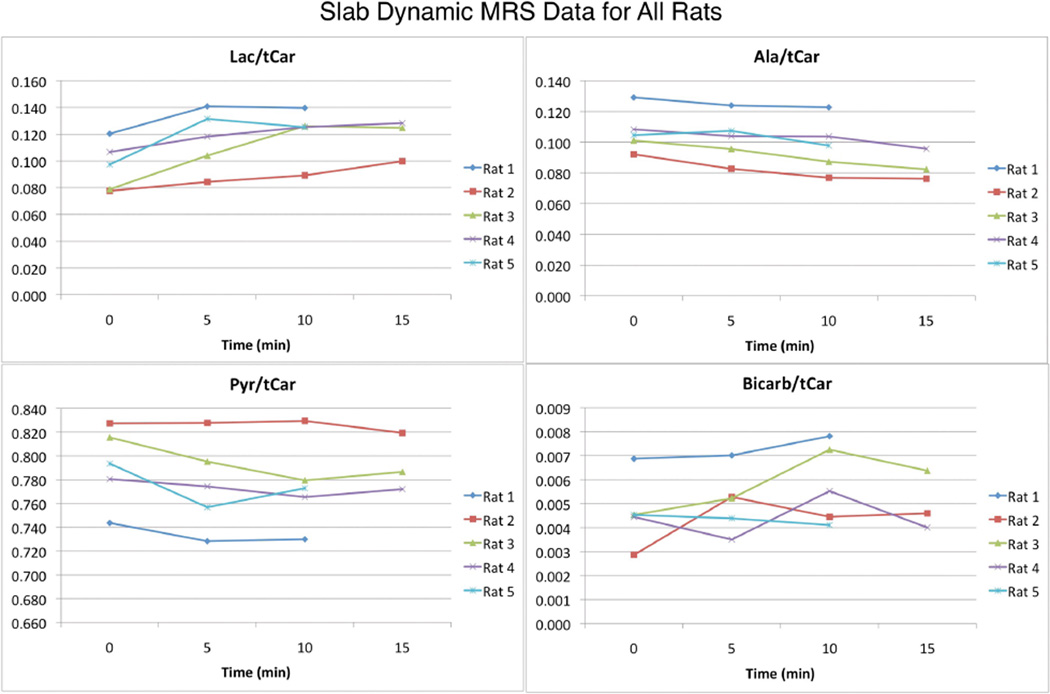
The slab dynamic MRS sequence described above was used to acquire data from 5 rats. For 3 of the rats, acquisitions occurred at 0, 5, 10, and 15 minutes. For the other 2 cases, only three injections were performed and the 15 minute time point was not acquired. The top row of Figure 1 shows representative dynamic time courses (first 32 points, 1 min and 36 sec span) at 0, 5, 10, and 15 minutes for one rat. The bottom row shows the summation of each dynamic time course. The resonances detected, as reported previously in (10), were lactate (184.9 ppm), pyruvate-hydrate (181.0 ppm), alanine (178.4 ppm), pyruvate (172.8 ppm), and bicarbonate (162.7 ppm). The same chemical shift values were observed for all other experiments as well. Qualitatively, the dynamic time courses and summed spectra were highly reproducible, and minimal temporal changes were detected over the 15 minutes of the 4 hyperpolarized injections. Figure 2 shows the quantitative changes in lactate/total carbon (lac/tCar), alanine/total carbon (ala/tCar), pyruvate/total carbon (pyr/tCar), and bicarbonate/total carbon (bicarb/tCar) fractions over time for all the rats. As indicated in Table 1 below, the percent changes in metabolite to total-carbon fractions from the baseline (time = 0 min) scan were minimal (especially when comparing the means to the standard deviations. Lactate/pyruvate (lac/pyr) and alanine/pyruvate (ala/pyr) ratios were evaluated as a comparison with lac/tCar and ala/tCar respectively and were found to be very similar, demonstrating that metabolite quantification was insensitive to the manner of ratio evaluation. As shown in Table 1, none of the p-values was less than 0.05, indicating no statistically significant changes from baseline at the 95% confidence interval in the 5 minute or 10 minute groups for any of the hyperpolarized metrics.
Figure 1.
Representative slab (top of liver to bladder) hyperpolarized dynamic MRS data from one rat at 0, 5, 10, and 15 minutes. The top row shows the dynamic time courses (32 dynamic time points, acquisition starting upon injection, span of 1 min and 36 sec), with the peaks from left to right being lactate (184.9 ppm), pyruvate-hydrate (181.0 ppm), alanine (178.4 ppm), and pyruvate (172.8 ppm). The bottom row shows the summation of each dynamic time course. Bicarbonate (162.7 ppm) was visible upon zooming into the summed spectra. Minimal temporal changes were detected over the 15 minutes of the 4 hyperpolarized injections.
Figure 2.
Slab dynamic MRS data for all 5 rats studied. All lac/tCar, ala/tCar, pyr/tCar, and bicarb/tCar data for all hyperpolarized injection time points are shown. There appeared to be a trend of a small increase in lac/tCar and a small decrease in ala/tCar over time. Pyr/tCar and bicarb/tCar did not change over time.
Table 1.
Percent Change (Mean and Standard Deviation) in Metabolite Levels from Baseline Scan (Time = 0 Min) for HP MRS Experiments.
| 5 min (n = 5) | 10 min (n = 5) | P-value | |
|---|---|---|---|
| Lac/tCar | +20.7 ± 12.2 | +27.4 ± 19.0 | 0.069 |
| Ala/tCar | −4.2 ± 4.6 | −9.2 ± 5.5 | 0.070 |
| Pyr/tCar | −2.0 ± 1.8 | −2.1 ± 1.7 | 0.185 |
| Bicarb/tCar | +15.5 ± 40.7 | +28.8 ± 29.0 | 0.276 |
| Lac/Pyr | +23.3 ± 14.6 | +30.4 ± 21.6 | 0.072 |
| Ala/Pyr | −2.2 ± 6.4 | −7.2 ± 6.0 | 0.121 |
3D Spectroscopic Imaging
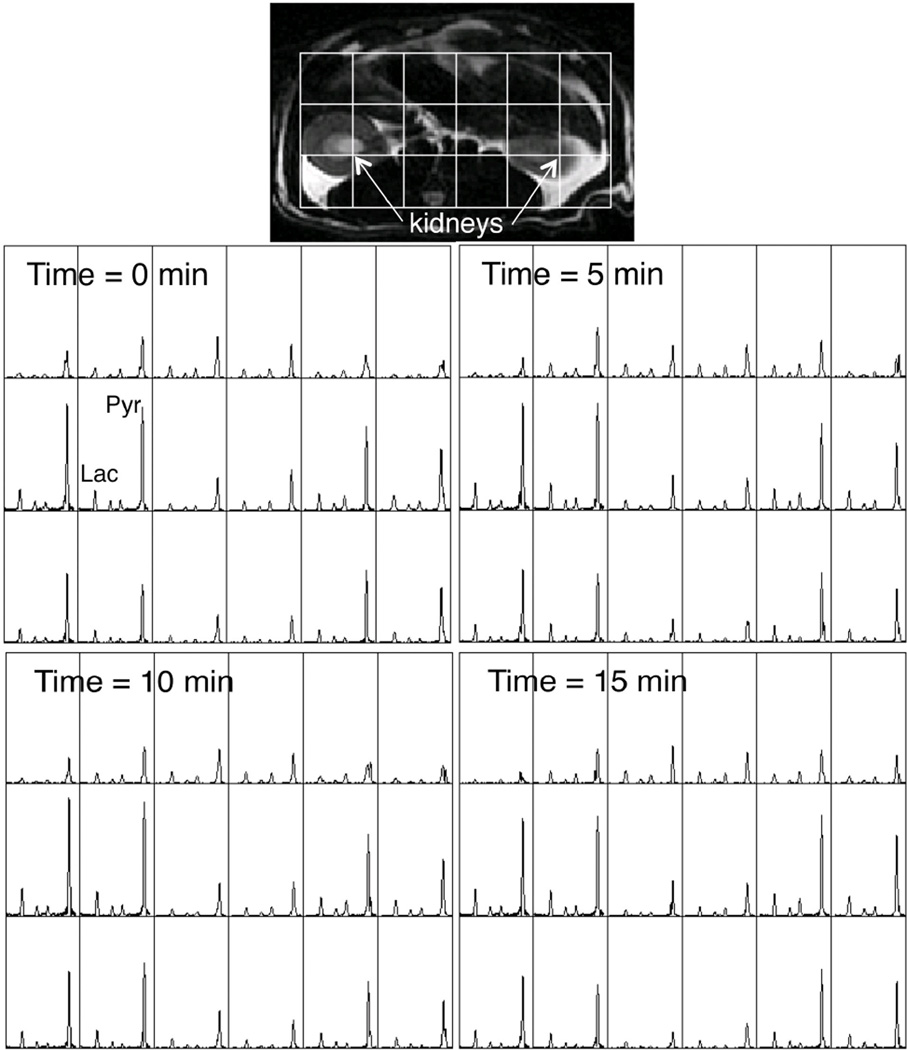
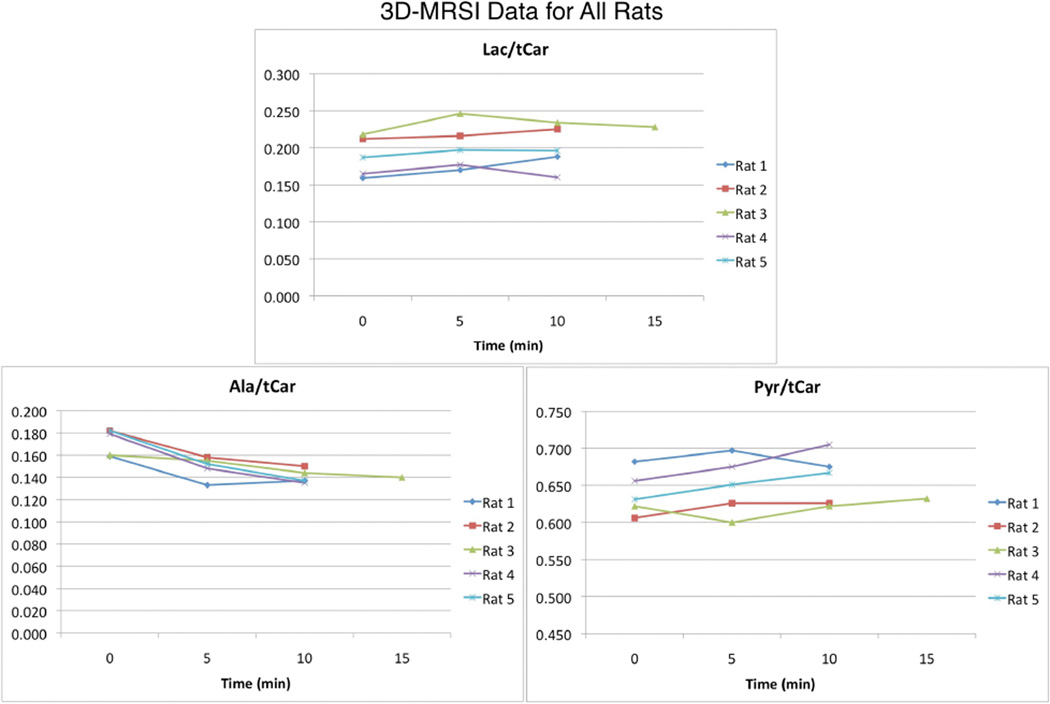
In order to corroborate and elucidate the MRS results, the 3D-EPSI sequence described in the methods section was used to acquire data from 5 rats. For one of the rats, acquisitions occurred at 0, 5, 10, and 15 minutes. For the rest, three injections were performed and the 15 minute time point was not acquired. Figure 3 shows spectra from a slice at the kidney level at 0, 5, 10, and 15 minutes. The 3x6 grids of spectra correspond to the 3×6 grid overlaid on the anatomical image. As shown by Figure 3, the voxels with the highest signal level correspond to the kidneys. Qualitatively, as was the case for the MRS data, the spectra were reproducible, and minimal temporal changes were observed over the 15 minutes of the 4 hyperpolarized injections. Figure 4 shows all of the lac/tCar, ala/tCar, and pyr/tCar 3D-MRSI data, with each value derived by taking an average over all voxels from the liver to the bladder. Table 2 indicates the percent changes in metabolite levels from the baseline (time = 0 min) scan, which were similar to the changes observed in the MRS experiments shown in Table 1. In addition, due to the ability to collect localized data, voxels identified as being liver, kidneys, gastrointestinal (GI) tissue, and muscle could also be quantified. These data are also shown in Table 2.
Figure 3.
Representative hyperpolarized EPSI data from one rat at 0, 5, 10, and 15 minutes. 3×6 grids of 1 cm3 voxels from a slice containing the kidneys are shown. Data acquisition started 25 seconds after the start of injection of hyperpolarized [1-13C]pyruvate and lasted 12.5 seconds. Minimal temporal changes were detected over the 15 minutes of the 4 hyperpolarized injections.
Figure 4.
EPSI data for all 5 rats studied. All lac/tCar, ala/tCar, and pyr/tCar data for all hyperpolarized injection time points are shown. Each value was derived by calculating an average over all voxels (top of liver to bladder) for that particular rat. There appeared to be a trend of decreasing ala/tCar over time. Lac/tCar and pyr/tCar did not change over time.
Table 2.
Percent Change (Mean and Standard Deviation) in Metabolite Levels from Baseline (Time = 0 Min) Scan for 3D-MRSI Experiments.
| 5 min (n = 5) | 10 min (n = 5) | P-value | |
|---|---|---|---|
| Lac/tCar (all) | +6.9 ± 4.0 | +6.7 ± 7.6 | 0.102 |
| Ala/tCar (all) | −13.3 ± 5.9 | −18.2 ± 6.5 | 0.039* |
| Pyr/tCar (all) | +1.6 ± 2.9 | +3.1 ± 3.6 | 0.385 |
| Lac/tCar (liver) | +5.5 ± 7.9 | +6.9 ± 9.0 | 0.357 |
| Ala/tCar (liver) | −10.3 ± 3.3 | −14.9 ± 5.0 | 0.022* |
| Pyr/tCar (liver) | +2.7 ± 4.1 | +4.7 ± 2.7 | 0.095 |
| Lac/tCar (kidneys) | +2.6 ± 8.3 | +5.8 ± 14.0 | 0.567 |
| Ala/tCar (kidneys) | −7.8 ± 8.2 | −10.3 ± 17.1 | 0.350 |
| Pyr/tCar (kidneys) | +0.7 ± 2.8 | +0.6 ± 4.7 | 0.885 |
| Lac/tCar (GI) | +7.5 ± 4.3 | +11.2 ± 4.3 | 0.0035* |
| Ala/tCar (GI) | −12.7 ± 5.0 | −14.5 ± 6.2 | 0.069 |
| Pyr/tCar (GI) | +1.5 ± 2.5 | +1.0 ± 2.8 | 0.601 |
| Lac/tCar (muscle) | +9.8 ± 7.3 | +8.6 ± 7.5 | 0.134 |
| Ala/tCar (muscle) | −15.8 ± 16.8 | −29.1 ± 7.1 | 0.014* |
| Pyr/tCar (muscle) | +0.4 ± 8.7 | +4.9 ± 4.6 | 0.205 |
Table 2 indicates that overall, there were no significant changes except a statistically significant decrease in ala/tCar. Statistically significant decreases from baseline were also detected for ala/tCar in liver and muscle tissue, and a statistically significant increase from baseline was detected for lac/tCar in gastrointestinal tissue.
DCA
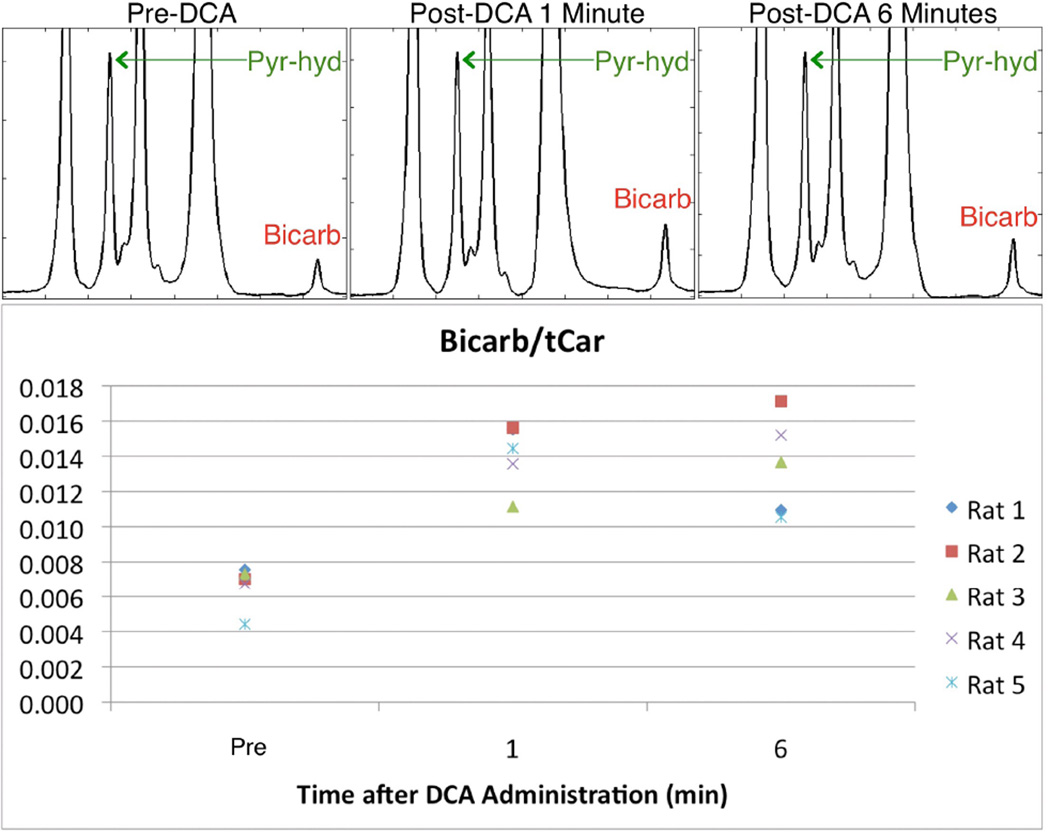
MRS data were collected for 5 rats at 0, 5, and 10 minute time points. The experimental protocol was the same as that for the MRS data presented in Figures 1 and 2 and Table 1, except that DCA was administered at the 4 minute mark. Thus, the data from Figures 1 and 2 and Table 1 serve as control data for the data presented in Figure 5 and Table 3. The spectra in Figure 5 show an increase in 13C-bicarbonate detected after DCA administration. The scaling is such that pyruvate-hydrate is the same height in all the spectra, serving as a reference for visualizing the changes in bicarbonate levels. The bottom of Figure 5 shows the bicarb/tCar data for all 5 rats studied. For 2 of the rats, bicarb/tCar increased substantially and then decreased (but still remained above baseline levels). For the other 3 rats, bicarb/tCar increased substantially and then increased again. In all cases, there was a significant increase in bicarb/tCar at both the 5 minute (1 min post-DCA) and 10 minute (6 mins post-DCA) time points.
Figure 5.
Changes in bicarbonate levels as a result of DCA administration. Hyperpolarized [1-13C]pyruvate injections occurred at 0, 5, and 10 minutes. DCA was administered at the 4 minute mark. The top row shows the increases in bicarbonate for one of the 5 rats studied. The spectra are scaled so that pyruvate-hydrate serves as a reference for visualization. The bottom portion shows the changes in bicarb/tCar for all 5 rats studied. A substantial increase in bicarb/tCar was detected for all rats at both 1 minute and 6 minutes after DCA administration.
Table 3.
Percent Change (Mean and Standard Deviation) in Metabolite Levels from Baseline (Time = 0 Min) Scan for DCA MRS Experiments.
| Time = 5 min (1 min post-DCA) [n = 5] |
Time = 10 min (6 min post-DCA) [n = 5] |
P-value | |
|---|---|---|---|
| Lac/tCar | +22.8 ± 15.3 | +7.5 ± 20.6 | 0.133 |
| Ala/tCar | −21.4 ± 10.5 | −25.2 ± 7.3 | 0.040* |
| Pyr/tCar | −0.2 ± 6.1 | +3.2 ± 5.7 | 0.449 |
| Bicarb/tCar | +121.6 ± 64.4 | +107.9 ± 41.7 | 0.0096* |
The changes in bicarb/tCar shown in Figure 5 and Table 3 are dramatic when compared to the bicarb/tCar values shown in the bottom right graph in Figure 2 and in Table 1. The p-value for bicarb/tCar was very low, indicating a highly significant difference post-DCA versus baseline.
Discussion
The capability to acquire in vivo hyperpolarized carbon-13 data from rapid, sequential multiple injections was demonstrated for the first time using a new multi-sample polarizer designed for clinical studies (7). Due to time and logistical constraints, some of the animal serial data sets included 4 injections while others included only 3, which was the minimum number of injections required for data to be used in the analysis. In this initial study, the time separation between injections was 5 minutes, but this could be reduced to <1 minute given the current software setup of our polarizer system, and in principle could be even less. The data were consistent across shots, suggesting that rat physiology stabilizes quickly and that each injection minimally perturbed normal rat metabolism as detected by hyperpolarized pyruvate MR. These initial data from healthy animals demonstrated feasibility and serve as preliminary data for the design of future studies. For example, the rapid, multiple injection capability could allow drug dynamics to be studied on the time scale of drug action in the body as well as monitoring reperfusion following ischemia with higher temporal resolution.
Although none of the p-values listed in Table 1 rise to the level of statistical significance, the values for lac/tCar, ala/tCar, lac/pyr, and ala/pyr are close to 0.05, indicating the plausibility of lactate and alanine levels changing slightly over time. The p-values are similar to those for overall lac/tCar and ala/tCar in Table 2 and lac/tCar and ala/tCar in Table 3. A statistically significant decrease in ala/tCar is shown in Tables 2 and 3. One important difference in the data among the tables is that the dynamic MRS sequence started upon injection (data for Tables 1 and 3), and the 3D-EPSI HP-MR sequence (data for Table 2) was acquired with a 25 second delay. After 25 seconds, hyperpolarized pyruvate levels decrease relative to the other metabolites due to spin-lattice relaxation and metabolic conversion. This also explains the differences in absolute lac/tCar, ala/tCar, and pyr/tCar levels in Figures 2 and 4. Another possibility, which is suggested by the data in Table 2, is that the statistically significant differences arise from certain organs. As Table 2 shows, there were statistically significant changes for ala/tCar in liver and muscle tissue and statistically significant changes for lac/tCar in the GI tract. Most importantly, the changes in lactate and alanine levels, if they do exist, are modest and do not interfere with the ability to monitor the metabolic effects of physiological interventions. This is demonstrated by the DCA experiments, in which the changes in bicarb/tCar shown in Table 3 are substantially greater and more significant than those shown in Table 1. Thus, the rapid, sequential injection approach did not confound the ability to measure the pharmacodynamics of DCA. Interestingly, the percent change standard deviations for bicarbonate (Tables 1 and 3) were greater than for other metabolites. This is most likely due to the bicarbonate peak being much lower in amplitude than the other peaks. Thus, a given amount of noise would have a greater effect in terms of percentage on bicarbonate. Hyperpolarized cancer studies with this approach would also be feasible given the small changes in lactate observed in this study and the large increases in lactate cited in previous reports of cancer animal models (3–6). For these trials, initial pilot studies would need to be conducted to determine the sample size required to achieve the desired statistical power.
Currently, a manual process is used to put the pyruvic acid and radical solution into the dissolution vial and connect the fluid path. (See Reference 7 for diagrams of the fluid path.) For future clinical use, compounding and filling will take place in a sterile environment, and the vial and fluid path would be delivered as a pre-assembled package to be loaded into the polarizer. In addition, for the experiments in this study, after dissolutions, the fluid path was flushed and dried so that it could be used multiple times.
Hyperpolarized 13C metabolic imaging has several advantages, such as high sensitivity, no background signal, and no ionizing radiation. It could become widely applicable in that use of hyperpolarized 13C technology to monitor metabolism could substantially impact the diagnosis, staging, and measurement of response to therapy of disease (2). Multiple injection capability, the feasibility of which was demonstrated in this study, adds another dimension to the ways in which hyperpolarized technology can be used to probe metabolism. This study demonstrated the capability to detect an effect of the drug dichloroacetate (DCA) after 1 minute of treatment. The results in this initial project validated the rapid, sequential injection methodology, and future studies will seek to utilize this capability in novel disease studies.
Conclusions
The capability to acquire in vivo hyperpolarized carbon-13 data from rapid, sequential in vivo injections was demonstrated for the first time. Minimal perturbations in spectral profiles were detected from normal untreated rats over the course of 4 hyperpolarized [1-13C]pyruvate injections spaced 5 minutes apart, indicating such an approach would not confound the investigation of metabolism occurring on this time scale. This new hyperpolarized methodology was used to show in vivo hyperpolarized bicarbonate increased dramatically 1 minute after administration of the drug DCA. The results in normal rats in these experiments may provide the basis for future disease studies.
Acknowledgments
The authors thank Dr. James Tropp for designing and building the coil used in this study. This study was supported by NIH grant P41EB013598 for the metabolic imaging studies and S10RR029570 for the multi-sample polarizer equipment.
Footnotes
Publisher's Disclaimer: This is a PDF file of an unedited manuscript that has been accepted for publication. As a service to our customers we are providing this early version of the manuscript. The manuscript will undergo copyediting, typesetting, and review of the resulting proof before it is published in its final citable form. Please note that during the production process errors may be discovered which could affect the content, and all legal disclaimers that apply to the journal pertain.
References
- 1.Ardenkjaer-Larsen JH, Fridlund B, Gram A, Hansson G, Hansson L, Lerche MH, Servin R, Thaning M, Golman K. Increase in signal-to-noise ratio of >10,000 times in liquid-state NMR. Proc Natl Acad Sci. 2003;100:10158–10163. doi: 10.1073/pnas.1733835100. [DOI] [PMC free article] [PubMed] [Google Scholar]
- 2.Kurhanewicz J, Vigneron DB, Brindle K, Chekmenev EY, Comment A, Cunningham CH, Deberardinis RJ, Green GG, Leach MO, Rajan SS, Rizi RR, Ross BD, Warren WS, Malloy CR. Analysis of cancer metabolism by imaging hyperpolarized nuclei: prospects for translation to clinical research. Neoplasia. 2011;13:81–97. doi: 10.1593/neo.101102. [DOI] [PMC free article] [PubMed] [Google Scholar]
- 3.Golman K, Zandt RI, Lerche M, Pehrson R, Ardenkjaer-Larsen JH. Metabolic imaging by hyperpolarized 13C magnetic resonance imaging for in vivo tumor diagnosis. Cancer Res. 2006;66:10855–10860. doi: 10.1158/0008-5472.CAN-06-2564. [DOI] [PubMed] [Google Scholar]
- 4.Day SE, Kettunen MI, Gallagher FA, Hu DE, Lerche M, Wolber J, Golman K, Ardenkjaer-Larsen JH, Brindle KM. Detecting tumor response to treatment using hyperpolarized 13C magnetic resonance imaging and spectroscopy. Nat Med. 2007;13:1382–1387. doi: 10.1038/nm1650. [DOI] [PubMed] [Google Scholar]
- 5.Albers MJ, Bok R, Chen AP, Cunningham CH, Zierhut ML, Zhang V, Kohler SJ, Tropp J, Hurd RE, Yen Y, Nelson SJ, Vigneron DB, Kurhanewicz J. Hyperpolarized 13C lactate, pyruvate, and alanine: noninvasive biomarkers for prostate cancer detection and grading. Cancer Res. 2008;68:8607–8615. doi: 10.1158/0008-5472.CAN-08-0749. [DOI] [PMC free article] [PubMed] [Google Scholar]
- 6.Hu S, Balakrishnan A, Bok RA, Anderton B, Larson PEZ, Nelson SJ, Kurhanewicz J, Vigneron DB, Goga A. 13C-Pyruvate imaging reveals alterations in glycolysis that precede tumor formation and regression. Cell Metab. 2011;14:131–142. doi: 10.1016/j.cmet.2011.04.012. [DOI] [PMC free article] [PubMed] [Google Scholar]
- 7.Ardenkjaer-Larsen JH, Leach AM, Clarke N, Urbahn J, Anderson D, Skloss TW. Dynamic nuclear polarization polarizer for sterile use intent. NMR Biomed. 2011;24:927–932. doi: 10.1002/nbm.1682. [DOI] [PubMed] [Google Scholar]
- 8.Michelakis ED, Webster L, Mackey JR. Dichloroacetate (DCA) as a potential metabolic-targeting therapy for cancer. Brit J Cancer. 2008;99:989–994. doi: 10.1038/sj.bjc.6604554. [DOI] [PMC free article] [PubMed] [Google Scholar]
- 9.Michelakis ED, Sutendra G, Dromparis P, Webster L, Haromy A, Niven E, Maguire C, Gammer TL, Mackey JR, Fulton D, Abdulkarim B, McMurtry MS, Petruk KC. Metabolic modulation of glioblastoma with dichloroacetate. Sci Transl Med. 2010;2:31ra34. doi: 10.1126/scitranslmed.3000677. [DOI] [PubMed] [Google Scholar]
- 10.Hu S, Yoshihara HAI, Bok R, Zhou J, Zhu M, Kurhanewicz J, Vigneron DB. Use of hyperpolarized [1-13C]pyruvate and [2-13C]pyruvate to probe the effects of the anticancer agent dichloroacetate on mitochondrial metabolism in vivo in the normal rat. Magn Reson Imag. 2012 doi: 10.1016/j.mri.2012.05.012. (In Press) [DOI] [PMC free article] [PubMed] [Google Scholar]
- 11.Derby K, Tropp J, Hawryszko C. Design and evaluation of a novel dual-tuned resonator for spectroscopic imaging. J Magn Reson. 1990;86:645–651. [Google Scholar]
- 12.Cunningham CH, Chen AP, Albers MJ, Kurhanewicz J, Hurd RE, Yen Y, Pauly JM, Nelson SJ, Vigneron DB. Double spin-echo sequence for rapid spectroscopic imaging of hyperpolarized 13C. J Magn Reson. 2007;187:357–362. doi: 10.1016/j.jmr.2007.05.014. [DOI] [PubMed] [Google Scholar]
- 13.Hu S, Chen AP, Zierhut ML, Bok R, Yen Y, Schroeder MA, Hurd RE, Nelson SJ, Kurhanewicz J, Vigneron DB. In vivo carbon-13 dynamic MRS and MRSI of normal and fasted rat liver with hyperpolarized 13C-pyruvate. Mol Imaging Biol. 2009;11:399–407. doi: 10.1007/s11307-009-0218-z. [DOI] [PMC free article] [PubMed] [Google Scholar]


