Abstract
We investigated the contribution of the middle ear to the physiological response to bone conduction stimuli in chinchilla. We measured intracochlear sound pressure in response to air conduction (AC) and bone conduction (BC) stimuli before and after interruption of the ossicular chain at the incudo-stapedial joint. Interruption of the chain effectively decouples the external and middle ear from the inner ear and significantly reduces the contributions of the outer ear and middle ear to the bone conduction response. With AC stimulation, both the scala vestibuli Psv and scala tympani Pst sound pressures drop by 30 to 40 dB after the interruption. In BC stimulation, Psv decreases after interruption by about 10 to 20 dB, but Pst is little affected. This difference in the sensitivity of the BC induced Psv and Pst to ossicular interruption is not consistent with a BC response to ossicular motion, but instead suggests a significant contribution of an inner-ear drive (e.g. cochlear fluid inertia or compressibility) to the BC response.
Keywords: Bone conduction, ossicular and fluid inertia, cochlear compression, Ossicular interruption
1. Introduction
Bone conduction hearing is a perceptual phenomenon that is caused by vibration of the bones of the skull. Three major components have been defined in the transmission of bone conducted sound: the outer ear, middle ear and inner ear. The contribution of the outer ear in bone conduction is explained by compression of the cartilaginous and bony walls of the ear canal during skull vibration. Compression of the walls gives off sound energy, which modifies the sound pressure in the ear canal. The ear canal’s contribution to bone conduction hearing is best understood in terms of the occlusion effect where the sensitivity to bone conducted stimuli increases after the ear canal is occluded (Tonndorf, 1972). The contribution of the middle ear in bone conduction is usually associated with inertial response of the middle ear ossicles (Barany, 1938; Wever and Lawrence, 1954). The loose coupling between the ossicles and the head allows relative motion between the skull and the ossicles. The contribution of the inner ear to bone conduction is explained by distortional vibrations of the cochlear shell (Tonndorf, 1962) as well the inertia of the cochlear fluid in the skull (Wever and Lawrence, 1954; Stenfelt and Goode, 2005). Small deformations of the cochlear wall produced by distortional vibrations or the movements of cochlear fluid that result from inertia lead to fluid motion in the inner ear that evokes a pressure difference across the cochlear partition thus exciting the partition just as sound transduction through the acoustic pathway.
While theoretical mechanisms for each of these putative pathways have been suggested, the significance and relative importance of each pathway is still unresolved. The importance of outer-ear compression is greatly affected by opening or closing the ear canal and is generally thought to be of minor influence when the ear canal is open (Tonndorf 1972; Khanna et al. 1976; Stenfelt et al. 2003). While Barany (1938), Huizing (1960), and more recently Stenfelt et al. (2002) stressed the importance of ossicular and inner-ear fluid inertia to bone conduction, Tonndorf (1962, 1972) argued that distortion of the inner ear can have a significant effect on cochlear fluid motion. In the normal ear, all these mechanisms coexist and combine to cause hearing sensation. However, in a pathological ear when parts of the ear are missing, bone conduction response can be altered.
To separate some of the different bone-conduction stimulus components, we simulated the pathological condition where the middle ear ossicular chain is interrupted and studied the response of the ear to air and bone conducted sound before and after interruption. We hypothesize that by severing the ossicular chain, the contribution of the outer ear and middle ear in bone conduction is greatly reduced, thus allowing us to assess their relative importance to bone conduction. Using mechanical measurements such as stapes velocity to separate out the contribution of different stimulus components has been difficult because bone-conduction vibrators induce motions of the skull and petrous bone (e.g. Kim et al. 2011) that are similar in magnitude to the stimulus-related motion of the middle ear ossicles. The mechanical components of the cochlear response that we use to assess the contributors to bone conducted sound are the sound pressures in scala vestibuli and scala tympani denoted as Psv and Pst respectively. These pressures are measured with miniature fiber-optic pressure sensors (Olson, 1998) placed in the two scalae in the cochlear base. These measurements allow us to compute the intracochlear differential sound pressure ΔP = Psv − Pst in the cochlear base, a measure of the effective input to the cochlea. These differential intracochlear pressure measurements have the advantage over stapes velocity measurements in that they give a better estimate of the cochlear response in cases where the ossicular system is not the primary drive to the inner ear.
In this paper, we present measurements of Psv and Pst in chinchilla with two different modes of stimuli: air conduction and bone conduction. The responses to bone conduction are unique, while comparison of our air conduction results will be made with Ravicz et al. 2010. The change in measurements of Psv, Pst and ΔP after the middle-ear ossicles are interrupted will enable the investigation of the importance of the middle ear to BC perception in chinchilla.
2. Methods
Animal preparation
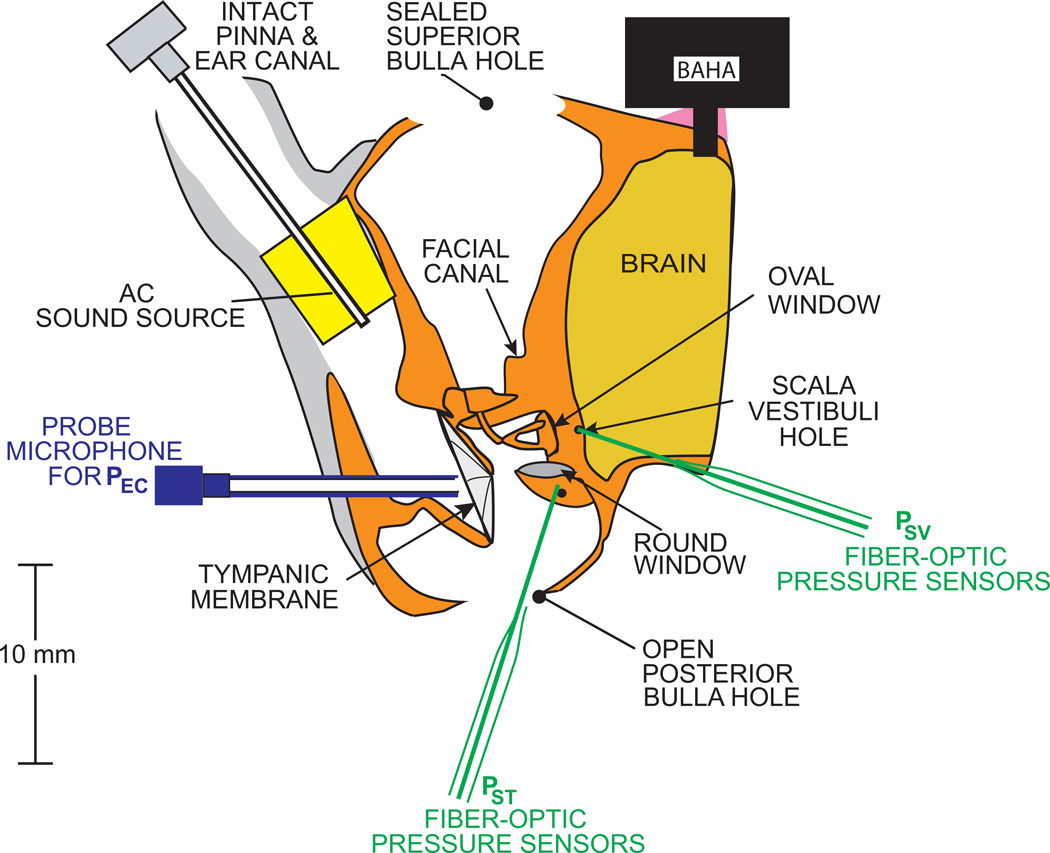
The experiments were reviewed and approved by the Animal Care Committee of the MEEI. Data were collected from five female chinchillas between 0.4 and 0.8 kg of bodyweight. A detailed description of the animal preparation has been reported (e. g. Songer and Rosowski, 2006). However, there were some modifications in this study, so we summarize the preparation here. The animals were anesthetized with Pentobarbital (50mg/kg) and Ketamine (40mg/kg), and their tracheas were cannulated. The superior and posterior middle ear cavities were opened. The tendon of the tensor tympani muscle was cut and the tympanic-portion of the VIIth nerve was sectioned to immobilize the stapedius muscle to prevent random contraction that can affect results (Rosowski et al., 2006). The bony wall lateral and posterior to the round window (RW) was removed to visualize (a) the surface of the window, and (b) the stapes footplate. The external ear was left intact, but a probe-tube microphone was inserted and sealed in place in the lateral end of the intact cartilaginous and bony ear canal near the tympanic membrane (TM) to measure ear canal pressure (Pec) within 1–2 mm of the umbo of the malleus. Figure 1 shows our animal preparation and experimental setup.
Figure 1.
Animal preparation and experimental setup
Acoustic and vibration stimuli
Acoustic stimuli were presented to the ear canal via an ER3A insert earphone. The bone conduction stimuli were transduced by a BAHA, or Bone-Anchored Hearing Aid (Cochlear BAHA BP100) that was fixed to the chinchilla skull near the vertex. Since the chinchilla skull is thin, the standard 3 mm titanium screw was inserted only 1 mm deep into the skull and dental cement was used as a foundation and space filler to hold the screw in place. The sound processor and vibrator were attached to the screw. The BAHA was in its ‘music input’ where electrical stimuli are presented directly to the vibration processor and the microphone input to the processor is muted. The BAHA was programmed for ‘linear’ operation over the range of stimuli which we used. The stimulus voltage input to either the ER3A or the BAHA were generated via a National Instruments I/O board controlled by a custom built LabView program. A TDT-programmable attenuator was used to control stimulus level. The measurement protocol called for simultaneous measurements of Pec, Psv, Pst during repeated presentations of stepped pure tones of 100 Hz to 10 kHz at 24 points/octave.
Sensor calibration
Water calibrations of the pressure sensors were performed to determine their sensitivity. The sensor tips were submerged 5 mm deep into a column of water sitting on a shaker head and accelerometer (Bruel and Kjaer 4290 – see Olson, 1998). Measurements of sensor frequency response are determined from presentations of stepped sinusoids of the 100 Hz to 10 kHz that are input to the accelerometer. Stability of the pressure sensor is ensured by performing calibrations before and after each series of measurements during the experiment.
Experimental procedure
To measure scala vestibuli pressure Psv, a small hole (less than 250 um in diameter) was made in the vestibule adjacent to the utricle after removal and retraction of a portion of the cerebellum posterior and medial to the vestibule. After calibration, the sensor was inserted 150–300 um deep into the hole within a few millimeters of the oval window. A second hole made in the cochlear base near the round window was used to measure scala tympani pressure Pst. Measurements of Pec, Psv and Pst were made with tone sequences in both air conduction and bone conduction, before and after the holes were sealed with alginate impression material. Measurements made at a variety of stimulus levels (over a 20 dB range) were consistent with linear responses. Once we established a good series of stable pressure sensor measurements in the normal condition with an intact ossicular chain, we manipulated the middle ear using a tendon knife to interrupt the incudo-stapedial joint (IS-joint). After the interruption, measurements of Pec, Psv and Pst were repeated in both AC and BC. All of the Psv and Pst measurement data reported here were taken with both sensors sealed in place with alginate dental impression material (Jeltrate ®).
Data analysis
The pressure sensors were calibrated before and after each measurement series. Data reported in this paper excluded any change in the sensitivity of the pressure sensors before and after each series that was greater than 2 dB.
3. Results
For comparison with other measurements taken in different ears, our air conduction data were normalized by the ear canal pressure Pec. Bone conduction data were normalized by the voltage used to drive the BAHA. In three experiments we used laser Doppler vibrometer measurements of the skull near the vibrator to assess the consistency of the stimulator. The velocity measurements were virtually identical in the three specimens.
Intracochlear sound pressure measurements in AC
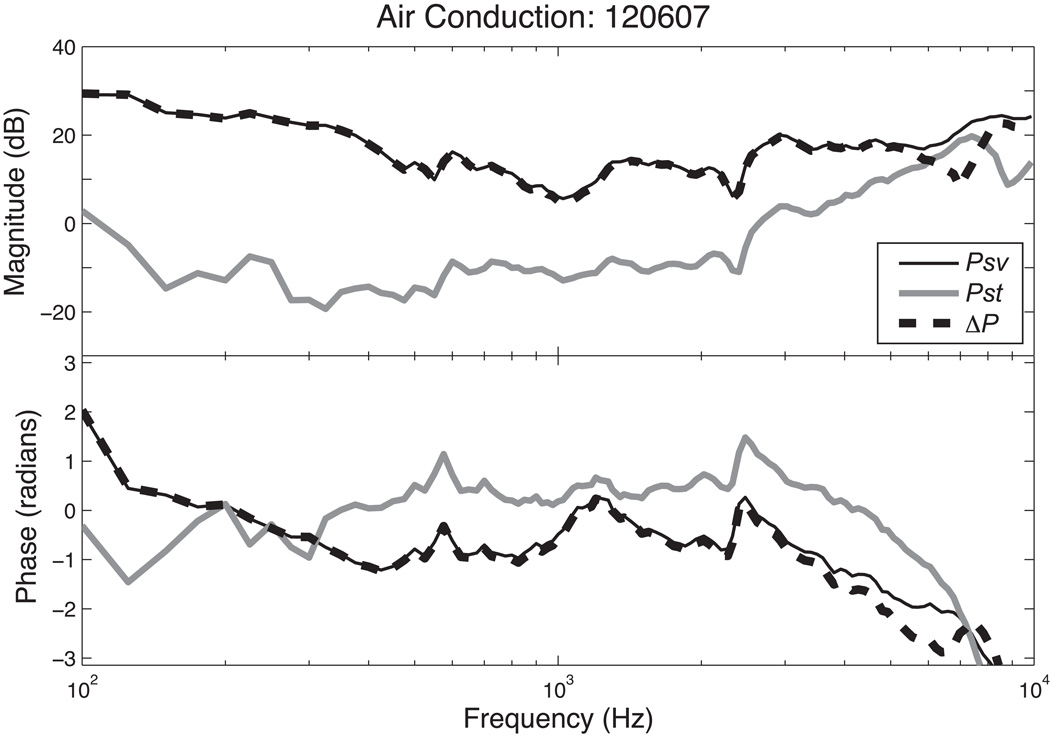
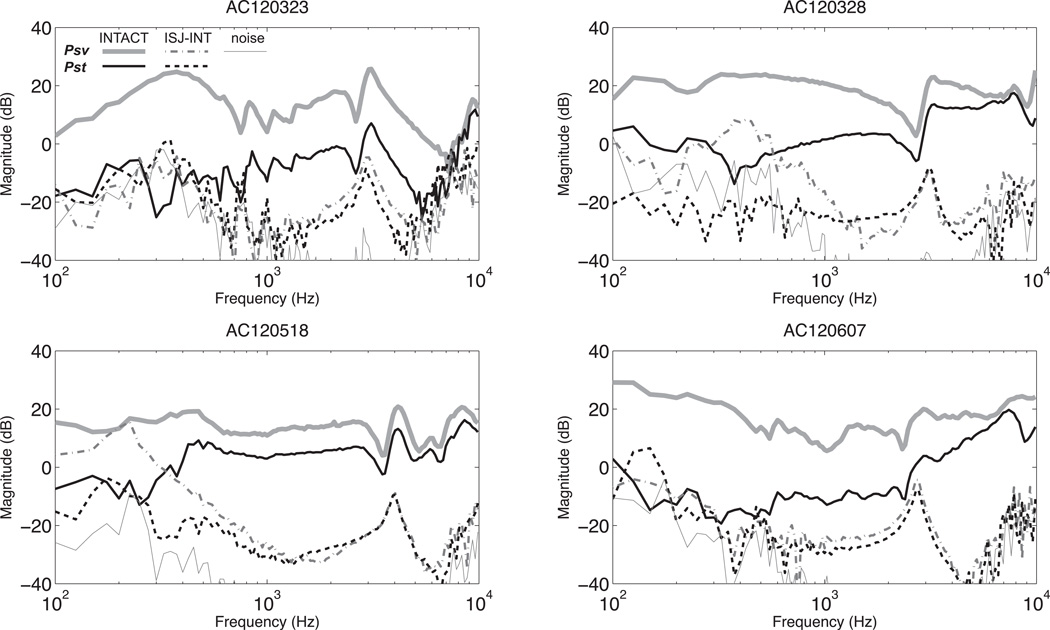
With air-conducted sound at frequencies less than 2 kHz, the sound pressure in scala tympani Pst is 20 to 40 dB lower than scala vestibuli pressure Psv (see Figure 2 & 4). With higher frequency AC stimulation the two pressures began to converge with the differences in pressure magnitude decreasing as frequency increased. However, throughout the measurement range, the magnitude of Psv was always larger than that of Pst. The intracochlear differential sound pressure ΔP was computed as the difference between Psv and Pst (Figure 2). The frequency response of ΔP is almost identical to that of Psv because Psv is larger than Pst. Indeed in AC stimulation, ΔP is nearly independent of Pst, except at the highest frequency. The phases of Psv and Pst relative to the phase of the sound pressure in the ear canal are relatively constant up to 3 kHz with Psv lagging Pst by about a radian at frequencies below 8 kHz. As in the magnitude comparison, the phase of the ΔP is the nearly identical to the phase of Psv at frequencies where the magnitude of Psv is significantly larger than the magnitude of Pst.
Figure 2.
Normalized Psv, Pst and ΔP with air conduction stimulation in animal 120607.
Figure 4.
Normalized Psv, and Pst with AC stimulation before (INTACT) and after IS-joint interruption (ISJ-INT) in four ears. Each panel also contains an estimate of the noise measured in the joint interrupted condition.
Intracochlear sound pressure measurements in BC
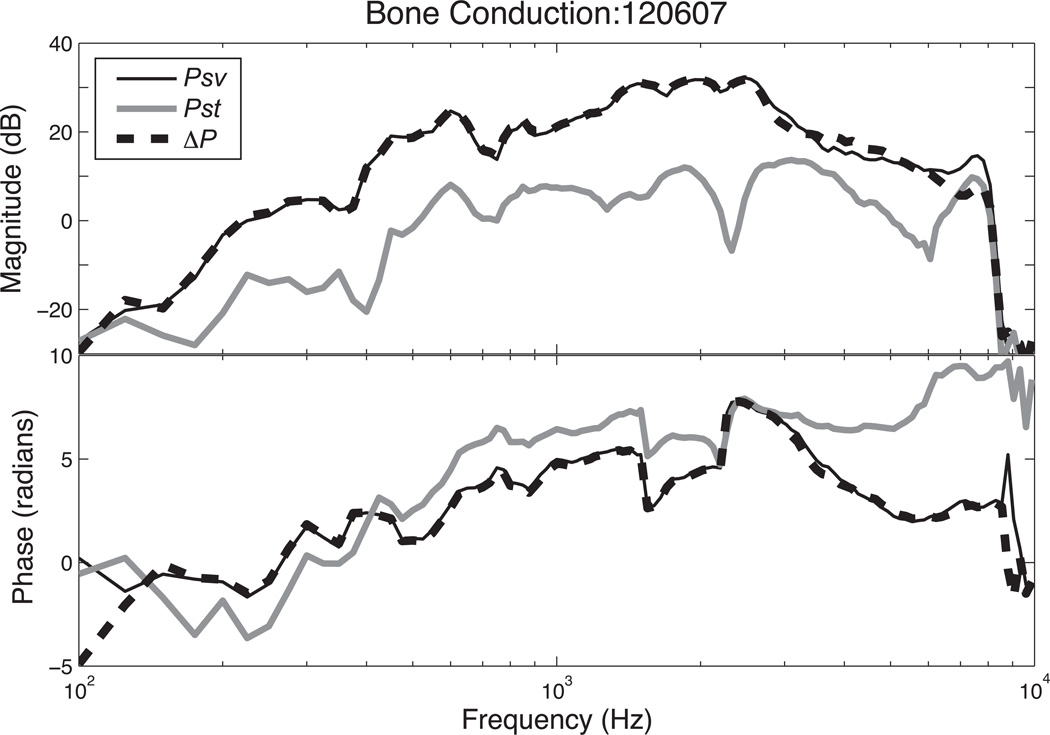
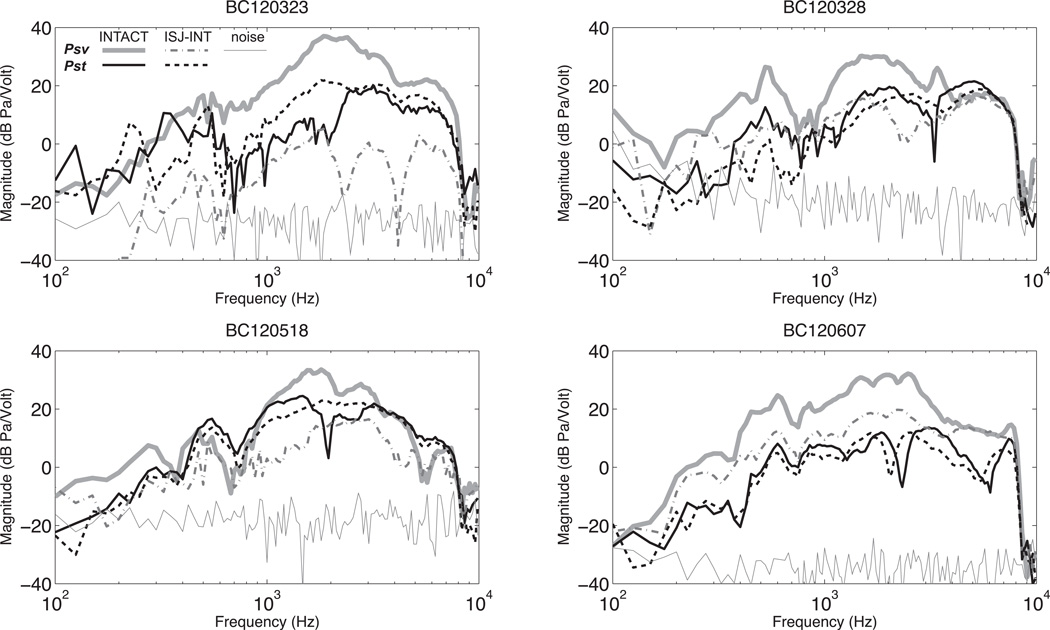
In bone conduction we see smaller differences between Psv and Pst in normal ears: Psv is generally only 10 to 20 dB greater than Pst (Figures 3 & 6). The frequency responses of the pressures normalized by stimulus voltage are parallel, which differs from that of AC where they both converge at higher frequencies. The intracochlear differential sound pressure ΔP is nearly identical to the Psv curve since the magnitude of Psv is significantly larger than Pst at most frequencies. The drop-off in both Psv and Pst magnitudes above 8 kHz results from a decrease in the output of the BAHA at that point. Because the BAHA output contains a significant delay which leads to the accumulation of a large number of cycles in output phase over the measurement range, we normalize the phases of Psv, Pst and ΔP in Figure 3 by the phase of the velocity of the head that results from BAHA activation. After this normalization, all three of the pressure phases are of similar value (they vary by less than π/2 radians over much of the measured range, Figure 3), and all three of the plotted pressures demonstrate an increasing phase lead as frequency increases.
Figure 3.
Psv, Pst and ΔP with Bone Conduction stimuli in animal 120607. Because of rapidly accumulating phase of the output of the BAHA as frequency increases, the phases in this plot have been normalized by the phase of the skull velocity produced by the BAHA.
Figure 6.
Psv and, Pst with BC stimulation before and after IS-joint interruption.
Effects of middle-ear ossicular chain interruption on Psv, Pst and ΔP in AC
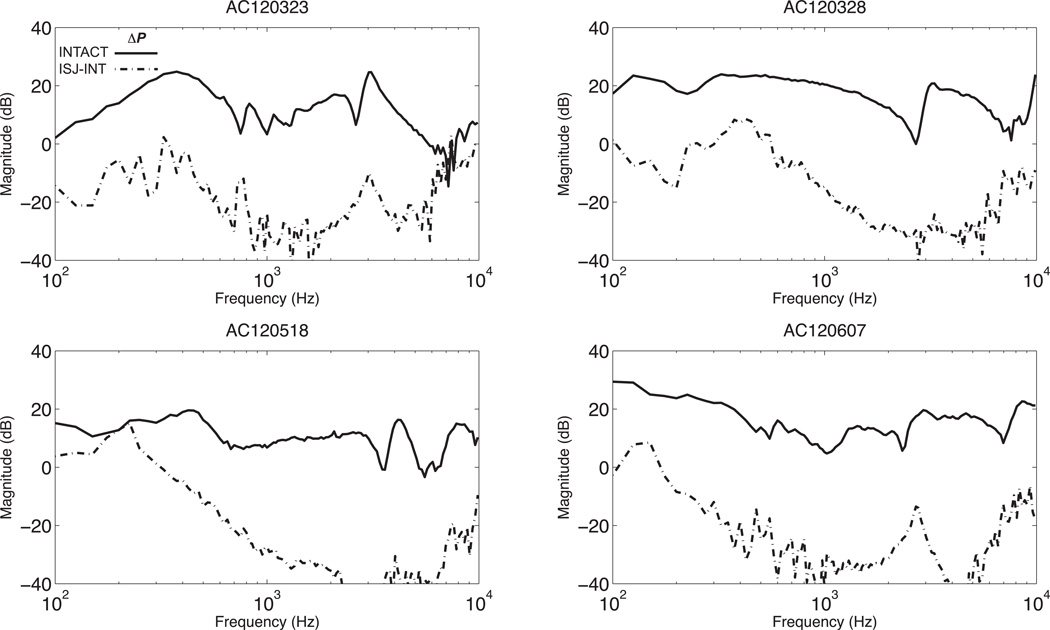
Figure 4 shows Psv and Pst with AC stimulation in four ears measured before and after the interruption of the middle-ear ossicular chain. All four ears show a similar pattern in which after interruption, Psv measurement drops by as much as 40 dB with a smaller decrease in Pst. However, both Psv and Pst drop to the same measurable level, which is close to the measurement noise floor. (The noise floor has been estimated from the magnitude frequency components nearby the stimulus frequency.) The intracochlear differential sound pressure ΔP before and after the interruption with AC stimulation are shown in Figure 5. ΔP decreases by 40 dB after IS-joint interruption.
Figure 5.
Intracochlear differential sound pressure, ΔP with AC stimulation before and after IS-joint interruption (solid line is before and dashed is after the interruption).
Effects of middle-ear ossicular chain interruption on Psv, Pst and ΔP in BC
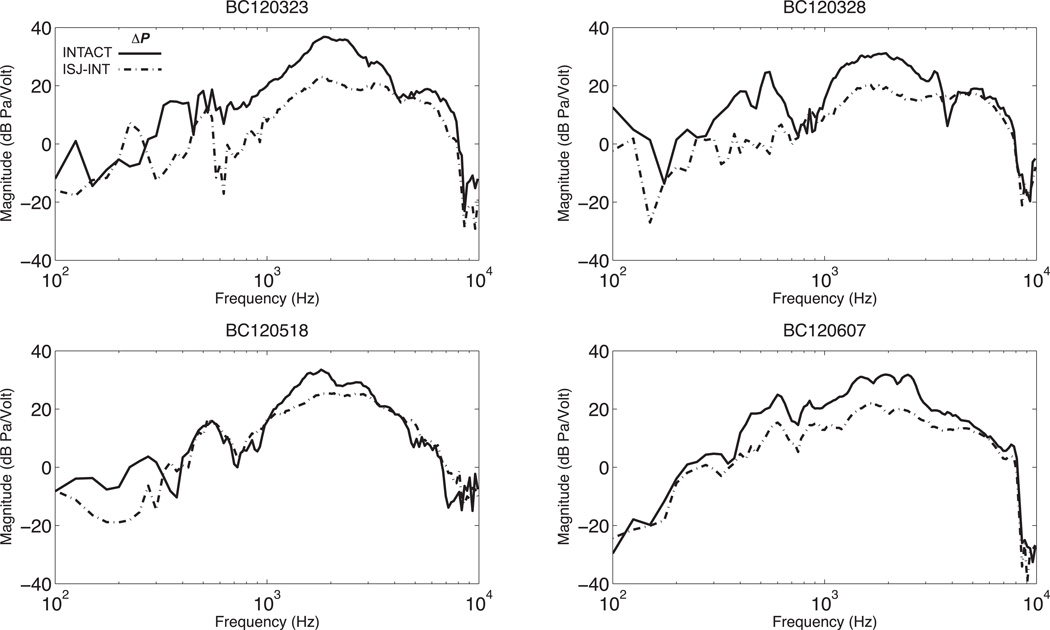
Figure 6 illustrates the effects of middle-ear ossicular interruption in BC, which are smaller than in AC. In BC Psv decreases by 20 dB on average, while Pst is little affected. Because Psv in bone conduction falls only by about 20 dB and Pst is relatively unchanged, there is only a small (~10 dB) decrease in ΔP after joint interruption (see figure 7).
Figure 7.
Intracochlear differential sound pressure, ΔP with BC stimulation before and after IS-joint interruption (solid line is before and dashed is after the interruption).
4. Summary and Interpretation
In air conduction, there is generally one pathway through which the acoustic signal reaches the inner ear. Sound waves enter the ear canal and vibrate the TM and middle-ear ossicular chain, thus stimulating the inner ear fluid. In bone conduction, there are different pathways through which skull vibration can stimulate the inner ear fluid. By interrupting the ossicular joints, we significantly reduce the contribution of the outer and middle ear.
Our results show a large (30–40 dB) decrease in Psv, Pst and ΔP after the interruption when the ear is stimulated with air conduction. This is expected because the driving source is now uncoupled from the inner ear. When the ear is stimulated with bone conduction, multiple sources can act together to stimulate the inner ear. Our results show that interruption causes Psv to decrease by generally less than 20 dB, while Pst is little affected (changes of +/− 5 dB). The decrease in Psv can be explained by two possible scenarios. One is that the middle ear contribution in bone conduction is now significantly reduced because of the interruption of the ossicles. The other scenario is that the impedance seen at the oval window by inner-ear sound sources is reduced after IS-joint interruption because of the removal of the impedance associated with moving the ossicles and TM. Associated with this reduced impedance is a decrease in the scala vestibuli sound pressure that results from fluid movement caused by inner ear bone conduction sources. It could also be that these two act in combination after the middle ear ossicular chain is cut. However, if the middle ear plays a dominant role in normal bone-conducted Psv, we would expect bone-conducted Pst to decrease in a similar manner, as it does in air conduction. Since our results show bone-conducted Pst is little affected by joint interruption, our data are more consistent with the idea that the dominant source controlling Psv and Pst in bone conduction resides in the inner ear.
5. Discussion
Comparison with Ravicz et al. 2010
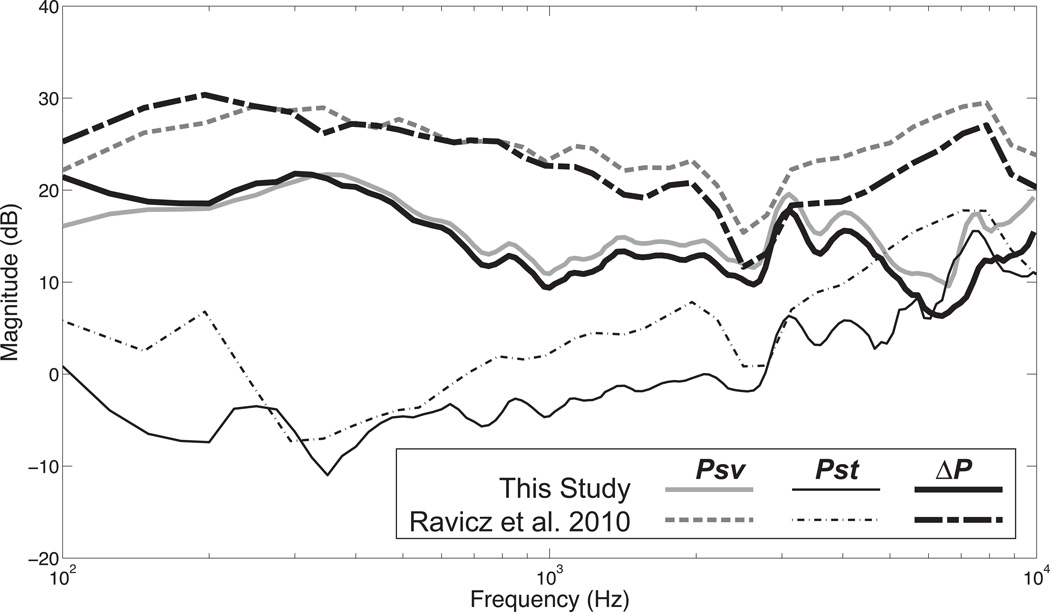
We can compare the average of our intracochlear sound pressure measurements of Psv, Pst and ΔP in air conduction to those of Ravicz et al. (2010). Figure 8 illustrates that our Psv and ΔP (which is dominated by Psv) are lower by about 10 dB overall. One potential difference might be our placement of the scala vestibuli sensor. We accessed the vestibule by the retraction of the cerebellum from the superior cavity while his approach was from the posterior cavity. The measurements of Pst look more similar.
Figure 8.
Normalized average Psv, Pst and ΔP from this study are compared to the average of similar measurements from Ravicz et al. (2010).
Artifact generated by the relative motion between the shaking of the whole bone and the fixed held pressure sensors
There is concern that a ‘bone shaking’ artifact (similar to the sound pressure induced by the moving column of fluid used in calibrating the probe) could contribute to our measurement of the sound pressure inside the cochlea, since our sensors are loosely held in place while the whole head is shaking. Our placement of alginate impression material around the sensor holes not only helps with sealing the hole around the sensor, which could adversely affect the pressure measurements, but also helps keep the sensor in place. However, the alginate may not be firm enough to avoid relative motion between the shaking bone and the sensor, thus creating an artifact which can affect our intracochlear sound pressure measurements. One argument against such an artifact is that it would be unlikely to change because of interruption of the middle ear ossicles. A second argument is that it is not clear how such an artifact would induce a differential effect of interruption on Psv and Pst.
Highlights.
Intracochlear sound pressures were measured in response to bone-conducted sound
The sound pressures in the vestibule and scala tympani differ in magnitude
Ossicular interruption reduces the bone conducted sound pressure in the vestibule
Ossicular interruption has small effects on the sound pressure in scala tympani
Highlights.
Measurements of intracochlear sound pressure difference suggest that inner-ear sources dominate the response to bone-conducted sound in chinchillas.
Acknowledgements
We would like to thank Heidi Nakajima, Mike Ravicz and Christof Stieger for useful discussions about this work.
Abbreviations
- AC
air conduction
- BC
bone conduction
- Psv
scala vestibuli
- Pst
scala tympani
- ΔP = Psv − Pst
intracochlear differential sound pressure
- TM
tympanic membrane
- Pec
ear canal pressure
- IS-joint
incudo-stapedial joint
- INT
interrupted
Footnotes
Publisher's Disclaimer: This is a PDF file of an unedited manuscript that has been accepted for publication. As a service to our customers we are providing this early version of the manuscript. The manuscript will undergo copyediting, typesetting, and review of the resulting proof before it is published in its final citable form. Please note that during the production process errors may be discovered which could affect the content, and all legal disclaimers that apply to the journal pertain.
References
- Barany E. A contribution to the physiology of bone conduction. Acta Oto-Laryngol., Suppl. 1938;26:1–223. [Google Scholar]
- Huizing EH. Bone conduction - the influence of the middle ear. Acta Oto-Laryngol., Suppl. 1960;155:1–99. [PubMed] [Google Scholar]
- Khanna SM, Tonndorf J, Queller JE. Mechanical parameters of hearing by bone conduction. J. Acoust. Soc. Am. 1976;60:139–154. doi: 10.1121/1.381081. [DOI] [PubMed] [Google Scholar]
- Kim N, Homma K, Puria S. Inertial bone conduction: symmetric and anti-symmetric components. J. Assoc. Res. Otolaryngol. 2011;12:261–279. doi: 10.1007/s10162-011-0258-3. [DOI] [PMC free article] [PubMed] [Google Scholar]
- Olson ES. Observing middle and inner mechanics with novel intracochlear pressure sensors. J. Acoust. Soc. Am. 1998;103:3445–3463. doi: 10.1121/1.423083. [DOI] [PubMed] [Google Scholar]
- Ravicz ME, Slama MCC, Rosowski JJ. Middle-ear pressure gain and cochlear partition differential pressure in chinchilla. Hear. Res. 2010;263:16–25. doi: 10.1016/j.heares.2009.11.014. [DOI] [PMC free article] [PubMed] [Google Scholar]
- Rosowski JJ, Ravicz ME, Songer JE. Structures that contribute to middle-ear admittance in chinchilla. J. Comp. Physiol. A. 2006;192:1287–1311. doi: 10.1007/s00359-006-0159-9. [DOI] [PMC free article] [PubMed] [Google Scholar]
- Songer JE, Rosowski JJ. The effect of superior-canal opening on middle-ear input admittance and air-conducted stapes velocity in chinchilla. J. Acoust. Soc. Am. 2006;120:258–269. doi: 10.1121/1.2204356. [DOI] [PMC free article] [PubMed] [Google Scholar]
- Stenfelt S, Goode RL. Bone-conducted sound: physiological and clinical aspects. Otol. Neurotol. 2005;26:1245–1261. doi: 10.1097/01.mao.0000187236.10842.d5. [DOI] [PubMed] [Google Scholar]
- Stenfelt S, Hato N, Goode RL. Factors contributing to bone conduction: the middle ear. J. Acoust. Soc. Am. 2002;111:947–959. doi: 10.1121/1.1432977. [DOI] [PubMed] [Google Scholar]
- Stenfelt S, Wild T, Hato N, Goode RL. Factors contributing to bone conduction: the outer ear. J. Acoust. Soc. Am. 2003;113:902–913. doi: 10.1121/1.1534606. [DOI] [PubMed] [Google Scholar]
- Tonndorf J. Compressional bone conduction in cochlear models. J. Acoust. Soc. Am. 1962;34:1127–1131. [Google Scholar]
- Tonndorf J. Bone conduction. In: Tobias JV, editor. Foundations of Auditory Theory, Vol II. New York: Academic Press; 1972. pp. 197–237. [Google Scholar]
- Wever EG, Lawrence M. Physiological Acoustics. Princeton, NJ: Princeton University Press; 1954. [Google Scholar]


