

Abstract
β-Cell plasticity governs the adjustment of β-cell mass and function to ensure normoglycemia. The study of how β-cell mass is controlled and the identification of alternative sources of β-cells are active fields of research. β-Cell plasticity has been implicated in numerous physiological and pathological conditions. We developed a mice model in which we induced major β-cell mass atrophy by implanting insulin pellets (IPI) for 7 or 10 days. The implants were then removed (IPR) to observe the timing and characteristics of β-cell regeneration in parallel to changes in glycemia. Following IPR, the endocrine mass was reduced by 60% at day 7 and by 75% at day 10, and transient hyperglycemia was observed, which resolved within 1 wk. Five days after IPR, enhanced β-cell proliferation and an increased frequency of small islets were observed in 7-day IPI mice. β-Cell mass was fully restored after an additional 2 days. For the 10-day IPI group, β-cell and endocrine mass were no longer significantly different from those of the control group at 2 wk post-IPR. Furthermore, real-time quantitative PCR analysis of endocrine structures isolated by laser capture microdissection indicated sequentially enhanced expression of the pancreatic transcription factors β2/NeuroD and Pdx-1 post-IPR. Thus, our data suggest this mouse model of β-cell plasticity not only relies on replication but also involves enhanced cell differentiation plasticity.
Keywords: β-cell mass, pancreatic β-cell regeneration, laser capture microdissection, focal form of persistent hyperinsulinemic hypoglycemia of infancy
glucose homeostasis is achieved via the adaptation of β-cell function, β-cell mass, or both (1, 17, 19, 20). Studies aimed at understanding how β-cell mass is regulated and at identifying alternative sources of β-cells have shown that, at least under normal conditions during postnatal life, the control of β-cell mass relies mainly on β-cell proliferation (11). However, the possibility that neogenesis and transdifferentiation occur under particular experimental conditions (in rodents) or pathological conditions (in humans) remains a matter of debate and investigation (25, 43).
Glucose homeostasis is disrupted in patients with type 2 diabetes. Obesity and insulin resistance, which are often present in patients who subsequently develop diabetes, are generally accompanied by an increase in β-cell mass in response to the increased demand for insulin (6, 23, 29, 47). However, this compensatory adaptation subsequently becomes inadequate and diabetes ensues (27, 33). Although β-cell mass is only slightly reduced at the time of disease onset, the functional β-cell mass is insufficient at this time (33). Changes in β-cell mass are also observed in conditions other than diabetes. It has been shown in rodents that β-cell mass increases as an adaptation to the progressive insulin resistance that develops during pregnancy (21, 42), and this process involves both β-cell hypertrophy and increased β-cell proliferation. After parturition, β-cell mass decreases and returns to a normal level via increased levels of apoptosis, decreased proliferation, and reduced β-cell size (22, 37). In humans, there is also an adaptative increase of β-cell number during pregnancy although not as large as in rodents (5); moreover, in a morphometric analysis conducted on human pancreas obtained at autopsies from women who died while pregnant, Butler and colleagues concluded that neogenesis was the major source of increase of β-cell mass in pregnant women, whereas β-cell replication was predominant in rodents (21).
In the last several years, our group has shown that β-cell plasticity occurs in several human diseases in addition to diabetes. So, in the focal form of persistent hyperinsulinemic hypoglycemia of infancy (FoPHHI), area of adenomatous hyperplasia with large islets bearing mutations in genes with well-characterized functions in β-cells and showing signs of insulin overproduction and hypersecretion have been observed (38, 41). In the same pancreata, shrunken islets with hypotrophic β-cells exhibiting low levels of proinsulin production are also observed, and these are considered to be in a resting state (39). When the pancreatic lobules bearing abnormal islets, i.e., area of adenomatous hyperplasia with hypersecreting islets, are surgically resected, transient hyperglycemia occurs for several days but is followed by normoglycemia, which is most likely achieved by the reactivation of resting islets (10). This finding suggests that the plasticity of normal β-cells is modulated by the pathological source of insulin. Except for the insulinoma implantations in rats, none of the animal models previously developed to study β-cell plasticity have addressed this issue. To gain insight into the mechanisms controlling β-cell plasticity in this situation, we developed a model based on the subcutaneous implantation of insulin pellets, which release insulin steadily and independently of the glycemic state. Major hypoglycemia occurred rapidly after implantation and was accompanied by progressive islet atrophy. When the source of exogenous insulin was removed, there was a short, transient period of hyperglycemia, after which β-cells regenerated and glycemia returned to normal levels.
At different time points following the withdrawal of the insulin pellets, we quantified the expression of several mRNAs encoding transcription factors using real-time PCR following laser capture microdissection (LCM) to specifically examine selected clusters of endocrine cells. These findings were then correlated with the cellular localization of the proteins using immunofluorescence.
These morphological, morphometrical, and molecular data were used to address whether, in this model of insular plasticity, the replication of differentiated β-cells is the sole factor involved in the regeneration of β-cell mass.
MATERIALS AND METHODS
This study was approved by the ethics committee of the University of Louvain and was conducted in accordance with the guidelines issued by the National Belgian Animal Care Committee.
Experiments were carried out on 3-mo-old female NMRI mice (25–35 g) that were provided free access to water and a standard laboratory diet.
For comparisons with the mouse model under investigation, human pancreatic samples from six cases of FoPHHI were chosen from a large series of previously reported cases based on the availability of the materials (35).
Mouse Insulin Implants
A schematic of the experimental design is shown in Fig. 1. Mice (n = 112) were anesthetized with 50 mg/kg ketamine and 5 mg/kg xylazine. Test animals (n = 71) were subcutaneously implanted with five insulin pellets (LinBit; LinShin Canada, Ontario, Canada), each of which released 0.1 IU bovine insulin/day. Controls (n = 41) received sham operations. The effects of continuous insulin release were studied in animals killed after 3, 7, and 10 days postinsulin pellet implantation (IPI) (n = 23).
Fig. 1.

Experimental design for the implantation of insulin pellets at day 0 and their removal at day 7 or day 10 postimplantation. Bold nos. along the timeline correspond to days of death for morphometry analysis. Italic nos. along the timeline correspond to days of death for molecular analysis.
The effects of insulin pellet removal (IPR) were studied in 7-days and in 10-days IPI mice. For the 7-day IPI group, animals were killed at days 2, 3, 5, and 7 post-IPR for histological evaluation (n = 16) or at 10 h and 1, 2, 3, and 5 days post-IPR for gene expression studies (n = 16). The mice used for histological evaluations received intraperitoneal injections of 5-bromo-2′-deoxyuridine (BrdU) at a dose of 60 mg/kg (Sigma Aldrich, St. Louis, MO) 6 h before death. The 10-day IPI group was killed at days 2, 3, 7, and 14 post-IPR for morphological evaluation (n = 16).
Blood glucose concentrations were measured throughout the experiment using a glucose analyzer (One Touch-R Ultra TM; LifeScan, Milpitas, CA).
Mice Monitoring
Mice were weighed daily, and their behavior was observed.
At the time of death, blood was collected through heart punction; serum was obtained by centrifugation and stored at −20°C.
Hormonal Assays
Determination of C-peptide and glucagon levels was made using commercial kits [C-Peptide Elisa kit (Alere, Waltham, MA) and Glucagon RIA Kit (EMD Millipore, Billerica, MA)] according to the manufacturer's recommendations. Analyses were realized on serum stored from blood collected at death.
Tissue Processing and Ultrastructural Analysis
After dissection, the pancreata were rapidly stripped of fat and weighed. For histology and morphometry, the whole pancreas was fixed for 24 h in 4% buffered paraformaldehyde and routinely embedded in paraffin. For ultrastructural studies, fragments of the splenic portion of the pancreas from mice killed 3 or 10 days post-IPI were fixed in 2.5% glutaraldehyde, postfixed in 1% osmium tetroxide, embedded in Epon 812, and examined on a Zeiss EM109 electron microscope. Finally, pancreata embedded in TissueTek OCT medium (Sakura Finetek, Torrance, CA) were frozen in chilled isopentane, stored at −80°C, and used for nucleic acid studies and double-immunofluorescence staining.
Immunohistochemical Staining
The characteristics of the primary and secondary antibodies and the detection systems are listed in Table 1.
Table 1.
The primary and secondary antibodies used
| Primary Antibody and Host Species | Reference and Final Dilution | Antigen Retrieval | Detection System Reference and Dilution | Color of Visualization |
|---|---|---|---|---|
| Anti-Insulin | ||||
| Mouse | Chemicon, Mab 107, 1/100 | No | EnVision peroxidase complex (Dako, Carpintera) and DAB revelation (15a) | Brown |
| Guinea pig | Dako, A0564, 1/500 | Yes* | Alexa 594, anti-guinea pig (A11076; Invitrogen), 1/1,000 | Red |
| Alexa 647 anti-guinea pig (706-605-148, Jackson ImmunoResearch) 1/1,000 | Blue (transformed in red color) | |||
| Anti-Proinsulin | ||||
| Mouse | Novo Biolabs, HPI-005, 1/1,000 | Yes* | Alexa 594, anti-mouse (A21203, Invitrogen) 1/1,000 | Red |
| Anti-Glucagon | ||||
| Rabbit | Novocastra, NCL-GLUCp, 1/1,000 | Yes* | EnVision G/2 System/AP, Rabbit/Mouse (Permanent Red) (Dako, Carpintera) | Red |
| Mouse | Abcam, ab10988, 1/1,000 | Yes* | Alexa 488, anti-mouse (A21202; Invitrogen) | Green |
| Anti-BrdU | ||||
| Mouse | Dako, M744, 1/50 | No | EnVision peroxidase complex (Dako, Carpintera) and DAB revelation | Brown |
| Anti-Somatostatin | ||||
| Rabbit | Neomarkers, Ab1, 1/150 | Yes* | EnVision G/2 System/AP, Rabbit/Mouse (Permanent Red) (Dako, Carpintera) | Red |
| Anti-PDX-1 | ||||
| Rabbit | Abcam, ab47267 Gift from P. Jacquemin (UCL), 1/10,000 | No | Alexa 594, anti-rabbit (A-11072; Invitrogen, Life Technologies, Carlsbad, CA), 1/400 | Red |
| Goat | Abcam, ab47383, 1/1,000 | Yes* | Alexa 488, anti-goat (A11055; Invitrogen), 1/1,000 | Green |
| Anti-Nkx6.1 | ||||
| Rabbit | Gift from P. Jacquemin (UCL), 1/1,000 | No | Alexa 594, anti-rabbit, (A-11072; Invitrogen), 1/200 | Red |
| Anti-CK19 | ||||
| Rat | University of Iowa*, TromaIII, 1/50 | Yes* | Alexa 488, anti-rat, A-11006 (Invitrogen), 1/200 | Green |
| Anti-Nkx2.2 | ||||
| Mouse | University of Iowa*, 74.5A5, 1/50 | Yes* | TSA kit with HRP-goat anti-mouse IgG and Alexa fluor 594 tyramide, T20915 (Invitrogen) | Red |
| Anti-Glut-2 | Chemicon-Millipore, 07-1402 | |||
| Rabbit | 1/400 | No | Alexa 594, anti-rabbit, A-11072 (Invitrogen) if combined with CK19, 1/200 | Red |
| Rabbit | 1/4,000 | Yes* | Alexa 488, anti-rabbit, A-11008 (Invitrogen) with other antibodies, 1/200 | Green |
| Gift from Bernard Thorens, 1/100 | Yes* | Alexa 594, anti-rabbit, A-11072 (Invitrogen), 1/1,000 | Green |
BrdU, 5-bromo-2′-deoxyuridine; CK19, cytokeratin 19; Glut-2, glucose transporter-2; DAB, diaminobenzidine; TSA, tyramide signaling amplification detection system; HRP, horseradish peroxidase.
Antigen retrieval: 0.01 M citrate buffer, pH 5.8, for 75 min at 95°C. The monoclonal anti-Nkx2.2 antibody developed by T. M. Jessel and S. Brenner-Morton and the monoclonal anti-CK19 antibody developed by R. Kemler were obtained from the Developmental Studies Hybridoma Bank developed under the auspices of the National Institute of Child Health and Human Development and maintained by The University of Iowa, Department of Biology, Iowa City, IA.
Paraffin sections (5 μm thick) were immunostained as follows: with an anti-insulin antibody alone [diaminobenzidine (DAB), brown]; with anti-insulin (brown)/anti-glucagon and somatostatin cocktail (Fast Red); with anti-BrdU (brown)/anti-glucagon and somatostatin cocktail (Fast Red); or with anti-glucose transporter-2 (GLUT-2, brown)/anti-insulin (FITC).
We used GLUT-2 as a β-cell marker to localize the expression of certain transcription factors. For this purpose, double-immunofluorescence labeling was performed on 5-μm-thick frozen sections that had been fixed in acetone with 5% buffered paraformaldehyde 4% for 2 min at 4°C. Cytokeratin 19 (CK19) was used as an alternative ductal marker.
Sections were incubated with anti-Nkx2.2, anti-Pdx-1, or anti-CK19 antibodies overnight at room temperature, which was followed by incubation with the appropriate fluorescent secondary antibody (at room temperature for 1 h; Table 1). This step was followed by incubation with the anti-GLUT-2 or CK19 antibody overnight at 4°C in addition to a second specific fluorescent secondary antibody (Table 1). Slides were mounted with a fluorophore-preserving mounting medium (Vectashield 2/3: Vectashield with DAPI 1/3; Vector Laboratories, Burlingame, CA).
Similar double-immunofluorescence labeling methods were used to stain 5-μm-thick paraffin sections from FoPHHI pancreas samples.
Detection of Apoptosis
To label apoptotic cells, we had recourse to the “In situ Apoptosis Detection Kit” (Takara). The kit is designed to detect fragmented DNA histochemically by terminal labeling and is based on the TdT-dUTP nick end-labeling method, which uses terminal deoxynucleotidyl transferase to label 3′-OH ends of DNA fragments that are generated during the process of apoptosis. Incorporated fluorescein-labeled nucleotides were detected at light microscopy, using a peroxidase-labeled anti-fluorescein antibody, according to the manufacturer's recommendations.
Morphometric Analysis
β-Cell volume density and mass.
The relative area of endocrine tissue [β-cells and non-β-cells labeled with DAB (brown) and Fast Red deposits, respectively] vs. total pancreatic tissue was determined by planimetry using a Leitz microscope (magnification ×400) connected to a semiautomatic image analyzer (Videoplan; Kontron Bildanalyse, Eching, Germany), as previously reported (34). Two histological sections involving the entire pancreas and taken at intervals of 320 μm were measured in all mice. The endocrine mass was calculated by multiplying the endocrine cell relative area by the weight of the pancreas. The relative proportion of β-cells and non-β-cells was evaluated using the point-counting method described by Chalkley (7) with a 42-point ocular grid. β-Cell mass was calculated by multiplying this proportion by the absolute mass of endocrine cells, as previously reported (15).
Crowding.
β-Cell crowding (number of β-cell nuclei/1,000 μm2 of β-cell area) (40) was used to evaluate changes in β-cell size. Crowding was evaluated for at least 10 islets/section for each mouse. An increase in crowding reflects a decrease in the size of the cells, and vice versa.
β-Cell replication.
The percentage of BrdU-labeled β-cell nuclei was assessed by counting the number of positive and negative nuclei. An average of 1,000 β-cell nuclei was evaluated for each group (one section/pancreas, n ≥ 3/group).
Distribution of islet profiles.
Islet profiles were measured by planimetry and sorted into the following three categories: <400, 401–50,000, and >50,000 μm2. Quantification was performed on double-immunostained sections (anti-insulin and a cocktail of anti-glucagon and anti-somatostatin antisera, two entire sections/pancreas, n ≥ 5/group).
LCM and Real-Time Quantitative PCR
All microdissection procedures were performed within 15 min of collection to preserve RNA quality (28). These procedures included the staining of 7-μm-thick frozen sections (Histogene LCM Frozen Section Staining Kit; Arcturus) and islet microdissection using a 337-nm PALM MicroLaser System (Bernied). The samples were collected in 20 μl RNAqueous Micro Isolation solution (Ambion, Huntingdon, UK) and were stored at −80°C. A total of ∼180,000 μm2 endocrine tissue (corresponding to 15–30 islet profiles) was dissected. Moreover, two entire 12-μm sections from each pancreas (without any staining and microdissection) were immediately collected in lysis solution (Ambion) and then frozen.
Total RNA was extracted using an RNAqueous Micro Isolation kit (Ambion), which involved treatment with DNase I (20 min at 37°C) and an RNase inhibitor (RNaseOUT, 20 U; Invitrogen, Life Technologies, Carlsbad, CA). For microdissected samples, the RT reaction was performed using 7 μl total RNA, Sensiscript reverse transcription (Qiagen, Benelux, Venlo, The Netherlands), oligo(dT)12–18 (1 μM), and random primers (10 μM) (Invitrogen, Life Technologies). A 5-μl sample of the reverse transcription product was used for real-time quantitative PCR (RT qPCR).
For entire sections, the relative abundance and integrity of mRNA was determined using a NanoDrop spectrophotometer (Wilmington, DE) to measure the 260/280 nm optical density ratio (range: 2.0 and 2.1). Total RNA (500 ng) was reverse transcribed using oligo(dT) primers (250 ng), random primers (200 ng), and the Superscript II reverse transcription kit (Invitrogen, Life Technologies). A 12.5-ng sample of the reverse transcription product was used for RT qPCR.
All RT qPCR reactions were performed in duplicate with SYBR Green master mix (Bio-Rad, Hercules, CA) and 0.4 μM of each specific primer in an Opticon 2 Real-Time cycler system (Bio-Rad). Primers were designed in-house (Primer 3 software; Broad Institute) for mouse cyclophilin, proinsulin, glucagon, Nkx6.1, Nkx2.2, Pdx-1, β2/NeuroD, and CK19 (Table 2). Primers for Ngn3 were provided by P. Jacquemin. The cycling conditions included a polymerase activation step (5 min at 95°C) and 40 cycles of amplification with temperature parameters depending on the primers (Table 2) and a single fluorescence measurement.
Table 2.
The primer sequences, amplicon lengths, and cycling conditions used
| Gene mRNA | Sense Primer | Reverse Primer | Length of Amplicon, bp | Cycling Conditions |
|---|---|---|---|---|
| Cyclophilin | TTG GGA AGG TGA AAG AAG G | GAA GGA ATG GTT TGA TGG G | 154 | 95°C for 30 s; 60°C for 1 min; 72°C for 1 min |
| Proinsulin | TCT TCT ACA CAC CCA TGT C | GGT GCA GCA CTG ATC TAC | 149 | 95°C for 10 s; 56°C for 1 min; 84°C for 15 s |
| Glucagon | CAG AGG AGA ACC CCA GAT CA | GAC GTT TGG CAA TGT TGT TCC | 199 | 95°C for 15 s; 60°C for 1 min |
| Nkx2.2 | CGA GTC ACC GGA CAA TGA C | GTA GGT CTG CGC TTT GGA GA | 97 | 95°C for 15 s; 60°C for 1 min |
| PDX-1 | GAG GAC CCG TAC TGC CTA CA | TTC AAC ATC ACT GCC AGC TC | 111 | 95°C for 15 s; 60°C for 1 min |
| B2/NeuroD | CTC GGA CTT TCT TGC CTG AG | TCA AAG AAG GGC TCC AGA GC | 196 | 95°C for 15 s; 60°C for 1 min |
| CK19 | TGT CGA CCT AGC CAA GAT CC | GAG CAA GGT AGG TGG CTT CA | 95 | 95°C for 15 s; 60°C for 1 min |
| Ngn3 | TCA CTG ACT GAC CTG CTG CT | TTG GAA CTG AGC ACT TCG TG | 148 | 95°C for 30 s; 60°C for 1 min |
Amplicon specificity was confirmed by melting-curve analysis as well as the molecular weights of the products, as evaluated by agarose gel electrophoresis. For all amplicons, the RT qPCR efficiency was between 1.95 and 2.04 (36). Following normalization of target gene expression to that of the housekeeping gene (cyclophilin), the relative changes in expression levels at each time point were calculated using the 2 − (δδCt) method, where δδCt = (Ct target − Ct cyclophilin)time x − (Ct target − Ct cyclophilin)time 0; time x corresponds to the time of death, i.e., 10 h or 1, 2, 3, or 5 days after the removal of the implants, whereas time 0 corresponds to the control sample. The results are shown as the means of 2 − (δδCt) values ± SD (26).
Statistical Analysis
Numerical results are expressed as means ± SD, and these data were compared between time points using a one-way ANOVA. In cases of statistically significant heterogeneity, the ANOVA was followed by a Dunnett test to compare the variable parameter with the control value on each day. The substantial variability in the number of β-cell clusters in mice implanted with insulin pellets for 7 days (maximum-to-minimum ratio of 140) required the use of the Kruskal-Wallis nonparametric ANOVA followed by the Wilcoxon rank sum test. All tests were two-tailed and were performed using SPSS 15.0 (SPSS, Chicago, IL). The intraobserver variations for morphometrical parameters were ∼10%.
RESULTS
Severe hypoglycemia occurred during IPI, whereas apoptosis and atrophy significantly altered the islets. Mice behavior, however, did not change substantially.
Following the first day of IPI, blood glucose levels decreased for 7 days (27.8 ± 9.4 mg/dl) and then plateaued (29.7 ± 12.3 mg/dl at day 10) (Fig. 2). There was no significant difference between the weight of animals, despite the fact that the weight of the mice with implants was slightly higher, probably reflecting a greater food intake related to hypoglycemia [day 7 post-IPI: 31.5 ± 2.6 vs. 29.2 ± 2.3 g for control, not significant (NS); day 10 post-IPI: 32.2 ± 2.4 vs. 28.9 ± 2.6 g for control, NS; day 7 post-IPR in 7-days IPI mice: 29.3 ± 2.6 vs. 30.2 ± 2.7 g for control; day 14 post-IPR in 10-days IPI mice: 31.2 ± 2.8 vs. 31.2 ± 2.6 g for control, NS]. Even highly hypoglycemic mice were not apathetic and did move in a way similar to that of controls. Hormonal dosages (C-peptide and glucagon) did not reveal significant differences between groups in our particular groups of mice, even if at day 3 post-IPI a trend toward a decrease in C-peptide was observed. Values remained low, whatever the group. For C-peptide dosages, mean values and SD were, respectively: 186.4 ± 31.9 pM for controls (n = 11); 83.7 pM for day 3 post-IPI (n = 1); 150.7 ± 42.8 pM for day 7 post-IPI (n = 11); 176.6 ± 51.7 pM for day 10 post-IPI (n = 7); 184.9 ± 93.6 pM for day 1 post-IPR in 7-day IPI mice (n = 3); 182.8 ± 20.6 pM for day 2 post-IPR in 7-day IPI mice (n = 4); 132.4 ± 41.9 pM for day 3 post-IPR in 7-day IPI mice (n = 3); 175.9 ± 42 pM for day 5 post-IPR in 7-day IPI mice (n = 4); 181.9 ± 60 pM for day 7 post-IPR in 7-day IPI mice (n = 6); 203.4 ± 91.6 pM for day 2 post-IPR in 10-day IPI mice (n = 3); 222.3 ± 34.6 pM for day 3 post-IPR in 10-day IPI mice (n = 3); and 195.2 ± 52.3 pM for day 7 post-IPR in 10-day IPI mice (n = 7). For glucagon, results (mean) were, respectively: 92.3 ± 28.1 pg/ml for controls (n = 11); 98.1 pg/ml for day 3 post-IPI (n = 1); 70.1 ± 19 pg/ml for day 7 post-IPI (n = 9); 77.1 ± 22 pg/ml for day 10 post-IPI (n = 7); 90.3 pg/ml for day 1 post-IPR in 7-day IPI mice (n = 1); 69.2 ± 15.4 pg/ml for day 2 post-IPR in 7-day IPI mice (n = 4); 72.4 ± 8.1 pg/ml for day 3 post-IPR in 7-day IPI mice (n = 2); 82.4 ± 17.8 pg/ml for day 5 post-IPR in 7-day IPI mice (n = 4); 72.5 ± 15 pg/ml for day 7 post-IPR in 7-day IPI mice (n = 6); 64.7 ± 11.6 pg/ml for day 2 post-IPR in 10-day IPI mice (n = 4); 95.2 ± 53.1 pg/ml for day 3 post-IPR in 10-day IPI mice (n = 3); and 85 ± 25 pg/ml for day 7 post-IPR in 10-day IPI mice (n = 6).
Fig. 2.

Evolution of glycemia during the experiment. IPI, insulin pellet implant; D, day.
Although the animals became hypoglycemic at day 3 post-IPI, their islets retained normal features (Fig. 3A), such as the absence of apoptosis. However, at day 7 post-IPI, islets had a disturbed appearance with reduced size and more prominent α- and δ-cells (Fig. 3B). Moreover, apoptosis was detected in most islets (Fig. 3C) with the In situ Apoptosis Detection Kit. At day 10 post-IPI, most islets had become very small, were less numerous, and essentially constituted by α- and δ-cells (Fig. 3D), and few apoptotic bodies were present (data not shown). The central portions of the islets consisted of shrunken β-cells, and the β-cell nuclear crowding indicated an average 50% reduction in β-cell size (P = 0.005 vs. control values) (Table 3). Insular lymphocytic infiltration was not observed at any time point. At days 3, 7, and 10 following pellet implantation, the endocrine mass had decreased by 50, 60 (P = 0.048), and 75% (P = 0.008), respectively (Fig. 4A). During this period, the β-cell mass decreased in parallel (P = 0.015 and P = 0.002 at day 7 and day 10, respectively), whereas the mass of non-β-cells remained unchanged (P > 0.86) (Fig. 4, D and G).
Fig. 3.

Morphology of the islets of Langerhans. On day 3 post-IPI (A), islet morphology was normal, whereas at 7 days post-IPI (B), the proportion of β-cells was reduced. In Situ Apoptosis Detection Kit revealed apoptosis in day-7 IPI mice (brown deposit, C). At day 10, islets of Langerhans appeared almost devoid of insulin-producing cells (D). β-Cell proliferation peaked 5 days following insulin pellet removal (IPR) in 7-day IPI mice (E), and normal proportions of endocrine cells were restored (F). A, B, D, and F: immunohistochemical staining with insulin is shown in brown, and staining with the glucagon-somatostatin cocktail is shown in red. C: In Situ Apoptosis Detection Kit (Takara) to detect apoptotic cells. E: nuclear immunohistochemical staining with 5-bromo-2′-deoxyuridine (BrdU) is shown in brown, and insulin staining is shown in red. Scale bars = 50 μm.
Table 3.
Crowding measurements
| Mice Implanted with Insulin Pellets |
Days after the Removal of Insulin Pellets in Mice That Had Kept Implants for 7 Days |
Days after the Removal of Insulin Pellets in Mice That Had Kept Implants for 10 Days |
||||||||||
|---|---|---|---|---|---|---|---|---|---|---|---|---|
| Control | Day 2 | Day 3 | Day 7 | Day 14 | Day 3 | Day 5 | Day 7 | Day 2 | Day 3 | Day 7 | Day 14 | |
| Mean, % | 100 | 147.6 | 125.4 | 103.0 | 109.5 | 122.2 | 117.5 | 90.5 | 147.6 | 125.4 | 103.0 | 109.5 |
| SD | 20.6 | 19 | 17.5 | 14.3 | 14 | 17.5 | 12.7 | 19 | 19 | 17.5 | 14.3 | 14 |
The crowding was expressed as a percentage of the control value (controls were normalized to 100%). The implantation of insulin pellets induced a drastic reduction in β-cell size, although this size returned to normal 7 days after insulin pellet removal.
Fig. 4.

Endocrine (A–C), β-cell (D–E), and non-β-cell (G–I) masses. A: the endocrine mass had began to decrease at day 3 and was reduced by 60% at day 7 and 75% at day 10. Similarly, a profound drop in β-cell mass (D) was observed at day 7 and day 10 in animals implanted with insulin pellets. Seven days following the withdrawal of the implants, both endocrine mass (B) and β-cell mass (E) were restored. In mice that had received insulin for 10 days, the endocrine mass (C) and the β-cell mass (F) were not restored until 14 days post-IPR. The non-β-cell mass remained unchanged throughout the experimental procedure (G–I). ✱P = 0.048 (A), ●P = 0.015 (D), ✱✱P = 0.008 (A) and ●●P = 0.002 (D).
IPR Induced Marked but Transient Hyperglycemia before a Complete Recovery of β-Cell Mass was Achieved
The subsequent removal of the insulin pellets (IPR) induced marked hyperglycemia that began at day 1 post-IPR. This was followed by a progressive normalization of glycemia (Fig. 2). The delay in the return to normal values was 2 days longer in mice implanted for 10 days compared with those implanted for 7 days. At 4 days post-IPR, the islets remained sparse and contained cellular debris. At day 5 post-IPR, the general features of the islets and their endocrine cell proportions had returned to normal (Fig. 3F). When the insulin pellets were removed, β-cell size returned to normal, regardless of the duration of implantation (Table 3). Both total endocrine and β-cell mass progressively returned to normal values, and this rebound was more rapid in 7-day-implanted than 10-day-implanted mice (7 days post-IPR in 7-day IPI mice: P = 1.000 both for endocrine and β-cell mass vs. control; 14 days post-IPR in 10-day IPI mice: P = 0.894 for endocrine mass vs. control and P = 0.887 for β-cell mass vs. control) (Fig. 4, B, C, E, and F). Similar to IPI of any duration, IPR had no effect on non-β-cell mass (Fig. 4, H and I).
After IPR, There was a Peak in β-Cell Proliferation, and Islet Size Distribution Showed a Higher Frequency of Small Endocrine Cell Clusters
Following IPR, the replication rate of β-cells increased progressively from 0.5% at day 3 post-IPR to 3.0% at day 5 post-IPR (P = 0.03; Figs. 3E and 5). At day 5 post-IPR, the islet size distribution of 7-days IPI mice corresponded to a higher frequency of small endocrine cell clusters (<400 μm2) (P = 0.041; Fig. 6B) that were dispersed throughout the parenchyma, in the vicinity of the ducts or among the acini. For the 10-days IPI mice, the number of small endocrine cell clusters also increased 14 days post-IPR, but the value did not reach significance at that time (Fig. 6C). Proliferation rate was identical whatever the size of the islet (data not shown).
Fig. 5.

A peak in β-cell proliferation occurred 5 days after IPR (P = 0.030) before values returned to normal 2 days later. The straight bars indicate the means.
Fig. 6.

Distribution of islet profiles. Small clusters (A–C): a drastic increase in small clusters was observed 5 days after IPR in 7-day IPI mice (P = 0.041; B). For the 10-days IPI mice, the no. of small endocrine cell clusters also increased 14 days post-IPR, but the value did not reach significance at that time. Large islets (D–F): in the initial days after IPR, the proportion of these islets was lower than that observed in controls (D). In 7-day IPI mice, the proportion of these very large islets had returned to normal by 7 days post-IPR (E), whereas in 10-day IPI mice, the number of large islets remained fewer at 7 and 14 days after IPR than that observed in the control group (D) (P = 0.015; F). ✱P = 0.041 and ✱✱P = 0.003.
After IPR, the number of large islets (50,001–400,000 μm2) was ∼50% lower in treated mice than in controls. However, these numbers returned to normal within 7 days post-IPR in the 7-days IPI mice (Fig. 6E) but remained reduced until the end of the experiment in the 10-days IPI mice (P = 0.015) (Fig. 6F).
In 10-days IPI mice, cells remained unstained, either with anti-insulin antibody or glucagon or somatostatin antibodies within the islets (Fig. 7A). This suggested the existence of β-cells that had lost insulin expression. By coimmunofluorescent labeling with insulin and GLUT-2 taken as a β-cell marker, we confirmed this hypothesis: some islet cells showed weak expression of GLUT-2 and absence of insulin expression (Fig. 7B). Total or near-total absence of endocrine granules in these cells was confirmed by electron microscopy (Fig. 7E). Such cells were never observed in control mice: in these mice, insulin granules were easily found (Fig. 7D). Before pellet removal, proinsulin expression was found in a weak proportion of islet cells. Surprisingly, when colabeling for proinsulin and GLUT-2 was performed, we observed that cells expressing proinsulin did not express GLUT-2 and vice versa (Fig. 7C). GLUT-2 expression was disturbed, both before and after pellet removal, contrary to the situation observed in control islets where GLUT-2 expression was more homogenous (Fig. 8A). At days 7 and 10 post-IPI, the proportion of β-cells expressing GLUT-2 decreased. Several β-cells still expressed proinsulin while they became GLUT-2 negative (Fig. 8B). At day 2 post-IPR, this situation persisted, with a particularly weak expression of GLUT-2 (Fig. 9, B and E). Moreover, in 10-days IPI mice, we also observed, 2 days after IPR, cells expressing proinsulin, in the absence of GLUT-2; these cells were situated in the close vicinity of ducts (Fig. 8C). Later on, gradual increased expression of GLUT-2 was progressively restricted to the cytoplasmic membranes, similarly to controls (Fig. 8A).
Fig. 7.

Islet cells without any immunostaining in 10-days IPI mice. In day 10 IPI mice, cells remained unstained, either with anti-insulin antibody or glucagon or somatostatin antibodies (arrow) in islets (A). Coimmunofluorescent labeling with insulin (red) and glucose transporter-2 (GLUT-2, green) showed the absence of insulin expression in islet cells with weak expression of GLUT-2 (arrows) (B). Colabeling for proinsulin (red) and GLUT-2 (green) in mice before pellet removal revealed cells expressing proinsulin but not GLUT-2 and inversely (C). Electron microscopy revealed a drastic decrease in the no. of insulin-secreting granules in some cells (E). Inset: characteristic insulin granules (dense core and clear halo). In control mice, β-cells contain numerous insulin granules (D). Scale bar for A and B = 50 μm; for C = 10 μm; and for D and E = 2.6 μm.
Fig. 8.
Immunolocalization of proinsulin and GLUT-2 (A–C); immunolocalization of insulin and glucagon (D). Control mice show a characteristic coexpression of GLUT-2 (green) and proinsulin (red) (A), whereas, in 10-days IPI mice, GLUT-2 expression is heterogenous (B): some cells expressing proinsulin are devoid of GLUT-2 staining (GLUT-2 revealed in green; proinsulin revealed in red). Two days after IPR, in 10-days IPI mice, cells expressing proinsulin (red), in the absence of GLUT-2, were observed in close vicinity of a duct (C). Colocalization of glucagon (green) and insulin (red) was never observed here, 5 days after IPR, in 7-days IPI mice (D). Scale bar for A, B, and D: 20 μm; and for C: 10 μm. Solid arrows indicate cells expressing proinsulin (red) in the absence of GLUT-2 located in the close vicinity of a duct. Open arrows indicate isolated cells expressing proinsulin (red) in the absence of GLUT-2 within the exocrine parenchyma.
Fig. 9.

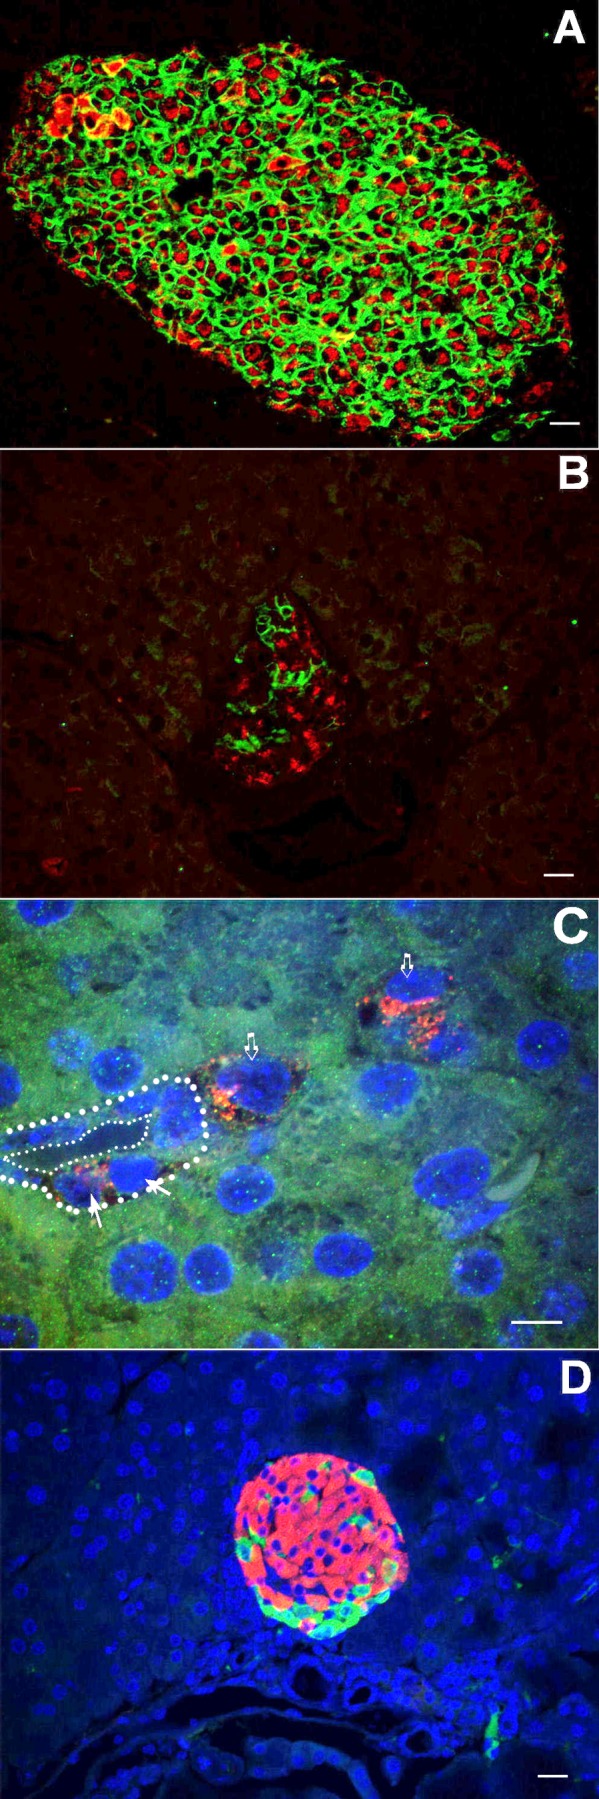
Cellular localization of transcription factors. In control pancreas, GLUT-2 expression was restricted to β-cell with an almost exclusive membranous pattern (green staining; A and D). No significant modification in the expression pattern of Nkx2.2 (nuclear red staining) was observed after IPR (B and C). At day 3 post-IPR in 7-days IPI mice, nuclear expression of Pdx-1 (nuclear red staining) (F) in GLUT-2-positive cells (green) became evident, whereas almost no staining could be detected the days before (E) in cells expressing GLUT-2. In the focal form of persistent hyperinsulinemic hypoglycemia of infancy, expression of Pdx-1 (nuclear green) is more pronounced in adenomatous islets (I) than in islets outside of tumor (H) (insulin in red; H and I). In control pancreas as in IPR mice, cytokeratin 19 expression (green) was only observed in ducts, without any colocalization with GLUT-2 (red)-positive islet cells (G). Scale bar for A–F and H–I: 20 μm; scale bar for G: 40 μm.
A Sequential Increase in the Expression of Specific Pancreatic Transcription Factors Occurred Post-IPR
The use of LCM allowed us to dissect selected islets and endocrine clusters while avoiding contamination from other nonendocrine cell types. Such experiments were performed after IPR. To validate our dissections, we first measured insulin and glucagon mRNA levels in the dissected islets. The levels of insulin mRNA expression remained very low post-IPR (98% of decrease at 10 h and 1 day post-IPR compared with controls, P < 0.001) (Fig. 10A). This result confirmed our immunofluorescent data described above. Conversely, at day 3 post-IPR, the expression of the insulin gene tended to be higher than that measured in controls (2.3×) but subsequently returned to normal levels at day 5 post-IPR (Fig. 10A). The expression of glucagon mRNA remained stable throughout the experiment (Fig. 10B). These results confirmed that the endocrine clusters were appropriately dissected.
Fig. 10.

Fold change in transcription factor mRNA expression following IPR. mRNA levels of insulin, glucagon, β2/NeuroD, Pdx-1, and Nkx2.2 were measured by real-time PCR. The relative changes in expression levels at each time point relative to the controls were calculated using the 2 − (δδCt) method. The level of insulin mRNA expression (A) remained low during the initial days post-IPR (98% lower than in controls; P < 0.001 at 10 h and 1 day post-IPR), but, at 3 days post-IPR, the expression of the insulin gene tended to be elevated (2.3× the control value) but subsequently returned to baseline. The expression of glucagon mRNA (B) remained stable throughout the experiment. Precociously enhanced expression of β2NeuroD (C) was observed 10 h after retrieval, compared with the controls, and its expression remained elevated afterward. Pdx-1 mRNA expression (D) was increased 2.3-fold compared with the controls at 2 days post-IPR. The level of Nkx2.2 mRNA expression (E) was increased by almost 2-fold compared with the controls at 5 days post-IPR, without statistical significance. The data are presented as the median logarithms of numerical results. °°°P < 0.001 (A), °P = 0.013 (C), and °°P = 0.012 (D) at day 3.
At 10 h post-IPR, at a time where mice were already hyperglycemic (191.75 ± 24.44 mg/dl measured 7 h after IPR), the expression level of β2/NeuroD mRNA was increased by 3.66-fold compared with controls (P = 0.013) (Fig. 10C), and this expression level remained elevated after IPR with large individual variations. However, at subsequent time points, the expression level of β2/NeuroD mRNA was not different between treated and control animals.
At day 2 post-IPR, the Pdx-1 mRNA expression level was increased by 2.3-fold compared with controls (P = 0.012) (Fig. 10D) and remained upregulated at 3 (1.7-fold increased compared with control; NS) and 5 (1.8-fold increased compared with controls: P = 0.052) days after IPR. Pdx-1 mRNA expression was not detected in exocrine tissue.
At day 5 post-IPR, the Nkx2.2 mRNA expression level was increased by almost twofold compared with controls (Fig. 10E), but this difference did not reach statistical significance. The expression of Ngn3 mRNA was never detected during the regenerative process in this experiment (data not shown). Whereas virtually no expression of Pdx-1 was detected in islets during the first 2 days post-IPR, in particular in cells expressing GLUT-2 (Fig. 9E), a significant increase of its expression occurred at day 3 post-IPR. The nuclear expression of Pdx-1 was evident in cells characterized by a membranous expression of GLUT-2 (Fig. 9F). Pdx-1 expression was never detected outside islets. At the times of death chosen, no significant difference in the expression of Nkx2.2 was observed in immunocytochemistry (Fig. 9, A–C). During the restoration of the β-cell mass, after IPR, colocalization of insulin and glucagon in the same cell was never detected (Fig. 8D). After pellet removal, few β-cells expressing proinsulin as small dots were observed close to the duct wall, evoking β-cell neogenesis during embryonic stages. This observation suggests that these cells, which did not express GLUT-2, could be neogenic β-cells generated from cells located in ducts (Fig. 8C).
In human segmental resected pancreata from FoPHHI, the β-cells in the abnormal hypersecreting area had abundant cytoplasm, and some β-cell nuclei were abnormally large as previously reported (39). Outside the abnormal focus, the islets were small, β-cells had shrunken cytoplasm, and the β-cell nuclear crowding was high (as in mouse islets during IPI). The expression of Pdx-1 was more intense in the hyperactive β-cells from the focal lesion (as in hyperactive mouse islets after IPR) than in the resting β-cells outside the lesion (Fig. 9, H and I).
DISCUSSION
In the current study, we developed and characterized an original mouse model of β-cell plasticity that enabled the study of β-cell adaptation in the face of metabolic perturbation. Our experimental device induced profound β-cell atrophy due to insulin implantation, and, following the withdrawal of the implants, there was a rapid regeneration characterized by the restoration of functional capacities, i.e., insulin synthesis and secretion, the normalization of glycemia, and the restitution of the β-cell mass. The initial decrease in β-cell mass closely paralleled that of glucose, and, from day 7 onward, the β-cell mass continued to decrease although the degree of hypoglycemia remained unaltered. Thus, in addition to the level of glycemia, the persistence of hypoglycemia determined the degree of β-cell mass reduction. This reduction was caused by both apoptosis and β-cell atrophy. Interestingly, during this period of β-cell atrophy and disrupted islet architecture, Pdx-1 expression was low; this observation is consistent with the link established between Pdx-1 and the maintenance of β-cell mass in adulthood, notably through the regulation of apoptosis (18). The occurrence of transient hyperglycemia following IPR is not surprising because the residual β-cell mass was still very low at this time. However, it is interesting to note that β-cell function was restored 2 days before β-cell mass, which suggests that functional plasticity arises more rapidly than anatomical plasticity. The regeneration process is initiated in the context of hyperglycemia, which is quite similar to that observed following experimental subtotal (90%) pancreatectomy; in the latter, nevertheless, β-cell mass was not fully restored (3). Moreover, the time to regenerate and to reach to control values, in our model, was short, which is, from a practical point of view, an advantage in the course of experiments.
In normal rats, hyperglycemia has been shown to increase β-cell mass (2), regardless of the blood insulin level (31). In these studies, however, this increase relied on an intact β-cell mass, whereas, in the present study, β-cell mass was restored during a period of marked hyperglycemia despite a very low number of residual β-cells. Thus, neither severe hyperglycemia nor a small number of residual β-cells prevented β-cell regeneration. The peak of β-cell regeneration typically occurred at day 5 and was concomitant with the normalization of glycemia, as previously shown by others (16).
The IPI model reproduces some features of β-cell plasticity that we previously described in focal forms of congenital hyperinsulinism (38, 39). In this rare disease, the excessive and uncontrolled release of insulin by abnormal hypersecreting islets (with β-cells bearing mutations in the ABCC8 and KCNJ11 genes) induces the resting and atrophy of normal islets throughout the pancreas. Surgical segmental resection restricted to the focus with unregulated hyperplasic islets cures the patient after a transient period of hyperglycemia. Similarly, the excessive release of insulin in our insulin implant model induces resting of the islets, increases β-cell crowding, and decreases islet size, which lead to a decreased β-cell mass. Similar to infants who have received segmental surgery, the suppression of exogenous insulin in these IPI mice induces a transient diabetic state that precedes a complete recovery.
Many experimental models have been used to study the β-cell plasticity. For example, solid insulin-producing tumors have been transplanted in rats to induce severe hypoglycemia and insular atrophy (9). Next, removal of the tumor cells results in a regeneration process that is associated with the normalization of blood glucose levels. However, the present model of IPI has several major advantages compared with the “insulinoma model”; first, the current model is highly standardized, controlled, and reproducible; second, the delay in the induction of hypoglycemia is short; and third, there is no confounding effect due to factors potentially secreted by the tumor. Indeed, despite the presence of a capsule of connective tissue surrounding the insulinomas, direct tissue invasiveness or contamination of the area during resection cannot be excluded (13), and this could interfere with β-cell mass plasticity.
Partial pancreatectomy and duct ligation models have long been used to study β-cell plasticity, but these models do not specifically target the β-cell compartment, unlike the more selective IPI model. Moreover, the absence of pancreatitis and insulitis in this model reduces the potential interference of inflammatory factors. Streptozotocin injection is also a well-known alternative method for affecting the β-cell compartment, since this treatment induces diabetes secondary to β-cell necrosis (24) but can also cause liver and renal damage (4).
In contrast, the IPI model relies on physiological adaptations, such as hypotrophy and apoptosis. The factors responsible for this insular atrophy in the context of excessive insulin release have been studied previously (8, 31), and severe hypoglycemia, rather than an excess of insulin per se, has been shown to induce islet atrophy. Consistent with this concept, we observed that β-cell mass continued to decrease as long as hypoglycemia was present, whereas the levels of insulin remained constant.
The transcriptional profile of LCM-isolated endocrine structures revealed the sequentially enhanced expression of β2-NeuroD followed by Pdx-1. The activation of these transcription factors, which are known to be associated with islet cell development (14, 32), may suggest that the dynamic modifications of β-cell mass observed in our model also rely on an enhanced plasticity of cell differentiation, as previously reported by Li et al. in a model of partial pancreatectomy in adult rats (25). Moreover, markers such as Pdx-1 or β2-NeuroD can be detected in mature endocrine islet cells, and some authors have proposed that the upregulated expression of transcription factors at specific times of the regenerative process signifies neogenesis in the adult pancreas (44, 46). In our model, however, Ngn3 mRNA and Ngn3 protein expression were not observed in LCM products by RT qPCR or immunohistochemistry, respectively.
The origin of new β-cells for maintenance or regeneration remains a subject of active research and debate, and this occurrence seems widely dependent on experimental conditions (11, 46). The first potential source of new β-cells is via the replication of preexisting β-cells (11), which has been shown to be the predominant mechanism for adult β-cell mass expansion. The second source, which is typically referred to as neogenesis, involves the expansion and redifferentiation of less or dedifferentiated progenitor-like cells into mature endocrine cells, which mimics normal embryonic development, and this process has been observed both in vivo (16,30) and in vitro (10). Third, it is possible that stem cells could be bypassed by the direct conversion of differentiated cells into β-cells, which corresponds to a recently described mechanism called reprogramming or transdifferentiation (12, 43). In our model, at 5 days post-IPR in 7-day IPI mice, a peak of β-cell proliferation was measured within the islets, which represented the self-replication of β-cells. In addition to the increased rate of proliferation, the number of small endocrine clusters increased significantly throughout the parenchyma, at the vicinity of the ducts or within the acini. It is unlikely that these small clusters originated from islets that were disrupted during IPI because they were not present at day 7 post-IPI or during the initial days post-IPR. In addition, the observation of cells remaining unstained in the core of atrophic islets at day 10 post-IPI regardless of the sensitivity of the immunohistochemical detection system used is also of interest. The ultrastructural analyses confirmed the total or nearly total absence of secretory granules in these cells, which may have corresponded to the presence of less-differentiated, progenitor-like cells. This hypothesis was reinforced by the detection of cells expressing the GLUT-2 but not insulin, and these types of cells have been previously described as potential β-cell precursors (16, 30, 45). However, we also observed cells expressing faint proinsulin staining and no GLUT-2 staining in close proximity to ducts, and it is tempting to speculate that this could represent the transdifferentiation of duct cells into β-cells. However, this observation could also correspond to remodeling of the regenerating parenchyma, which leads to the juxtaposition of immature β-cells and ducts.
Altogether, the rapid β-cell mass recovery and the morphological particularities observed here suggest that, in addition to enhanced replication, an additional regeneration pathway could contribute to the complete recovery of the β-cell mass, and this mechanism seems to involve an enhanced plasticity of β-cell differentiation.
In conclusion, we developed an in vivo mouse model of insular plasticity that first generates a dramatic reduction in the β-cell population and then drives a rapid increase in the endocrine pancreatic β-cell mass and functional recovery, which enables metabolic demands to be met within 1 wk of treatment. Although mass and function are two closely related parameters, changes in mass and function do not always change in parallel over time. In our model, regeneration relied mostly on the enhanced replication of β-cells. However, intriguing morphological data do not exclude the adjunction of another repair mechanism involving the plasticity of β-cell differentiation, which has been termed neogenesis in the literature (25). The model proposed herein could be used to investigate further questions in the field of β-cell plasticity and may be useful for molecular studies aimed at improving our understanding of the processes that drive the regeneration of the β-cell mass in a well-defined in vivo model.
GRANTS
This work was supported by Grant 3.4.616.05.F F.R.S.M from the Fonds National de la Recherche Scientifique Médicale (Belgium).
DISCLOSURES
No conflicts of interest, financial or otherwise, are declared by the authors.
AUTHOR CONTRIBUTIONS
Author contributions: M.-C.N., J.R., and Y.G. conception and design of research; M.-C.N., J.M., P.T., S.G., G.V.d.S., and J.J. performed experiments; M.-C.N., J.R., J.J., and Y.G. analyzed data; M.-C.N., J.R., and Y.G. interpreted results of experiments; M.-C.N., P.J., and Y.G. prepared figures; M.-C.N. drafted manuscript; M.-C.N., J.R., J.M., P.T., C.S., P.J., and Y.G. edited and revised manuscript; M.-C.N., J.R., J.M., P.T., S.G., G.V.d.S., J.J., C.S., P.J., and Y.G. approved final version of manuscript.
ACKNOWLEDGMENTS
We thank P. Jaume for expert IT assistance and M.-C. Cossement, S. Lagasse, A. Lefèvre, and H. Merckx for expert technical assistance. We thank P. Gilon and I. Leclercq for taking care of the glucagon and C-peptide dosage.
REFERENCES
- 1. Bonner-Weir S. Islet growth and development in the adult. J Mol Endocrinol 24: 297–302, 2000 [DOI] [PubMed] [Google Scholar]
- 2. Bonner-Weir S, Deery D, Leahy JL, Weir GC. Compensatory growth of pancreatic beta-cells in adult rats after short-term glucose infusion. Diabetes 38: 49–53, 1989 [DOI] [PubMed] [Google Scholar]
- 3. Bonner-Weir S, Trent DF, Weir GC. Partial pancreatectomy in the rat and subsequent defect in glucose-induced insulin release. J Clin Invest 71: 1544–1553, 1983 [DOI] [PMC free article] [PubMed] [Google Scholar]
- 4. Bouwens L, Rooman I. Regulation of pancreatic beta-cell mass. Physiol Rev 85: 1255–1270, 2005 [DOI] [PubMed] [Google Scholar]
- 5. Butler AE, Cao-Minh L, Galasso R, Rizza RA, Corradin A, Cobelli C, Butler PC. Adaptive changes in pancreatic beta cell fractional area and beta cell turnover in human pregnancy. Diabetologia 53: 2167–2176, 2010 [DOI] [PMC free article] [PubMed] [Google Scholar]
- 6. Butler AE, Janson J, Bonner-Weir S, Ritzel R, Rizza RA, Butler PC. Beta-cell deficit and increased beta-cell apoptosis in humans with type 2 diabetes. Diabetes 52: 102–110, 2003 [DOI] [PubMed] [Google Scholar]
- 7. Chalkley HW. Method for the quantitative morphologic analysis of tissues. J Natl Cancer Inst 4: 47–53, 1943 [Google Scholar]
- 8. Chen L, Komiya I, Inman L, O'Neil J, Appel M, Alam T, Unger RH. Effects of hypoglycemia and prolonged fasting on insulin and glucagon gene expression. Studies with in situ hybridization J Clin Invest 84: 711–714, 1989 [DOI] [PMC free article] [PubMed] [Google Scholar]
- 9. Chick WL, Warren S, Chute RN, Like AA, Lauris V, Kitchen KC. A transplantable insulinoma in the rat. Proc Natl Acad Sci USA 74: 628–632, 1977 [DOI] [PMC free article] [PubMed] [Google Scholar]
- 10. Cretolle C, Fekete CN, Jan D, Nassogne MC, Saudubray JM, Brunelle F, Rahier J. Partial elective pancreatectomy is curative in focal form of permanent hyperinsulinemic hypoglycaemia in infancy: a report of 45 cases from 1983 to 2000. J Pediatr Surg 37: 155–158, 2002 [DOI] [PubMed] [Google Scholar]
- 11. Dor Y, Brown J, Martinez OI, Melton DA. Adult pancreatic beta-cells are formed by self-duplication rather than stem-cell differentiation. Nature 429: 41–46, 2004 [DOI] [PubMed] [Google Scholar]
- 12. Dor Y, Melton DA. Facultative endocrine progenitor cells in the adult pancreas. Cell 132: 183–184, 2008 [DOI] [PubMed] [Google Scholar]
- 13. Flatt PR, Tan KS, Bailey CJ, Powell CJ, Swanston-Flatt SK, Marks V. Effects of transplantation and resection of a radiation-induced rat insulinoma on glucose homeostasis and the endocrine pancreas. Br J Cancer 54: 685–692, 1986 [DOI] [PMC free article] [PubMed] [Google Scholar]
- 14. Gu C, Stein GH, Pan N, Goebbels S, Hornberg H, Nave KA, Herrera P, White P, Kaestner KH, Sussel L, Lee JE. Pancreatic beta cells require NeuroD to achieve and maintain functional maturity. Cell Metab 11: 298–310, 2010 [DOI] [PMC free article] [PubMed] [Google Scholar]
- 15. Guiot Y, Henquin JC, Rahier J. Effects of glibenclamide on pancreatic beta-cell proliferation in vivo. Eur J Pharmacol 261: 157–161, 1994 [DOI] [PubMed] [Google Scholar]
- 15a. Guiot Y, Stevens M, Marhfour I, Stiernet P, Mikhailov M, Ashcroft SJH, Rahier J, Henquin JC, Sempoux C. Morphological localisation of sulfonylurea receptor 1 in endocrine cells of human, mouse and rat pancreas. Diabetologia 50: 1889–1899, 2007 [DOI] [PubMed] [Google Scholar]
- 16. Guz Y, Nasir I, Teitelman G. Regeneration of pancreatic beta cells from intra-islet precursor cells in an experimental model of diabetes. Endocrinology 142: 4956–4968, 2001 [DOI] [PubMed] [Google Scholar]
- 17. Henquin JC, Cerasi E, Efendic S, Steiner DF, Boitard C. Pancreatic beta-cell mass or beta-cell function? That is the question! Diabetes Obesity Metab 10, Suppl 4: 1–4, 2008 [DOI] [PubMed] [Google Scholar]
- 18. Johnson JD, Ahmed NT, Luciani DS, Han Z, Tran H, Fujita J, Misler S, Edlund H, Polonsky KS. Increased islet apoptosis in Pdx1+/- mice. J Clin Invest 111: 1147–1160, 2003 [DOI] [PMC free article] [PubMed] [Google Scholar]
- 19. Kahn SE. The relative contributions of insulin resistance and beta-cell dysfunction to the pathophysiology of Type 2 diabetes. Diabetologia 46: 3–19, 2003 [DOI] [PubMed] [Google Scholar]
- 20. Kahn SE, Carr DB, Faulenbach MV, Utzschneider KM. An examination of beta-cell function measures and their potential use for estimating beta-cell mass. Diabetes Obesity Metab 10, Suppl 4: 63–76, 2008 [DOI] [PubMed] [Google Scholar]
- 21. Karnik SK, Chen H, McLean GW, Heit JJ, Gu X, Zhang AY, Fontaine M, Yen MH, Kim SK. Menin controls growth of pancreatic beta-cells in pregnant mice and promotes gestational diabetes mellitus. Science 318: 806–809, 2007 [DOI] [PubMed] [Google Scholar]
- 22. Khalaileh A, Gonen-Gross T, Magenheim J, Nir T, Porat S, Salpeter S, Stolovich-Rain M, Swisa A, Weinberg N, Dor Y. Determinants of pancreatic beta-cell regeneration. Diabetes Obesity Metab 10, Suppl 4: 128–135, 2008 [DOI] [PubMed] [Google Scholar]
- 23. Kloppel G, Lohr M, Habich K, Oberholzer M, Heitz PU. Islet pathology and the pathogenesis of type 1 and type 2 diabetes mellitus revisited. Surv Synth Pathol Res 4: 110–125, 1985 [DOI] [PubMed] [Google Scholar]
- 24. Lenzen S. The mechanisms of alloxan- and streptozotocin-induced diabetes. Diabetologia 51: 216–226, 2008 [DOI] [PubMed] [Google Scholar]
- 25. Li WC, Rukstalis JM, Nishimura W, Tchipashvili V, Habener JF, Sharma A, Bonner-Weir S. Activation of pancreatic-duct-derived progenitor cells during pancreas regeneration in adult rats. J Cell Sci 123: 2792–2802, 2010 [DOI] [PMC free article] [PubMed] [Google Scholar]
- 26. Livak KJ, Schmittgen TD. Analysis of relative gene expression data using real-time quantitative PCR and the 2(-Delta Delta C(T)) method. Methods 25: 402–408, 2001 [DOI] [PubMed] [Google Scholar]
- 27. Ludvik B, Nolan J, Baloga J, Sacks D, Olefsky JM. Effect of obesity on insulin resistance in normal subjects and patients with NIDDM. Diabetes 44: 1121–1125, 1995 [DOI] [PubMed] [Google Scholar]
- 28. Marselli L, Sgroi DC, Bonner-Weir S, Weir GC. Laser capture microdissection of human pancreatic beta-cells and RNA preparation for gene expression profiling. Methods Mol Biol 560: 87–98, 2009 [DOI] [PubMed] [Google Scholar]
- 29. Ogilvie RF. The islands of langerhans in 19 cases of obesity. J Pathol Bacteriol 37: 473–481, 1933 [Google Scholar]
- 30. Pang K, Mukonoweshuro C, Wong GG. Beta cells arise from glucose transporter type 2 (Glut2)-expressing epithelial cells of the developing rat pancreas. Proc Natl Acad Sci USA 91: 9559–9563, 1994 [DOI] [PMC free article] [PubMed] [Google Scholar]
- 31. Paris M, Bernard-Kargar C, Berthault MF, Bouwens L, Ktorza A. Specific and combined effects of insulin and glucose on functional pancreatic beta-cell mass in vivo in adult rats. Endocrinology 144: 2717–2727, 2003 [DOI] [PubMed] [Google Scholar]
- 32. Puri S, Hebrok M. Cellular plasticity within the pancreas–lessons learned from development. Dev Cell 18: 342–356, 2010 [DOI] [PMC free article] [PubMed] [Google Scholar]
- 33. Rahier J, Guiot Y, Goebbels RM, Sempoux C, Henquin JC. Pancreatic beta-cell mass in European subjects with type 2 diabetes. Diabetes Obesity Metab 10, Suppl 4: 32–42, 2008 [DOI] [PubMed] [Google Scholar]
- 34. Rahier J, Wallon J, Loozen S, Lefevre A, Gepts W, Haot J. The pancreatic polypeptide cells in the human pancreas: the effects of age and diabetes. J Clin Endocrinol Metab 56: 441–444, 1983 [DOI] [PubMed] [Google Scholar]
- 35. Rahier JGY, Sempoux Ch. Morphological analysis of focal and diffuse forms of congenital hyperinsulinism. Semin Pediatr Surg 20: 3–12, 2011 [DOI] [PubMed] [Google Scholar]
- 36. Rasmussen in Meuer S R, Wittwer C, Nakagawara K. Quantification on the LightCycler. Heidelberg, Germany: Springer, 2001, p. 21–24 [Google Scholar]
- 37. Scaglia L, Smith FE, Bonner-Weir S. Apoptosis contributes to the involution of beta cell mass in the post partum rat pancreas. Endocrinology 136: 5461–5468, 1995 [DOI] [PubMed] [Google Scholar]
- 38. Sempoux C, Capito C, Bellanne-Chantelot C, Verkarre V, de Lonlay P, Aigrain Y, Fekete C, Guiot Y, Rahier J. Morphological mosaicism of the pancreatic islets: a novel anatomopathological form of persistent hyperinsulinemic hypoglycemia of infancy. J Clin Endocrinol Metab 96: 3785–3793, 2011 [DOI] [PubMed] [Google Scholar]
- 39. Sempoux C, Guiot Y, Dahan K, Moulin P, Stevens M, Lambot V, de Lonlay P, Fournet JC, Junien C, Jaubert F, Nihoul-Fekete C, Saudubray JM, Rahier J. The focal form of persistent hyperinsulinemic hypoglycemia of infancy: morphological and molecular studies show structural and functional differences with insulinoma. Diabetes 52: 784–794, 2003 [DOI] [PubMed] [Google Scholar]
- 40. Sempoux C, Guiot Y, Lefevre A, Nihoul-Fekete C, Jaubert F, Saudubray JM, Rahier J. Neonatal hyperinsulinemic hypoglycemia: heterogeneity of the syndrome and keys for differential diagnosis. J Clin Endocrinol Metab 83: 1455–1461, 1998 [DOI] [PubMed] [Google Scholar]
- 41. Sempoux C, Guiot Y, Rahier J. The focal form of persistent hyperinsulinemic hypoglycemia of infancy. Diabetes 50, Suppl 1: S182–S183, 2001 [DOI] [PubMed] [Google Scholar]
- 42. Sorenson RL, Brelje TC. Adaptation of islets of Langerhans to pregnancy: beta-cell growth, enhanced insulin secretion and the role of lactogenic hormones. Horm Metab Res 29: 301–307, 1997 [DOI] [PubMed] [Google Scholar]
- 43. Thorel F, Nepote V, Avril I, Kohno K, Desgraz R, Chera S, Herrera PL. Conversion of adult pancreatic alpha-cells to beta-cells after extreme beta-cell loss. Nature 464: 1149–1154, 2010 [DOI] [PMC free article] [PubMed] [Google Scholar]
- 44. Wang S, Jensen JN, Seymour PA, Hsu W, Dor Y, Sander M, Magnuson MA, Serup P, Gu G. Sustained Neurog3 expression in hormone-expressing islet cells is required for endocrine maturation and function. Proc Natl Acad Sci USA 106: 9715–9720, 2009 [DOI] [PMC free article] [PubMed] [Google Scholar]
- 45. Wang ZV, Mu J, Schraw TD, Gautron L, Elmquist JK, Zhang BB, Brownlee M, Scherer PE. PANIC-ATTAC: a mouse model for inducible and reversible beta-cell ablation. Diabetes 57: 2137–2148, 2008 [DOI] [PMC free article] [PubMed] [Google Scholar]
- 46. Xu X, D'Hoker J, Stange G, Bonne S, De Leu N, Xiao X, Van de Casteele M, Mellitzer G, Ling Z, Pipeleers D, Bouwens L, Scharfmann R, Gradwohl G, Heimberg H. Beta cells can be generated from endogenous progenitors in injured adult mouse pancreas. Cell 132: 197–207, 2008 [DOI] [PubMed] [Google Scholar]
- 47. Yoon KH, Ko SH, Cho JH, Lee JM, Ahn YB, Song KH, Yoo SJ, Kang MI, Cha BY, Lee KW, Son HY, Kang SK, Kim HS, Lee IK, Bonner-Weir S. Selective beta-cell loss and alpha-cell expansion in patients with type 2 diabetes mellitus in Korea. J Clin Endocrinol Metab 88: 2300–2308, 2003 [DOI] [PubMed] [Google Scholar]