

Abstract
An overactive renin-angiotensin system (RAS) is known to contribute to type 2 diabetes mellitus (T2DM). Although ACE2 overexpression has been shown to be protective against the overactive RAS, a role for pancreatic ACE2, particularly in the islets of Langerhans, in regulating glycemia in response to elevated angiotensin II (Ang II) levels remains to be elucidated. This study examined the role of endogenous pancreatic ACE2 and the impact of elevated Ang II levels on the enzyme's ability to alleviate hyperglycemia in an Ang II infusion mouse model. Male C57bl/6J mice were infused with Ang II or saline for a period of 14 days. On the 7th day of infusion, either an adenovirus encoding human ACE2 (Ad-hACE2) or a control adenovirus (Ad-eGFP) was injected into the mouse pancreas. After an additional 7–8 days, glycemia and plasma insulin levels as well as RAS components expression and oxidative stress were assessed. Ang II-infused mice exhibited hyperglycemia, hyperinsulinemia, and impaired glucose-stimulated insulin secretion from pancreatic islets compared with control mice. This phenotype was associated with decreased ACE2 expression and activity, increased Ang II type 1 receptor (AT1R) expression, and increased oxidative stress in the mouse pancreas. Ad-hACE2 treatment restored pancreatic ACE2 expression and compensatory activity against Ang II-mediated impaired glycemia, thus improving β-cell function. Our data suggest that decreased pancreatic ACE2 is a link between overactive RAS and impaired glycemia in T2DM. Moreover, maintenance of a normal endogenous ACE2 compensatory activity in the pancreas appears critical to avoid β-cell dysfunction, supporting a therapeutic potential for ACE2 in controlling diabetes resulting from an overactive RAS.
Keywords: angiotensin II, angiotensin-converting enzyme 2, angiotensin II type 1 receptor, type 2 diabetes mellitus, β-cell dysfunction, oxidative stress
angiotensin ii (Ang II), a key component of the renin-angiotensin system (RAS), plays a pivotal role in mediating insulin resistance (15, 16, 18, 33) and impaired glucose tolerance (27), thereby contributing to the development of type 2 diabetes mellitus (T2DM). Several clinical trials have explored the benefits of RAS blockade in controlling T2DM. A recent meta-analysis by Tocci et al. (41) showed that angiotensin-converting enzyme (ACE) inhibitors or Ang II type 1 receptor (AT1R) blockers reduce the risk for new-onset T2DM in individuals with hypertension or an elevated risk for cardiovascular events. In light of these beneficial effects, agents that counteract or block the RAS may have a potential for treatment of T2DM. ACE2 is a carboxypeptidase that converts Ang II to Ang-(1–7), whose signaling opposes that of Ang II. ACE2 thus provides a compensatory mechanism to counter the detrimental effects resulting from an overactive RAS (13, 14, 43). ACE2 plays a significant role in glucose homeostasis. ACE2-knockout mice exhibit impaired glucose tolerance and insulin resistance compared with age-matched wild-type littermates (4, 28). In addition, recently, our laboratory has demonstrated the beneficial effects of ACE2 gene therapy on glucose regulation and β-cell function in diabetic db/db mice (3), a genetic model of obesity-induced diabetes. Interestingly, upregulation of classic components of the RAS (e.g., ACE and AT1R) has been reported in animal models of T2DM (11, 40). These findings suggest a significant role for the RAS components in regulating glucose homeostasis. However, the importance of pancreatic ACE2, especially in the islet of Langerhans during Ang II-mediated hyperglycemia, remains to be elucidated. Therefore, the goals of this study were to assess 1) the impact of RAS overactivity on local ACE2 in the pancreas, 2) whether modulation of ACE2 expression in the pancreas is linked to the development of hyperglycemia, and 3) whether normalization of ACE2 expression and/or activity in the pancreas could attenuate the development of T2DM. We further aimed at identifying some of the mechanisms by which ACE2 exerts its benefits in an Ang II-induced hyperglycemia mouse model. Because of their association with T2DM and/or the RAS, we focused on the expression of AT1R (11), oxidative stress (reactive oxygen species and gp91phox) (20, 26, 32), and blood flow in the pancreas (6, 7) and/or islets. We hypothesized that RAS overactivity diminishes pancreatic ACE2 expression and/or activity, leading to hyperglycemia, and that restoration of pancreatic ACE2 levels by adenovirus encoding human ACE2 (Ad-hACE2) therapy attenuates Ang II-mediated hyperglycemia.
RESEARCH DESIGN AND METHODS
Ang II infusion model.
Mice were housed in a temperature- and humidity-controlled facility under a 12:12-h dark-light cycle. All mice were fed standard mouse chow and water ad libitum. Male C57bl/6J mice (8–10 wk old) were anesthetized with isoflurane (2%) in an oxygen flow (1 l/min) and placed on a heating pad to maintain body temperature. An incision was made in the skin in the peritoneal region, and a small pocket was formed subcutaneously using a hemostat. Osmotic pumps (model 2002; Alzet, Cupertino, CA) filled with Ang-II (200 ng·kg−1·min−1) or vehicle (saline) were inserted into the pocket, and the incision was closed with sutures. After 7 days of Ang II infusion (Fig. 1A), a subset of mice was injected with Ad-hACE2 (5 × 10⁷ plaque-forming units; n = 8) (14) in a total volume of 100 μl of 0.9% saline, whereas others were injected with a control adenovirus expressing enhanced green fluorescent protein (Ad-eGFP; 5 × 10⁷ plaque-forming units; n = 8) in the pancreas as described (3).
Fig. 1.
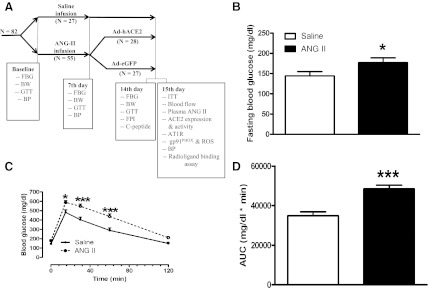
Glycemic parameters following angiotensin II (Ang II) infusion. A: experimental design and various parameters measured 1 and 2 wk after Ang II infusion. Following measurement of baseline parameters, C57Bl/6J mice (n = 82) were infused with saline or Ang II (200 ng·kg−1·min−1). B–D: fasting blood glucose (FBG) level (B), glucose tolerance (C), and the corresponding area under the curve (AUC; D) were measured after 7 days of infusion. Statistical significance: *P < 0.05 and ***P < 0.001 vs. saline using unpaired 1-tailed t-test (B and D) and repeated-measures ANOVA, followed by Bonferroni's posttest (C). BW, body weight; GTT, glucose tolerance test; ITT, insulin tolerance test; BP, blood pressure; ACE2, angiotensin-converting enzyme 2; ROS, reactive oxygen species; FPI, fasting plasma insulin.
A separate group of mice (n = 12) was implanted with blood pressure (BP) telemetry probes, as described previously (5). Following recovery, BP was measured continuously for 1 h at baseline and after 7 and 14 days of Ang II infusion. On the 15th day, after measurement of physiological parameters, all animals were euthanized and blood and pancreata collected. All procedures were performed according to the National Institutes of Heath guidelines and approved by the Institutional Animal Care and Use Committee at the Louisiana State University Health Sciences Center (protocol no. 2666).
Glucose, insulin, C-peptide, and Ang II measurements.
Following overnight fasting (12–15 h), the mouse tail vein was pricked and blood glucose concentration measured using a glucometer (TRUEtrack, Ft. Lauderdale, FL). This measurement was considered fasting blood glucose (FBG) level or a 0-min blood glucose level. For glucose tolerance test a 2 g/kg glucose solution in 0.9% saline was then injected intraperitoneally, and blood glucose concentrations were measured at 15, 30, 60, and 120 min postinjection. For the insulin tolerance test, mice were fasted for 4 h and weighed, and insulin (0.75 U/kg, Humulin R; Eli Lilly) was injected intraperitoneally. Blood was sampled from the tail vein, and glucose was measured before and at 5, 10, 20, 60, and 120 min postinjection, as described above. Plasma insulin was measured by ELISA (90080; Crystal Chem) according to the manufacturer's protocol. The homeostatic model assessment of insulin resistance (HOMA-IR) was calculated using the following formula: fasting blood glucose (mmol/l) × fasting plasma insulin (mU/l)/22.5 (8). For C-peptide and Ang II levels blood was collected on the 15th day of Ang II infusion, and the serum C-peptide and plasma Ang II concentrations were measured by ELISA [80-CPTMS-E01 (ALPCO Diagnostics) and FEK-002-12 (Phoenix Pharmaceuticals)].
Glucose-stimulated insulin secretion.
Following euthanasia on the 15th day of the experiment, a midline incision was made and the bile duct exposed. The pancreata were distended by injecting 2 ml of Liberase TL (Roche 05401020001, 1.3 Wünsch units/ml in RPMI 1640 medium) via the bile duct, and the remaining procedure was carried out as reported previously (48). The pancreata, placed in 50-ml conical tubes, were incubated for 14 min at 37°C in a water bath for digestion. Following digestion, the islets were separated from exocrine tissue under a dissecting microscope and hand picked using transfer pipettes. The purified islets were transferred to a petri dish containing RPMI 1640 medium with l-glutamine (20 mM), penicillin (100 U/ml), streptomycin (100 μg/ml), and FBS (10%). After 48 h of incubation in 5% CO2 incubator at 37°C, the islets were processed for a glucose-stimulated insulin secretion (GSIS) test. The islets (n = 20/Eppendorf tube) were preincubated in 2.8 mM glucose-KRBH solution (115 mM NaCl, 5 mM KCl, 24 mM NaHCO3, 2.5 mM CaCl2, 1 mM MgCl2, 10 mM HEPES, and 2% wt/vol BSA, pH 7.4) for 30 min at 37°C. The KRBH solution was then discarded, and the islets were incubated in KRBH solution containing different concentrations of glucose (2.8, 11.1, and 25.0 mM) for 1 h at 37°C. After incubation, the solution was collected and stored at −80°C for insulin assay.
ACE2 activity.
ACE2 activity was measured by an assay optimized in our laboratory (29). Ten micrograms of protein from the pancreatic extracts was used for the assay. The hydrolysis rate was quantified as fluorescence units (FU) per minute per microgram of protein. A Spectramax M2 microplate reader (Molecular Devices, Sunnyvale, CA) was used to measure the fluorescence emitted at 405 nm after excitation at 320 nm.
Measurement of blood flow to the pancreas.
Mice were anesthetized using isoflurane (2%) in an oxygen flow (1 l/min) chamber, and then carotid and femoral arteries were cannulated. Fluorescent microspheres (∼250,000/injection, F8836; FluoSpheres, Molecular Probes), supplied as a suspension in 10 ml of 0.15 M NaCl with 0.05% Tween-20 and 0.02% thimerosal at a concentration of 3.6 × 10⁶ microspheres/ml, were injected into the ascending aorta via the left carotid catheter for 20 s. Blood samples were withdrawn from the left femoral artery catheter beginning 20 s before microsphere infusion and continuing for 60 s at a rate of 0.15 ml/min. Saline was infused at 0.15 ml/min immediately after microsphere infusion to replace blood loss. Five minutes after microsphere injection, the mice were euthanized and the pancreata harvested and digested in ∼8 ml of ethanolic KOH at 50°C in 15-ml polypropylene tubes. The remaining sediment and microspheres were collected by centrifugation at 2,000 g for 10 min and washed with PBS twice prior to extraction of the fluorescent dye with xylene. The reference blood sample was processed and microsphere content determined as described for the pancreata samples. Blood flow to the pancreas was calculated according to the following equation Fi = (Ii)(R)/Iref, where Fi is the flow to the pancreas (ml/min), Ii is the fluorescence intensity in the pancreas sample, Iref is the fluorescence intensity in the reference blood sample, and R is the reference blood sample withdrawal rate (0.15 ml/min). Fluorescence intensity was measured on a fluorescent plate reader at an excitation of 540 nm and an emission of 560 nm.
Radioligand-binding assay.
Pancreatic AT1R expression was evaluated by radioligand-binding assays of specific 125I-sarcosine1, isoleucine8 Ang-II (125I-SI-Ang-II) binding (36). Frozen pancreata were weighed and homogenized in 25 ml of hypotonic (20 mM sodium phosphate) buffer, pH 7.2. The membranes were precipitated by centrifugation at 48,000 g for 20 min at 4°C. The membranes were resuspended in 25 ml of assay buffer (150 mM NaCl, 5 mM EDTA, 0.1 mM bacitracin, 0.1 mM phenylmethylsulfonyl fluoride, 0.1 mM o-phenanthroline, and 50 mM sodium phosphate), pH 7.2. The membranes were again precipitated by centrifugation at 48,000 g for 20 min at 4°C. The membranes were resuspended in 1.4 ml of assay buffer, with the addition of the AT2R antagonist PD-123319 (10 μM) by homogenization. Membrane homogenate (50 μl) was added to tubes containing 125I-SI Ang-II at six concentrations ranging from 0.2 to 4 nM in quadruplicate. One-half of the tubes contained Ang II at a final concentration of 10 μM in a final assay volume of 100 μl. The tubes were incubated for 1 h at ambient temperature. The bound 125I-SI-Ang-II was separated from unbound 125I-SI-Ang II by filtration on GF/B filters (Brandel, Gaithersburg, MD) using a Brandel cell harvester. The filters were quickly rinsed three times with 50 mM sodium potassium phosphate buffer, pH 7.4, applied to the incubation tubes. Bound 125I-SI-Ang-II was determined by γ-scintillation counting of the filters in 12 × 75-mm glass culture tubes using a Packard Cobra II γ-counter at 70% efficiency.
Western blotting and dihydroethidium (DHE) staining for the pancreata were performed as described previously (6, 44). Immunohistochemistry was performed as reported earlier (14) using anti-AT1R (1:30 dilution, sc-1173; Santa Cruz Biotechnology), anti-ACE2 [1:50 dilution, sc-20998 (LS-B3197; LifeSpan Biosciences), or anti-insulin (1:100, ab7842; Abcam)] primary antibodies. Alexa Fluor 488 and Alexa Fluor 546 (1:200 dilution, A11008 and A11074; Life Technologies) were utilized as secondary antibodies.
Statistics.
Data are presented as means ± SE. Unless otherwise stated, data were analyzed by Student's t-test, one-way ANOVA followed by Tukey's post hoc test for multiple comparisons between means, or repeated-measures ANOVA followed by Bonferroni's post hoc test for multiple comparisons, as appropriate, using Prism 5 (GraphPad Software, San Diego, CA). Differences were considered statistically significant at P < 0.05.
RESULTS
Ang II infusion impairs glycemia and reduces endogenous ACE2 in the pancreas.
Although an overactive systemic RAS has been suggested to impair glucose and insulin homeostasis, the development of T2DM as a result of increased Ang II remains to be characterized. We hypothesized that a chronic increase in plasma Ang II levels would contribute to hyperglycemia and impair glucose tolerance in mice.
To test our hypothesis, we infused mice with 0.9% saline or a subpressor dose of Ang II (200 ng·kg−1·min−1) and monitored hemodynamic and metabolic parameters (Fig. 1A). This Ang II dose caused only a minor increase in blood pressure after infusion for 7 days and did not produce a significant increase after 2 wk compared with saline-infused mice (Table 1), thereby allowing us to determine the metabolic effects of Ang II independently of hypertension per se. The mice did not differ significantly before infusion with regard to FBG (166.3 ± 9.3 and 156.8 ± 12.2 mg/dl for the saline and Ang II groups, respectively) and glucose tolerance [area under the curve (AUC): 37,623 ± 2,205 and 37,886 ± 1,598 mg·dl−1·min−1, saline and Ang II groups respectively]. After 7 days of Ang II infusion, FBG was significantly higher (177.4 ± 10.4 vs. 144.6 ± 11.4 mg/dl, P < 0.05), and glucose tolerance was significantly reduced (AUC: 48,471 ± 1,845 vs. 34,885 ± 1,951 mg·dl−1·min−1, P < 0.05) compared with saline-infused mice (Fig. 1, B–D). Moreover, the effect of Ang II on FBG was even more pronounced after 14 days of infusion (Fig. 3A), suggesting that elevated Ang II levels can lead to impaired blood glucose homeostasis.
Table 1.
Metabolic and hemodynamic parameters
| 7th Day |
15th Day |
|||||
|---|---|---|---|---|---|---|
| Baseline | Saline | Ang II | Saline | Ang II + Ad-eGFP | Ang II + Ad-hACE2 | |
| Body weight, g | 23.2 ± 0.4 (23) | 23.6 ± 0.7 (7) | 24.8 ± 0.5 (16) | 25.4 ± 0.5 (7) | 24.5 ± 0.7 (8) | 24.2 ± 0.8 (8) |
| MAP, mmHg | 96 ± 2 (12) | 99 ± 2 (5) | 108 ± 2 (7)** | 99 ± 3 (5) | 104 ± 2 (4) | 105 ± 4 (3) |
| Blood flow, ml/min | 2.1 ± 0.4 (7)a | 1.2 ± 0.2 (8) | 1.3 ± 0.2 (8) | |||
| Plasma Ang II, pg/ml | 180 ± 1 (6) | 701 ± 19 (6)b | 692 ± 27 (6)b | |||
Values are means ± SE. Ang II, angiotensin II; Ad-eGFP, control adenovirus expressing enhanced green fluorescent protein; Ad-hACE2, an adenovirus encoding human angiotensin-converting enzyme 2; MAP, mean arterial pressure. Physiological parameters were determined for the no. of mice indicated in parentheses. One-way ANOVA for blood flow measurement showed a significant difference (P = 0.047) between the means of the 3 groups.
P < 0.05 for a post hoc contrast between the mean for the saline group and the mean for all the Ang II-treated mice. For plasma Ang II, Bartlett's test of homogeneity of variance showed that the 3 groups had unequal variances (P < 0.001).
All individual values are above the 99.9% confidence interval of the Ang II parameter for the saline group.
P < 0.01 vs. saline using unpaired t-test.
Fig. 3.

Restoration of pancreatic ACE2 by Ad-hACE2 gene therapy attenuates hyperglycemia. Seven days after pancreatic injection of Ad-hACE2 (n = 8) or the control adenovirus Ad-eGFP (n = 8), FBG level (A), glucose tolerance (B), and the corresponding AUC (C) were determined in saline and Ang II-infused mice. Statistical significance: ***P < 0.001 vs. saline; #P < 0.05 vs. Ang-II + Ad-eGFP using 1-way ANOVA, followed by Tukey's multiple comparison test.
Importantly, infusion of Ang II was shown to result in a dramatic reduction of ACE2 protein expression (Fig. 2, A and C) in the islets and the pancreas. In addition, elevated Ang II resulted in a significant decrease in pancreatic ACE2 activity (75.5 ± 4.3 vs. 176.9 ± 8.6 FU·min−1·μg−1 protein, P < 0.05; Fig. 2D), suggesting a link between reduced ACE2 in the pancreas and impaired glycemic control.
Fig. 2.

Elevated Ang II downregulates ACE2 expression in the islets and reduces pancreatic ACE2 activity. A: mice treated with Ang II and the control adenovirus (Ad-eGFP) show a reduced mouse ACE2 (mACE2) expression, whereas intrapancreatic Ad-hACE2 injection restored the total amount of ACE2 in the islets. B: Ad-hACE2 was successfully delivered to the islets, as confirmed with hACE2 antibody that does not detect mACE2 (left) but does detect hACE2 (right). C: pancreatic ACE2 protein expression, determined by Western blot, confirmed both ACE2 protein reduction in Ang II-infused mice and rescue in the Ad-hACE2-treated group. D: pancreatic ACE2 activity was reduced by Ang II exposure and normalized following Ad-hACE2 treatment. Quantification for Western blot was performed from 3 blots and a total of 7 individual samples in each group. Statistical significance: *P < 0.05 and **P < 0.01 vs. saline; #P < 0.05 vs. Ang II + Ad-eGFP using 1-way ANOVA, followed by Tukey's multiple comparison test. The contrast for red channel (insulin staining) was enhanced using Adobe Photoshop 7.0 for digital quality purpose only. PC, positive control. No 1° Ab, no primary antibody.
To assess this relationship, on the 7th day of Ang II infusion, mice were injected with either intrapancreatic Ad-hACE2 or Ad-eGFP. The success of Ad-hACE2 injections was confirmed by the detection of hACE2 in the islets (Fig. 2B, right), using an antibody (LS-B3197; LifeSpan Biosciences) that does not cross-react with mouse ACE2 (mACE2; Fig. 2B, left). Ad-hACE2 treatment completely abolished the decrease in ACE2 expression in the islets (Fig. 2A) and pancreas (Fig. 2C) of Ang II-infused mice. Moreover, ACE2 activity in the pancreata was significantly higher (226.4 ± 38.9 FU·min−1·μg−1 protein; Fig. 2D) than in Ang II-infused Ad-eGFP-injected mice, confirming that Ad-hACE2 treatment restored both ACE2 expression and activity in Ang II-treated mice.
Interestingly, after 14 days of infusion, when plasma Ang II levels were significantly elevated (Table 1), the FBG level (Fig. 3A) was significantly lower in mice treated with the hACE2-encoding adenovirus compared with those treated with the control virus (167.8 ± 4.5 vs. 212.3 ± 11.6 mg/dl, P < 0.05). Moreover, treatment with Ad-hACE2 led to a significant improvement in glucose tolerance (Fig. 3, B and C) compared with mice injected with Ad-eGFP (40,836 ± 1,486 vs. 50,489 ± 3,422 mg·dl−1·min−1, P < 0.05). Body weight was not significantly affected by either Ang II infusion or virus injection during the course of the study (Table 1). These data highlight the critical role of pancreatic ACE2 in the maintenance of glycemic control in Ang II-infused mice. Saline-infused mice were not treated with Ad-hACE2, as it has been previously reported by our group (3, 37) that this treatment does not affect the physiological parameters in healthy rodents.
Restoration of pancreatic ACE2 levels counteracts Ang II-mediated defects in insulin sensitivity and β-cell function.
As illustrated in saline-infused mice, increasing concentrations of glucose produced dose-dependent increase in insulin secretion (Fig. 4A). However, islets isolated from Ad-eGFP-treated, Ang II-infused mice secreted significantly higher insulin than those from control mice at low glucose concentrations (2.8 mM glucose: 0.7 ± 0.1 vs. 0.5 ± 0.03 and 0.4 ± 0.04 ng insulin·islet−1·h−1, respectively, P < 0.05). In addition, the islets harvested from Ad-eGFP-treated Ang-II-infused mice did not show any significant increase in insulin secretion following stimulation with increased glucose concentrations (Fig. 4A), as observed in the islets isolated from control mice. Conversely, Ad-hACE2 treatment restored GSIS in the islets isolated from Ang II-infused mice. These observations suggest that chronically elevated Ang II mediates β-cell dysfunction, leading to impaired insulin secretion, whereas ACE2 expression prevents the deteriorating effects of Ang II and corrects impaired insulin secretion in the islets isolated from Ad-hACE2-treated, Ang II-infused mice.
Fig. 4.

Ad-hACE2 gene therapy corrects insulin secretion and sensitivity in Ang II-infused mice. A–F: 7 days after pancreatic injection of Ad-hACE2 (n = 8) or the control adenovirus Ad-eGFP (n = 8), GSIS (20 islets/mouse; n = 3) (A), fasting plasma insulin level (B), C-peptide levels (C), the homeostasis model assessment-estimated insulin resistance (HOMA-IR; D), insulin tolerance (E), and the corresponding AUC (F) were determined in saline and Ang II-infused mice. G: Ad-hACE2 treatment restored GSIS in Ang II-exposed mouse islets (20 islets/mouse; n = 3). Statistical significance: *P < 0.05 vs. saline; #P < 0.05 vs. Ang-II + Ad-eGFP using 1-way ANOVA, followed by Tukey's multiple comparison test (B, C, D, and F), and repeated-measures ANOVA, followed by Bonferroni's posthoc test (E). For GSIS (A and G): * and #P < 0.05 vs. 2.8 mM glucose or Ang II + Ad-eGFP; @P < 0.05 vs. saline; $P < 0.05 vs. Ang-II + Ad-eGFP using 2-way ANOVA, followed by Bonferroni's post hoc test.
After 2 wk of infusion, fasting plasma insulin levels showed a significant, approximately twofold increase (Fig. 4B) in Ang II-infused Ad-eGFP-injected mice compared with saline-infused animals (0.9 ± 0.2 vs. 0.4 ± 0.1 ng/ml, respectively, P < 0.05). Treatment of Ang II-infused mice with Ad-hACE2 significantly reduced fasting plasma insulin (0.4 ± 0.1 ng/ml, P < 0.05) back to control levels. To determine whether Ang II-infused mice exhibit hyperinsulinemia as a result of increased insulin secretion or insulin resistance, we determined the serum C-peptide levels, an index of insulin secretion (Fig. 4C). Ad-eGFP-injected Ang II-infused mice showed significantly higher serum C-peptide levels (5.7 ± 0.6 vs. 2.5 ± 0.2 ng/ml, P < 0.05) compared with the saline-infused group. On the other hand, serum C-peptide levels were significantly decreased in Ad-hACE2-treated, Ang-II-infused mice (2.9 ± 0.2 ng/ml), suggesting that ACE2 can reverse Ang II-induced impaired insulin secretion in mice. However, insulin resistance was also elevated, as evidenced by the observation of increased HOMA-IR in Ad-eGFP-treated, Ang-II-infused mice compared with saline-treated animals (6.1 ± 0.8 vs. 3.0 ± 0.5 mmol·l−1·mU−1·l−1, respectively, P < 0.05), and hACE2 expression to the pancreas significantly returned HOMA-IR to control levels (3.2 ± 0.8 mmol·l−1·mU−1·l−1; Fig. 4D). In addition, Ad-eGFP-treated, Ang-II-infused mice exhibited impaired insulin sensitivity (Fig. 4E) at 10 and 20 min postinsulin injection, as evidenced by higher blood glucose levels at those time points compared with saline-infused mice. The mean AUC for the Ang II-infused mice treated with Ad-eGFP was 24 and 23% higher than the saline group and the Ang II + Ad-hACE2 group, respectively (Fig. 4F), although the differences between the groups did not reach statistical significance. Altogether, these data show that hyperinsulinema in Ang II-infused mice resulted from both elevated insulin secretion and insulin resistance, and these effects were reversed by ACE2 gene therapy.
To test the direct effect of Ang II and hACE2 therapy on mouse islets in vitro, we exposed the Ad-eGFP/Ad-hACE2-transduced islets to Ang II (100 nM) for 24 h. Ang II exposure significantly reduced GSIS at 25 mM glucose concentration compared with control (1.8 ± 0.1 vs. 3 ± 0.2 ng·islet−1·h−1, P < 0.05; Fig. 4G), and hACE2 treatment attenuated the Ang II-mediated reduction of GSIS (2.6 ± 0.1 ng·islet−1·h−1).
Overall, the data indicate that the delivery of a hACE2-encoding adenovirus to the pancreas reverses both impaired insulin secretion and insulin resistance caused by Ang II infusion. Moreover, Ang II-impaired GSIS is corrected by hACE2 therapy in the isolated mouse islets in vitro.
Potential mechanisms involved in the beneficial effects of pancreatic ACE2 expression.
To determine the mechanisms involved in the beneficial effects of ACE2, we investigated blood flow, AT1R expression, and oxidative stress in the pancreata and islets.
The blood flow to the pancreas has previously been suggested as a modulator of insulin secretion. Using a fluorescent microsphere technique, we observed that blood flow was reduced significantly (Table 1) in Ad-eGFP-injected, Ang II-infused mice compared with saline-treated mice. However, Ad-hACE2-treated, Ang II-infused mice did not exhibit any improvement in blood flow, suggesting that pancreatic ACE2 gene therapy did not affect local blood flow in Ang II-infused mice.
As the main receptor mediating the effects of Ang II, expression of the AT1R was assessed in both islets and pancreas. Immunohistochemistry (Fig. 5, A and B) was used to probe AT1R expression in the different groups of mice. Ad-eGFP-treated, Ang II-infused mice showed a significant (2.5-fold) increase in AT1R expression in the islets compared with controls. The upregulation of AT1R in the islets of Ang II-infused mice was attenuated by Ad-hACE2 treatment, suggesting a direct beneficial effect of ACE2 on the islets of Langerhans. Interestingly, we observed that AT1R expression was abundant in the nucleus, suggesting an involvement of the intracellular RAS in the islets of Ang II-infused mice. Moreover, Western blot for AT1R shows that pancreatic AT1R protein expression (Fig. 5C) was increased significantly (+67%) in Ang II-infused mice injected with Ad-eGFP compared with control mice, whereas there was no significant difference between Ad-hACE2-treated and saline groups. Therefore, ACE2 appears to have attenuated AT1R upregulation in Ang II-infused mice, although the difference between mice treated with Ad-eGFP and Ad-hACE2 did not reach statistical significance (P = 0.07). Given the doubts raised about the specificity of the antibodies detecting AT1R in the recent report (2), we carried out radioligand-binding assay to further validate our observations regarding AT1R expression in the pancreas. Although the ANOVA did not reach significance, the binding assay showed a similar trend (P = 0.07; Fig. 5D) toward increasing AT1R in the pancreas of Ang II + Ad-eGFP-treated mice. Using a Student t-test to compare the two groups of Ang II-treated mice, our data show a significant (P < 0.05) reduction of AT1R expression in Ad-hACE2-treated animals. Altogether, these data suggest that Ang II infusion leads to an increase in AT1R expression in the pancreas that could be reversed by Ad-hACE2 therapy.
Fig. 5.
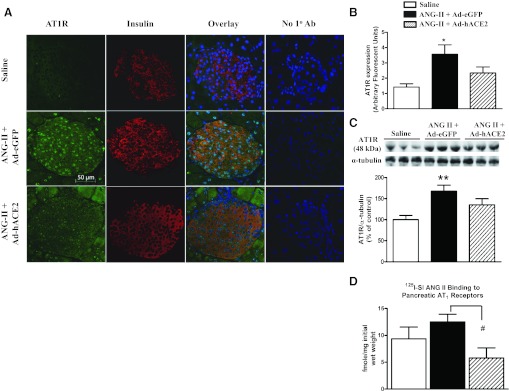
Normalization of ACE2 in the islets attenuates Ang II-mediated increase in Ang II type 1 receptor (AT1R) expression. Seven days after pancreatic injection of Ad-hACE2 or the control Ad-eGFP, AT1R expression in the islets (A and B) and the pancreas (C and D) was determined by immunohistochemistry, Western blot, and radioligand-binding assay. The quantification for Western blot (graph below the blot in C) was performed from 2 blots that included 6 total individual samples in each group; n = 4 mice/group, ≥3 sections/mouse and 3 islets/section, for immunohistochemistry. D: specific (10 μM) Ang II displaceable binding of 125I-sarcosine1,isoleucine8 Ang-II (125I-SI-Ang II; 3–4 nM) to pancreatic membranes (n = 5; P = 0.07). Statistical significance: *P < 0.05 and **P < 0.01 vs. saline, using 1-way ANOVA, followed by Tukey's multiple comparison test; #P < 0.05 vs. Ang-II + Ad-eGFP unpaired 1-tailed t-test. The contrast for red channel (insulin staining) was enhanced using Adobe Photoshop 7.0 for digital quality purpose only.
To study the protective role of ACE2 against oxidative stress in the pancreas, pancreata sections were stained with DHE to estimate reactive oxygen species levels. The pancreata collected from Ad-eGFP-injected, Ang II-infused mice exhibited a significant 65% increase (Fig. 6, A and B) in DHE-staining intensity compared with pancreata from control mice. This increase was significantly blunted in Ad-hACE2-treated mice, suggesting that ACE2 delivery to the pancreas reduces pancreatic oxidative stress mediated by Ang II.
Fig. 6.

Oxidative stress in the pancreas. Following 7 days of treatment with Ad-hACE2 or the control virus (Ad-eGFP), oxidative stress was assessed in the mouse pancreas by determining dihydroethidium (DHE) fluorescence and gp91phox expression. A: representative fluorescent (left) and brightfield images (right) of sections from mice pancreata are presented for each group. B: quantification was performed from 6 samples from different mice in saline and Ad-eGFP groups and 7 samples in the Ad-hACE2 group using Image J software. C: the quantification for gp91phox was performed from 3 blots, which included a total of 9 individual samples in each treatment group. Statistical significance: ***P < 0.001 vs. saline; #P < 0.01 vs. Ang-II + Ad-eGFP using 1-way ANOVA followed by Tukey's multiple comparison test. D: tempol (10 μM) restored GSIS in Ang II-exposed mouse islets. * and #P < 0.05 vs. 2.8 mM glucose and Ang II + saline group using 2-way ANOVA followed by Bonferroni's post hoc test.
As the main subunit of the NAD(P)H oxidase, gp91phox plays a critical role in the formation of reactive oxygen species and mediating oxidative stress in β-cells (20). To further confirm the role of ACE2 in attenuating oxidative stress, gp91phox expression was assessed by Western blotting. There was a significant 70% increase in pancreatic gp91phox expression in Ad-eGFP-injected mice compared with controls (Fig. 6C), and this was significantly attenuated in Ad-hACE2-treated mice, exhibiting only a modest 12% increase in gp91phox expression compared with controls. To confirm the implication of oxidative stress in the regulation of glycemia, we determined the effect of tempol, a superoxide dismutase mimetic drug, on GSIS from the mouse islets. Indeed, tempol increased GSIS significantly at 25.0 mM glucose concentration from Ang II-exposed mouse islets compared with control (3.0 ± 0.4 vs. 1.7 ± 0.01 ng·islet−1·h−1, P < 0.05; Fig. 6D), underscoring the involvement of oxidative stress in controlling glycemia.
DISCUSSION
RAS overactivity affects glycemia and diabetes-related morbidity (10). Over the last decade, the discovery of new RAS components such as ACE2 and the Mas receptor has prompted the recognition of a compensatory RAS (1, 12) in disease and health. Although a local pancreatic RAS has been identified (9, 22–24) and components such as Ang II, AT1R, and ACE2 have been reported in different cell types, including β-cells (3, 4, 22, 38, 47), the role of pancreatic ACE2 in the face of RAS overactivity remains to be investigated. In the present study, we aimed to 1) address the impact of RAS overactivity on local ACE2 in the pancreas, 2) address whether modulation of ACE2 expression in the pancreas is linked to the development of hyperglycemia, 3) address whether normalization of ACE2 expression and/or activity in the pancreas could attenuate the development of T2DM, and 4) identify some of the mechanisms by which ACE2 could be beneficial in an Ang II-induced hyperglycemia mouse model.
Our data show that nonpressor Ang II levels lead to increased FBG, impaired glucose tolerance, hyperinsulinemia in mice, and impaired GSIS in isolated islets. These changes were associated with increased AT1R levels, decreased ACE2 expression and activity, and increased oxidative stress in the pancreas, all contributing to β-cell dysfunction. On the other hand, ACE2 gene therapy reduced hyperglycemia and plasma insulin levels, improved glucose tolerance, and restored GSIS in islets. These beneficial effects of ACE2 were mediated by a reduction in AT1R expression and oxidative stress in the pancreas and appear to be independent of any change in local pancreatic blood flow. Together, these data suggest that preservation of pancreatic ACE2 expression and activity is critical for the maintenance of glycemic control to oppose the development of T2DM.
Previously, we reported the beneficial effects of ACE2 gene therapy in improving glycemia and pancreatic β-cell function in 8-wk-old db/db mice, a genetic model for T2DM. These mice develop diabetes due to the absence of leptin receptors, which causes hyperphagia, obesity, hyperglycemia, hyperinsulinemia, and ultimately β-cell dysfunction. In the present study, we aimed to study the compensatory role of ACE2 in an overactive RAS model independently of any genetic defect or obesity. Ang II-infused rodent models have been utilized previously to study the effects of RAS overactivity on glycemia (25, 27, 35). Mitsuishi et al. (27) reported impaired glucose tolerance and hyperinsulinemia following a 7-day infusion in mice. In our study, we extended the Ang II infusion to 14 days to determine the therapeutic potential of pancreas-targeted ACE2 gene therapy beyond the 7th day of infusion. Our data are consistent with previous findings (25, 27, 35) describing Ang II-mediated impairment of glucose tolerance and increased FBG levels. We extended these observations by showing that Ang II increases the expression of components thought to be detrimental to pancreatic and especially β-cell function, i.e., AT1R and the NAD(P)H oxidase main catalytic subunit gp91phox, while at the same time reducing potential compensatory elements like ACE2. The importance of AT1R and ACE2 in the regulation of glycemia has been demonstrated previously by our group (3) and others (11, 25, 28, 35, 40).
It is intriguing that, despite its presence in the pancreas and its opposition to Ang II effects, endogenous ACE2 is unable to prevent Ang II-mediated β-cell dysfunction and the development of T2DM. The reason for ineffectiveness of ACE2 in combating Ang II-mediated hyperglycemia, as observed in this report, is that Ang II exerts an inhibitory effect on ACE2 expression in the pancreas, and so there is not enough ACE2 left in the tissue to exert its beneficial effects against elevated Ang II. We observed that Ang II infusion led not only to hyperglycemia and hyperinsulinemia but also to a reduction in ACE2 expression and activity in the pancreas and the islets of Langerhans. Although this observation is consistent with previous studies indicating the downregulation of ACE2 protein in different tissues during the progression of various diseases (3, 31, 39, 45), it is important to note that the time frame in this study is different from that in the referred studies that examined ACE2 expression. Indeed, an increase in ACE2 expression and/or activity is usually taking place in the early development (3, 4, 40) of the disease, supposedly as a compensatory mechanism. However, as the pathology progresses, ACE2 expression and/or activity are reduced, illustrating the failure of this compensation (30, 44). The decrease in ACE2 expression in the islets of Langerhans and reduced pancreatic ACE2 activity following Ang II infusion provided a rationale to study the impact of ACE2 gene therapy in this T2DM-like model. Intrapancreatic treatment with an adenovirus encoding the human ACE2 protein successfully rescued ACE2 expression and activity. In addition, Ad-hACE2 treatment attenuated hyperglycemia, hyperinsulinemia, and C-peptide levels in Ang II-infused mice. The GSIS data suggested that the impairment of GSIS was also corrected in the islets isolated from Ad-hACE2-treated, Ang II-infused mice (Fig. 4A), implying the beneficial role of ACE2 in abating detrimental effects of Ang II on β-cell function. The main mechanism mediating the therapeutic effects of ACE2 expression is likely the conversion of Ang II by ACE2 to form Ang-(1–7). Previously, we showed the contribution of Ang-(1–7) in the reversal of T2DM in db/db mice (3), and the same mechanism is probably taking place in the present model, although the present study focused only on counteracting Ang II effects. It is important to note that plasma Ang II levels were not affected by pancreas-targeted ACE2 gene therapy. Therefore, a reduction of Ang II levels, if any, would have taken place only locally in the pancreas and eventually in the islets. The ACE2-mediated reduction of AT1R expression may be a result of this local reduction of Ang II levels in the islets. Altogether, our data suggest that pancreatic ACE2 improves glucose regulation by modulating RAS in the islets of Ang II-infused mice.
We observed an improvement in insulin sensitivity in Ad-hACE2-treated mice (Fig. 4, D and E) compared with Ad-eGFP-injected mice. This could be mediated by Ang-(1–7) since infusion of the heptapeptide has been found to improve insulin sensitivity in fructose-fed rats (17). Transgenic rats with chronic elevation of plasma Ang-(1–7) levels have also been shown to exhibit enhanced insulin sensitivity (34). Although we did not see a reduction of plasma Ang II in Ad-hACE2-injected mice, we cannot exclude the possibility of inadvertent expression of hACE2 outside of the pancreas, which might have affected the whole body insulin sensitivity. Therefore, both improved β-cell function, as the GSIS data indicate, and increased insulin sensitivity could have contributed toward the beneficial role of pancreatic ACE2 in regulating glycemia.
Beyond the improvement of glucose control by ACE2 gene therapy, our goal was to identify the main mechanisms involved in the beneficial effects of ACE2 treatment. One of the mechanisms by which ACE2 improved glycemia could have been increased blood flow to the pancreas by virtue of its vasodilatory action on blood vessels (30, 42). The RAS has been shown to regulate blood flow to the pancreas, which in turn affects insulin secretion (6, 7, 19, 38), and we observed that Ang II-infused mice showed a marked reduction in blood flow to the pancreas compared with controls (Table 1); however, to our surprise, there was no change in blood flow between GFP-injected and ACE2-treated, Ang II-infused mice. Thus, we conclude that blood flow is not part of the mechanisms by which ACE2 improves glycemia in this Ang II infusion model. It is possible that the dose of Ad-hACE2 used in this study was insufficient to affect the pancreatic blood vessels. Diminished AT1R expression in β-cells might be another mechanism whereby ACE2 therapy improves glucose regulation. Indeed, Mitsuishi et al. (27) reported improved glucose tolerance and reduced fasting hyperinsulinemia in mice treated with an AT1R blocker, and Tikellis et al. (40) showed reduced expression of AT1R, associated with improved β-cell morphology, in the islets of fa/fa Zucker diabetic fatty rats treated with RAS blockers. In our study, AT1R expression was reduced in the islets and whole pancreas, which may have contributed to the beneficial effects of the ACE2 treatment. We observed that AT1R expression was localized mainly in the nucleus in the islets of the pancreata isolated from Ang II-infused mice. The presence of AT1R in the nuclear membrane of INS-1E β-cells has been reported previously (21). Although additional experiments confirming the expression of AT1R in nuclear fractions are needed, our study may provide the first evidence of the presence of nuclear AT1R in the mouse islets. Thus, this study sets the stage for investigation of the physiological role, especially in glucose homeostasis, of nuclear AT1R in the β-cells in vivo. On the basis of several studies (20, 26, 32) that implicate increased oxidative stress in mediating β-cell dysfunction, we also explored the reduction of oxidative stress as a mechanism contributing toward restoring normal glycemia in mice. Indeed, ACE2 treatment reduced the oxidative stress in the pancreas and contributed to improving β-cell function. Similar ACE2-mediated reduction of oxidative stress has also been observed in endothelial cells (46) and in the brain by our group (44). Furthermore, both ACE2 overexpression and the antioxidant tempol prevented Ang II-mediated defects on GSIS in isolated islets (Figs. 4G and 6D).
In summary, we show that increased plasma Ang II levels and their consequences, such as upregulation of AT1R in β-cells and increased pancreatic oxidative stress together with downregulation of ACE2 expression and decreased ACE2 activity, lead to impaired glycemic control and β-cell dysfunction in mice. ACE2 gene therapy, which rescues ACE2 protein expression and activity in the pancreas and attenuates pancreatic oxidative stress, mitigates Ang II-mediated deleterious effects on glycemia in mice and improves β-cell function. It is important to note that these changes occurred in response to normalization of ACE2 protein and activity in the pancreas in Ang II-infused mice and not overexpression to nonphysiological levels. These findings suggest a significant contribution of the RAS in the pancreas and the islets of Langerhans in the regulation of glycemia and provide evidence for the therapeutic potential of ACE2 in combating Ang II-mediated hyperglycemia by counteracting an overactive RAS in the islets. Therefore, therapeutic approaches aimed at restoring endogenous ACE2 activity could be a promising new avenue for the treatment of diabetes.
GRANTS
This work was supported by research grants from the American Heart Association (11PRE6320006) to K. H. Chhabra and the National Center for Research Resources (5-P20-RR-018766-10), the National Institute of General Medical Sciences (8-P20-GM-103514-10), and the National Institute of Diabetes and Digestive and Kidney Diseases (DK-084466) to E. Lazartigues.
DISCLOSURES
The authors declare no potential conflicts of interest, financial or otherwise, pertaining to this article.
AUTHOR CONTRIBUTIONS
K.H.C. and E.L. contributed to the conception and design of the research; K.H.C., H.X., K.B.P., and R.C.S. performed the experiments; K.H.C., H.X., K.B.P., R.C.S., and E.L. analyzed the data; K.H.C., H.X., K.B.P., R.C.S., and E.L. interpreted the results of the experiments; K.H.C., R.C.S., and E.L. prepared the figures; K.H.C. and E.L. drafted the manuscript; K.H.C., H.X., K.B.P., R.C.S., and E.L. edited and revised the manuscript; K.H.C., H.X., K.B.P., R.C.S., and E.L. approved the final version of the manuscript.
ACKNOWLEDGMENTS
We thank Drs. Annie Whitaker, Charles Nichols, Amarjit S. Naura, and Penelope H. Strenge for their assistance with Ang II measurements, confocal microscopy, immunohistochemistry, and tissue sectioning, respectively. We also acknowledge Dr. Sharell M. Bindom, University of Texas at Dallas, for guidance on designing the experiments, and Dr. Kathryn Sandberg, Georgetown University Medical Center, and Md. Rezaul Karim, Nova Southeastern University, for their assistance with the radioligand-binding assay.
REFERENCES
- 1. Alenina N, Xu P, Rentzsch B, Patkin EL, Bader M. Genetically altered animal models for Mas and angiotensin-(1–7). Exp Physiol 93: 528–537, 2008 [DOI] [PubMed] [Google Scholar]
- 2. Benicky J, Hafko R, Sanchez-Lemus E, Aguilera G, Saavedra J. Six commercially available angiotensin II AT1 receptor antibodies are non-specific. Cell Mol Neurobiol 32: 1353–1365, 2012 [DOI] [PMC free article] [PubMed] [Google Scholar]
- 3. Bindom SM, Hans CP, Xia H, Boulares AH, Lazartigues E. Angiotensin I-converting enzyme type 2 (ACE2) gene therapy improves glycemic control in diabetic mice. Diabetes 59: 2540–2548, 2010 [DOI] [PMC free article] [PubMed] [Google Scholar]
- 4. Bindom SM, Lazartigues E. The sweeter side of ACE2: physiological evidence for a role in diabetes. Mol Cell Endocrinol 302: 193–202, 2009 [DOI] [PMC free article] [PubMed] [Google Scholar]
- 5. Butz GM, Davisson RL. Long-term telemetric measurement of cardiovascular parameters in awake mice: a physiological genomics tool. Physiol Genomics 5: 89–97, 2001 [DOI] [PubMed] [Google Scholar]
- 6. Carlsson PO, Andersson A, Jansson L. Pancreatic islet blood flow in normal and obese-hyperglycemic (ob/ob) mice. Am J Physiol Endocrinol Metab 271: E990–E995, 1996 [DOI] [PubMed] [Google Scholar]
- 7. Carlsson PO, Berne C, Jansson L. Angiotensin II and the endocrine pancreas: effects on islet blood flow and insulin secretion in rats. Diabetologia 41: 127–133, 1998 [DOI] [PubMed] [Google Scholar]
- 8. Cha DR, Zhang X, Zhang Y, Wu J, Su D, Han JY, Fang X, Yu B, Breyer MD, Guan Y. Peroxisome proliferator activated receptor alpha/gamma dual agonist tesaglitazar attenuates diabetic nephropathy in db/db mice. Diabetes 56: 2036–2045, 2007 [DOI] [PubMed] [Google Scholar]
- 9. Chappell M, Millsted A, Diz D, Brosnihan K, Ferrario CM. Evidence for an intrinsic angiotensin system in the canine pancreas. J hypertens 9: 751–759, 1991 [DOI] [PubMed] [Google Scholar]
- 10. Chhabra K, Pedersen KB, Lazartigues E. Renin-angiotensin system and diabetes. In: Beta Cells: Functions, Pathology and Research, edited by Gallagher SE. Hauppauge, NY: NOVA Publishers, 2011, p. 151–163 [Google Scholar]
- 11. Chu KY, Lau T, Carlsson PO, Leung PS. Angiotensin II type 1 receptor blockade improves beta-cell function and glucose tolerance in a mouse model of type 2 diabetes. Diabetes 55: 367–374, 2006 [DOI] [PubMed] [Google Scholar]
- 12. Donoghue M, Hsieh F, Baronas E, Godbout K, Gosselin M, Stagliano N, Donovan M, Woolf B, Robison K, Jeyaseelan R, Breitbart RE, Acton S. A novel angiotensin-converting enzyme-related carboxypeptidase (ACE2) converts angiotensin I to angiotensin 1–9. Circ Res 87: E1–E9, 2000 [DOI] [PubMed] [Google Scholar]
- 13. Feng Y, Xia H, Cai Y, Halabi CM, Becker LK, Santos RA, Speth RC, Sigmund CD, Lazartigues E. Brain-selective overexpression of human Angiotensin-converting enzyme type 2 attenuates neurogenic hypertension. Circ Res 106: 373–382, 2010 [DOI] [PMC free article] [PubMed] [Google Scholar]
- 14. Feng Y, Yue X, Xia H, Bindom SM, Hickman PJ, Filipeanu CM, Wu G, Lazartigues E. Angiotensin-converting enzyme 2 overexpression in the subfornical organ prevents the angiotensin II-mediated pressor and drinking responses and is associated with angiotensin II type 1 receptor downregulation. Circ Res 102: 729–736, 2008 [DOI] [PMC free article] [PubMed] [Google Scholar]
- 15. Folli F, Kahn CR, Hansen H, Bouchie JL, Feener EP. Angiotensin II inhibits insulin signaling in aortic smooth muscle cells at multiple levels. A potential role for serine phosphorylation in insulin/angiotensin II crosstalk. J Clin Invest 100: 2158–2169, 1997 [DOI] [PMC free article] [PubMed] [Google Scholar]
- 16. Folli F, Saad MJ, Velloso L, Hansen H, Caradente O, Feener E, Kahn CR. Crosstalk between insulin and angiotensin II signalling systems. Exp Clin Endocrinol Diabetes 107: 133–139, 1999 [DOI] [PubMed] [Google Scholar]
- 17. Giani JF, Mayer MA, Muñoz MC, Silberman EA, Höcht C, Taira CA, Gironacci MM, Turyn D, Dominici FP. Chronic infusion of angiotensin-(1–7) improves insulin resistance and hypertension induced by a high-fructose diet in rats. Am J Physiol Endocrinol Metab 296: E262–E271, 2009 [DOI] [PubMed] [Google Scholar]
- 18. Henriksen EJ. Improvement of insulin sensitivity by antagonism of the renin-angiotensin system. Am J Physiol Regul Integr Comp Physiol 293: R974–R980, 2007 [DOI] [PubMed] [Google Scholar]
- 19. Huang Z, Jansson L, Sjöholm A. Vasoactive drugs enhance pancreatic islet blood flow, augment insulin secretion and improve glucose tolerance in female rats. Clin Sci (Lond) 112: 69–76, 2007 [DOI] [PubMed] [Google Scholar]
- 20. Ikeda N, Inoguchi T, Sonoda N, Fujii M, Takei R, Hirata E, Yokomizo H, Zheng J, Maeda Y, Kobayashi K, Takayanagi R. Biliverdin protects against the deterioration of glucose tolerance in db/db mice. Diabetologia 54: 2183–2191, 2011 [DOI] [PubMed] [Google Scholar]
- 21. Leung KK, Leung PS. Effects of hyperglycemia on the angiotensin II receptor type 1 expression and insulin secretion in an INS-1E pancreatic beta-cell line. JOP 9: 290–299, 2008 [PubMed] [Google Scholar]
- 22. Leung PS, Chan HC, Fu LX, Wong PY. Localization of angiotensin II receptor subtypes AT1 and AT2 in the pancreas of rodents. J Endocrinol 153: 269–274, 1997 [DOI] [PubMed] [Google Scholar]
- 23. Leung PS, Chan HC, Wong PY. Immunohistochemical localization of angiotensin II in the mouse pancreas. Histochem J 30: 21–25, 1998 [DOI] [PubMed] [Google Scholar]
- 24. Leung PS, Chan WP, Wong TP, Sernia C. Expression and localization of the renin-angiotensin system in the rat pancreas. J Endocrinol 160: 13–19, 1999 [DOI] [PubMed] [Google Scholar]
- 25. Machado LJ, Marubayashi U, Reis AM, Coimbra CC. The hyperglycemia induced by angiotensin II in rats is mediated by AT1 receptors. Braz J Med Biol Res 31: 1349–1352, 1998 [DOI] [PubMed] [Google Scholar]
- 26. Meigs JB, Larson MG, Fox CS, Keaney JF, Jr, Vasan RS, Benjamin EJ. Association of oxidative stress, insulin resistance, and diabetes risk phenotypes: the Framingham Offspring Study. Diabetes Care 30: 2529–2535, 2007 [DOI] [PubMed] [Google Scholar]
- 27. Mitsuishi M, Miyashita K, Muraki A, Itoh H. Angiotensin II reduces mitochondrial content in skeletal muscle and affects glycemic control. Diabetes 58: 710–717, 2009 [DOI] [PMC free article] [PubMed] [Google Scholar]
- 28. Niu MJ, Yang JK, Lin SS, Ji XJ, Guo LM. Loss of angiotensin-converting enzyme 2 leads to impaired glucose homeostasis in mice. Endocrine 34: 56–61, 2008 [DOI] [PubMed] [Google Scholar]
- 29. Pedersen KB, Sriramula S, Chhabra KH, Xia H, Lazartigues E. Species-specific inhibitor sensitivity of angiotensin-converting enzyme 2 (ACE2) and its implication for ACE2 activity assays. Am J Physiol Regul Integr Comp Physiol 301: R1293–R1299, 2011 [DOI] [PMC free article] [PubMed] [Google Scholar]
- 30. Raizada MK, Ferreira AJ. ACE2: a new target for cardiovascular disease therapeutics. J Cardiovasc Pharmacol 50: 112–119, 2007 [DOI] [PubMed] [Google Scholar]
- 31. Reich HN, Oudit GY, Penninger JM, Scholey JW, Herzenberg AM. Decreased glomerular and tubular expression of ACE2 in patients with type 2 diabetes and kidney disease. Kidney Int 74: 1610–1616, 2008 [DOI] [PubMed] [Google Scholar]
- 32. Robertson RP. Chronic oxidative stress as a central mechanism for glucose toxicity in pancreatic islet beta cells in diabetes. J Biol Chem 279: 42351–42354, 2004 [DOI] [PubMed] [Google Scholar]
- 33. Saiki A, Ohira M, Endo K, Koide N, Oyama T, Murano T, Watanabe H, Miyashita Y, Shirai K. Circulating angiotensin II is associated with body fat accumulation and insulin resistance in obese subjects with type 2 diabetes mellitus. Metabolism 58: 708–713, 2009 [DOI] [PubMed] [Google Scholar]
- 34. Santos SH, Braga JF, Mario EG, Pôrto LC, Rodrigues-Machado Mda G, Murari A, Botion LM, Alenina N, Bader M, Santos RA. Improved lipid and glucose metabolism in transgenic rats with increased circulating angiotensin-(1–7). Arterioscler Thromb Vasc Biol 30: 953–961, 2010 [DOI] [PubMed] [Google Scholar]
- 35. Shiuchi T, Iwai M, Li HS, Wu L, Min LJ, Li JM, Okumura M, Cui TX, Horiuchi M. Angiotensin II type-1 receptor blocker valsartan enhances insulin sensitivity in skeletal muscles of diabetic mice. Hypertension 43: 1003–1010, 2004 [DOI] [PubMed] [Google Scholar]
- 36. Speth RC. Sarcosine1, glycine8 angiotensin II is an AT1 angiotensin II receptor subtype selective antagonist. Regul Pept 115: 203–209, 2003 [DOI] [PubMed] [Google Scholar]
- 37. Sriramula S, Cardinale JP, Lazartigues E, Francis J. ACE2 overexpression in the paraventricular nucleus attenuates angiotensin II-induced hypertension. Cardiovasc Res 92: 401–408, 2011 [DOI] [PMC free article] [PubMed] [Google Scholar]
- 38. Tahmasebi M, Puddefoot JR, Inwang ER, Vinson GP. The tissue renin-angiotensin system in human pancreas. J Endocrinol 161: 317–322, 1999 [DOI] [PubMed] [Google Scholar]
- 39. Tikellis C, Johnston CI, Forbes JM, Burns WC, Burrell LM, Risvanis J, Cooper ME. Characterization of renal angiotensin-converting enzyme 2 in diabetic nephropathy. Hypertension 41: 392–397, 2003 [DOI] [PubMed] [Google Scholar]
- 40. Tikellis C, Wookey PJ, Candido R, Andrikopoulos S, Thomas MC, Cooper ME. Improved islet morphology after blockade of the renin- angiotensin system in the ZDF rat. Diabetes 53: 989–997, 2004 [DOI] [PubMed] [Google Scholar]
- 41. Tocci G, Paneni F, Palano F, Sciarretta S, Ferrucci A, Kurtz T, Mancia G, Volpe M. Angiotensin-converting enzyme inhibitors, angiotensin II receptor blockers and diabetes: a meta-analysis of placebo-controlled clinical trials. Am J Hypertens 24: 582–590, 2011 [DOI] [PubMed] [Google Scholar]
- 42. Treml B, Neu N, Kleinsasser A, Gritsch C, Finsterwalder T, Geiger R, Schuster M, Janzek E, Loibner H, Penninger J, Loeckinger A. Recombinant angiotensin-converting enzyme 2 improves pulmonary blood flow and oxygenation in lipopolysaccharide-induced lung injury in piglets. Crit Care Med 38: 596–601, 2010 [DOI] [PubMed] [Google Scholar]
- 43. Xia H, Feng Y, Obr TD, Hickman PJ, Lazartigues E. Angiotensin II type 1 receptor-mediated reduction of angiotensin-converting enzyme 2 activity in the brain impairs baroreflex function in hypertensive mice. Hypertension 53: 210–216, 2009 [DOI] [PMC free article] [PubMed] [Google Scholar]
- 44. Xia H, Suda S, Bindom S, Feng Y, Gurley SB, Seth D, Navar LG, Lazartigues E. ACE2-mediated reduction of oxidative stress in the central nervous system is associated with improvement of autonomic function. PLoS One 6: e22682, 2011 [DOI] [PMC free article] [PubMed] [Google Scholar]
- 45. Ye M, Wysocki J, William J, Soler MJ, Cokic I, Batlle D. Glomerular localization and expression of Angiotensin-converting enzyme 2 and Angiotensin-converting enzyme: implications for albuminuria in diabetes. J Am Soc Nephrol 17: 3067–3075, 2006 [DOI] [PubMed] [Google Scholar]
- 46. Zhong JC, Yu XY, Lin QX, Li XH, Huang XZ, Xiao DZ, Lin SG. Enhanced angiotensin converting enzyme 2 regulates the insulin/Akt signalling pathway by blockade of macrophage migration inhibitory factor expression. Br J Pharmacol 153: 66–74, 2008 [DOI] [PMC free article] [PubMed] [Google Scholar]
- 47. Zhou L, Zhang R, Yao W, Wang J, Qian A, Qiao M, Zhang Y, Yuan Y. Decreased expression of angiotensin-converting enzyme 2 in pancreatic ductal adenocarcinoma is associated with tumor progression. Tohoku J Exp Med 217: 123–131, 2009 [DOI] [PubMed] [Google Scholar]
- 48. Zmuda EJ, Powell CA, Hai T. A method for murine islet isolation and subcapsular kidney transplantation. J Vis Exp: 2096, 2011 [DOI] [PMC free article] [PubMed] [Google Scholar]