

Abstract
Tumor necrosis factor-alpha (TNF-α) has been implicated in salt-sensitive hypertension and renal injury (RI) induced by angiotensin II (ANG II). To determine the receptor type of TNF-α involved in this mechanism, we evaluated the responses to chronic ANG II infusion (25 ng/min by implanted minipump) given with high-salt diet (HS; 4% NaCl) for 2 wk in gene knockout mice for TNF-α receptor type 1 (TNFR1KO; n = 6) and type 2 (TNFR2KO; n = 6) and compared the responses with those in wild-type (WT; C57BL/6; n = 6) mice. Blood pressure in these mice was measured by implanted radiotelemetry as well as by tail-cuff plethysmography. RI responses were assessed by measuring macrophage cell infiltration (CD68+ immunohistochemistry), glomerulosclerosis (PAS staining), and interstitial fibrosis (Gomori's trichrome staining) in renal tissues at the end of the treatment period. The increase in mean arterial pressure induced by ANG II + HS treatment was not different in these three groups of mice (TNFR1KO, 114 ± 1 to 161 ± 7 mmHg; TNFR2KO, 113 ± 1 to 161 ± 3 mmHg; WT, 110 ± 3 to 154 ± 3 mmHg). ANG II + HS-induced RI changes were similar in TNFR1KO mice but significantly less in TNFR2KO mice (macrophage infiltration, 0.02 ± 0.01 vs. 1.65 ± 0.45 cells/mm2; glomerulosclerosis, 26.3 ± 2.6 vs. 35.7 ± 2.2% area; and interstitial fibrosis, 5.2 ± 0.6 vs. 8.1 ± 1.1% area) compared with the RI changes in WT mice. The results suggest that a direct activation of TNF-α receptors may not be required in inducing hypertensive response to chronic ANG II administration with HS intake, but the induction of inflammatory responses leading to renal injury are mainly mediated by TNF-α receptor type 2.
Keywords: TNF-α receptors, renal injury, glomerular sclerosis, interstitial collagen deposition, macrophage cell infiltration
tumor necrosis factor (TNF-α) is a potent pro-inflammatory cytokine that plays important roles in chronic inflammation and autoimmune diseases. It is produced by leukocytes, monocytes, and macrophages, as well as by endothelial cells. In the kidney, mesangial and tubular epithelial cells produce TNF-α upon inflammation and tissue injury (2, 20). Angiotensin II (ANG II) infusion in vivo in rats increases TNF-α production in the kidney (38). Chronic ANG II infusion failed to cause hypertensive responses in mice deficient in the gene for either TNF-α (42) or one of its major sources of endogenous production, T-lymphocytes (17). Treatment with a TNF-α blocker (etanercept) significantly reduced the proteinuria as well as renal macrophage infiltration in chronic ANG II-treated rats that were given a high-salt diet (12). It was also demonstrated that the treatment with either immunosuppressive drugs or a TNF-α blocker reduced albuminuria and renal fibrosis in a double transgenic rat model (dTGR; harboring both human renin and angiotensinogen genes) of ANG II-induced renal damage (32). Collectively, these studies implicate an involvement of TNF-α in the pathophysiology of ANG II-dependent hypertension and the development of renal injury.
However, contrary to these findings, a direct involvement of TNF-α in causing hypertensive response was also questioned in many previous studies. It had been demonstrated that an administration of TNF-α by osmotic minipump failed to cause an increase in blood pressure in nonpregnant rats, although it caused a mild increase in blood pressure in pregnant rats (24). TNF-α blockade also failed to reduce blood pressure in some animal models of hypertension, namely DOCA-salt-treated rats (11) as well as dTGR hypertensive rats (32). Systemic infusion of TNF-α in anesthetized mice also resulted in decreases in blood pressure (40). Moreover, it has also been reported that intravenous administration of TNF-α antiserum increases arterial pressure in rats made hypertensive by chronic infusion of ANG II, suggesting that TNF-α also participates in a counterregulatory mechanism that opposes the pressor effects of ANG II (14). This discrepancy in the effect of TNF-α on inducing blood pressure changes in varying conditions could be related to differential activation of TNF-α receptor subtypes in various conditions (4, 7, 13).
There are two kinds of receptors for TNF-α, a 55-kDa receptor type 1(TNFR1) and a 75-kDa receptor type 2 (TNFR2), containing similar extracellular domains but distinct intracellular sequences, which mediate different functions of TNF-α (4). In the kidney, both TNFR1 and TNFR2 are expressed in the proximal tubules, collecting ducts and endothelial cells of the renal vasculature, whereas only TNFR1 is present in the smooth muscle cells of the renal vasculature (5). Although we have demonstrated earlier that the acute renal hemodynamic and functional responses to TNF-α are related to activation of TNFR1 (5), the exact role of TNFR2, particularly in the chronic condition, is not yet clearly defined. Although both receptors contribute to the expression of cytokines and subsequent inflammation, TNFR1 knockout mice (TNFR1KO) have been shown to have less inflammatory cell accumulation, indicating that this receptor is the more potent modulator of inflammation (41). In contrast, TNFR2 knockout mice (TNFR2KO) exhibit a dramatic decrease in tissue necrosis and increased resistance to TNF-α-induced cell death (13). We have reported earlier (5) that a deficiency in TNFR1 leads to upregulation of TNFR2 in the renal tissues and vice versa, which indicates a potential interaction of these receptors in regulating TNF-α-induced responses in the kidney. Available literature supports the fact that TNF-α is concentrated at cell surfaces by binding to TNFR2, which subsequently dissociates and passes on the ligand to TNFR1 or forms hetero-complexes with TNFR1 (34). However, the engagement of TNFR2 by TNF-α also leads to TNFR1-independent cellular events, including apoptosis of activated T cells (27, 50). Therefore, in this study, we have used the receptor-specific knockout mice for TNF-α (TNFR1KO and TNFR2KO) to examine the hypothesis that TNFR1 mediates the adverse effects, whereas TNFR2 plays the protective role in hypertension and renal injury responses to chronic administration of ANG II.
METHODS
The experiments were performed in accordance with the guidelines and practices established by the Tulane University Animal Care and Use Committee. Male mice in which the TNF-α receptors TNFR1 (B6.129-Tnfrsf1atm1Mak/J; stock no. 002818) and TNFR2 (B6.129S2-Tnfrsf1btm1Mwm/J; stock no. 002620) had been genetically knocked out and their background wild-type (WT; C57BL/6; stock no. 000664) mice were used in these experiments (Jackson Laboratories, Bar Harbor, ME). These knockout mice (TNFR1KO and TNFR2KO) as well as WT mice were housed in a temperature- and light-controlled room and allowed free access to standard diet (Ralston-Purina, St. Louis, MO) and tap water. The mice (8–9 wk of age; ∼25 g body wt) were randomly divided into two different sets, one set for the telemetry experiment comprising six animals from each genotype group and another similar set for the metabolic cage experiment. The mice were kept in the facility for ∼10 days before the start of each experimental protocol.
Blood Pressure Monitoring in Conscious Mice
After 10 days of acclimatization, radio transmitters (TA11PA-C10, DSI) were implanted in mice assigned for the telemetry experiment to monitor the arterial blood pressure continuously. Mice were anesthetized using 2% iso-flurane. A midline skin incision 2 cm long from chin to manubrium was performed to isolate the common carotid artery (6, 23). A blunt trocar was passed from the neck incision to the abdominal region through the lateral aspect under the skin. The implant catheter was placed into the common carotid artery. The transmitter body was placed under the skin in the abdominal region. The skin was sutured, and topical antiseptic was applied. Mice were placed on a 12:12-h light-dark cycle and received food and water ad libitum throughout the study (6). After 8–10 days of recovery, we began monitoring systemic blood pressure and heart rate continuously using the telemetry data acquisition system (DSI, St. Paul, MN).
For the groups of mice that were used for the metabolic cage experiment, blood pressure was measured using a tail-cuff plethysmograph (Visitech Systems, Napa Place, NC). Mice were trained for tail-cuff blood pressure measurements 1 wk before starting the experiments. In these groups of mice, blood pressure measurements were performed at the same time of the day (11 AM to 1 PM) to avoid the influence of the circadian cycle, and the value of systolic blood pressure was obtained by estimating the average reading of 10 measurements for a single trial.
Chronic ANG II Administration by Osmotic Minipumps
Chronic infusion of ANG II at a rate of 25 ng/min for a 2-wk period was given to all the mice (both telemetry as well as metabolic cage experimental groups) using osmotic mini-pumps (Alzet, model 1002D; Durect, Cupertino, CA). During ANG II infusion, the mice were given a HS diet [4% NaCl; Harlan-Teklad, Madison, WI] and allowed to drink freely from the water bottles attached to the cages. HS diet was given to amplify the ANG II-induced injury in the renal tissues (49). For implantation of the osmotic mini-pump, mice were anesthetized for a short term using 2% iso-flurane. The mini-pump containing ANG II dissolved in 0.9% saline was implanted subcutaneously under the scapula through an incision in the midscapular region under sterile condition. The antibiotic tetracycline (500 mg/l) was given in the drinking water 24 h before the surgery and continued for the 2-wk duration of the experimental period (47). In the mice from telemeter-implanted groups, blood pressure measurement was continuously recorded throughout the experimental period. In the mice from the metabolic cage experiment, blood pressure was measured 1 day before the start of minipump implantation (0 day, considered as baseline) and then on days 3, 6, 9, and 12 of the 2-wk experimental period.
Urine Collection in Conscious Mice
Twenty-four-hour urine samples were collected from conscious mice using metabolic cages on the day before the start of the treatment to establish basal excretory parameters and then on days 3, 6, 9, and 12 of the experiment. Animals were housed individually in metabolic cages, and urine was collected for 24 h into sterile tubes. Urine volumes were determined from each urine collection, and samples were centrifuged (3,000 rpm/5 min; 4°C) and preserved for analysis. Food and water intake, along with body weight, of each mouse was measured during the experimental period. Urinary concentrations of sodium and potassium were assessed by flame photometry. At day 15, all the animals were euthanised; the kidneys were collected and kept in formalin for evaluation of renal injury.
Evaluation of Renal Injury
The formalin-fixed paraffin-embedded kidney sections were used for analyzing CD68-positive macrophage cell infiltration using immunohistochemistry (22, 25), glomerulosclerosis using Periodic-acid-Schiff (PAS) staining (21, 22, 45), and interstitial fibrosis using Gomori's trichrome staining (15, 29).
Estimation of macrophage infiltration.
The number of monocytes/macrophages was examined by immuno-histochemistry using a commercially available antibody against CD68 (clone EBM-11; Dako, Milan, Italy). Immuno-histochemistry was performed by a robotic system (Dako automato-stainer) as described previously (22, 25). Briefly, mouse anti-human CD68 monoclonal antibody was added to the formalin-fixed paraffin-embedded renal section used at a dilution of 1:150 in blocking solution (ImmPRESS Reagent Anti mouse Ig; Vector Laboratories, Burlingame, CA) overnight at 4°C, followed by peroxidase-coupled anti-mouse IgG (ImmPRESS Reagent; Vector Laboratories) for 1 h at room temperature and counterstained with hematoxylin and eosin (VWR International, West Chester, PA). Twenty consecutive microscopic fields were examined for each mouse, and CD68-positive cells (stained dark brown) were counted in each microscopic field by using the Nikon NIS-Elements software (version 2.34). The averaged numbers of macrophages/monocytes per square millimeter area were then obtained for each mouse.
Estimation of glomerulosclerosis.
The extent of glomerulosclerosis was evaluated quantitatively by an automatic image analysis of each glomerulus using PAS-stained renal sections (Mass Histology Service, Worcester, MA) as previously described (21, 22, 45). Briefly, formalin-fixed paraffin-embedded renal sections were stained in PAS reagent. Slides were photographed using a Nikon Eclipse 50i microscope equipped with a Nikon DS Camera Head (DS Fi1) and DS camera control unit (DSU2). Twenty images from each kidney slide were taken with at least one glomerulus per field. A dark purple color in the glomerulus was recognized as sclerosis. Percentage area covered by sclerosis in glomeruli in each field was analyzed using the Nikon NIS-Elements software (version 2.34). The percentage data obtained for each of the 20 images was averaged to obtain the percentage area of sclerosis for the entire slide.
Estimation of interstitial fibrosis.
The extent of interstitial collagen-positive area (fibrosis) was evaluated quantitatively by an automatic image analysis of renal section occupied by interstitial tissue staining positively for collagen in Gomori's trichrome-stained sections as described previously (15, 29). Briefly, formalin-fixed paraffin-embedded renal sections were stained with a plasmin stain (chromotrope 2R) and a connective tissue fiber stain (aniline blue) combined in a solution of phosphotungstic acid to which glacial acetic acid had been added. This stained the collagen blue, which indicates fibrosis. Slides were photographed as described above. Percentage area covered by collagen in each field was analyzed using the Nikon NIS-Elements software (version 2.34). The percentage data obtained for each of the 20 images were averaged to obtain the percentage area of fibrosis for the entire slide.
Statistical Analysis
All results are expressed as means ± SE. Statistical analysis were performed using Sigmastat software (Systat Software, Chicago, IL). Comparison of the responses within the same group as well as between the groups was conducted by the use of the repeated-measures ANOVA and Dunnett multiple comparisons test. P ≤ 0.05 is considered as significant.
RESULTS
Blood Pressure Responses to ANG II + HS Treatment in TNFR1KO and TNFR2KO Mice
The basal level of mean arterial pressure (MAP) was the same in all three groups of mice from the telemetry experiment, as shown in Fig. 1, which illustrates the changes in MAP with diurnal variation (MAP low in day time and high in night time in these nocturnal animals). Chronic ANG II treatment in these HS-fed mice during the 2-wk experimental period caused similar increases in MAP. The mean changes in MAP at the end of the 2-wk period were as follows: WT, 110 ± 3 to 154 ± 3 mmHg; TNFR1KO, 114 ± 1 to 161 ± 7 mmHg; TNFR2KO, 113 ± 1 to 161 ± 3 mmHg. As recorded, no significant differences were observed in systolic blood pressure (WT, 126 ± 3 to 177 ± 3 mmHg; TNFR1KO, 131 ± 2 to 186 ± 5 mmHg; TNFR2KO, 126 ± 1 to 182 ± 3 mmHg) and heart rate (WT, 581 ± 1 to 558 ± 4 beats/min; TNFR1KO, 590 ± 3 to 579 ± 5 beats/min; TNFR2KO, 588 ± 2 to 570 ± 6 beats/min) responses among the different groups of mice from the telemetry experiment. Measurement of blood pressure in the mice by tail-cuff plethysmography (from the metabolic cage experiment) also indicates that there were no significant differences in systolic blood pressure among the groups during the experimental period. The mean changes in systolic blood pressure at the end of the 2-wk period were as follows: WT, 120 ± 7 to 160 ± 13 mmHg; TNFR1KO, 115 ± 7 to 173 ± 5 mmHg; TNFR2KO, 120 ± 6 to 168 ± 9 mmHg. These values were not significantly different from the day time systolic blood pressure values in the group of mice recorded by telemetry.
Fig. 1.

Changes in mean arterial blood pressure (MAP) with diurnal variation (MAP low at day time, high at night time) during chronic administration of angiotensin II (ANG II) at a rate of 25 ng/min for a 2-wk period in wild-type (WT; n = 6) and knockout mice for TNF-α receptor 1 (TNFR1KO; n = 6) and receptor 2 (TNFR2KO; n = 6) fed with a high-salt (HS) diet. There was no statistical difference in MAP responses among the groups. Values are means ± SE.
Renal Excretory Responses to ANG II + HS Treatment in TNFR1KO and TNFR2KO Mice
Twenty-four-hour urine samples collected from mice showed that chronic ANG II treatment increased daily water intake (Fig. 2A), urine output (Fig. 2B), and sodium (Fig. 3A) and potassium (Fig. 3B) excretion significantly in all groups of mice fed with HS diet. However, there were no significant differences in these responses among the groups. The mean calculated volume retention (differences between water intake and urine output) values by each group on day 12 of the treatment period (TNFR1KO, 4.89 ± 0.86 ml/24 h; TNFR2KO, 3.50 ± 1.01 ml/24 h; WT, 3.84 ± 1.05 ml/24 h) were also not significantly different among the groups. There were also no significant differences in food intake as well as in body weight of these mice among the different groups (data not included).
Fig. 2.

The effect of chronic administration of ANG II at a rate of 25 ng/min and HS intake for a 2-wk period in WT (n = 6), TNFR1KO (n = 6), and TNFR2KO (n = 6) mice on daily water intake (A) and urine output (B). No significant differences in the responses were observed among the groups during ANG II + HS treatment. Values are means ± SE.
Fig. 3.

The daily urinary sodium (A) and potassium (B) excretion in response to chronic administration of ANG II at a rate of 25 ng/min for a 2-wk period in WT (n = 6), TNFR1KO (n = 6), and TNFR2KO (n = 6) mice fed a HS diet. No significant differences in these responses were observed among the groups during ANG II + HS treatment. Values are means ± SE.
Renal Macrophage Infiltration Responses to ANG II + HS Treatment in TNFR1KO and TNFR2KO Mice
The monocyte/macrophage infiltration in the kidney was evaluated by quantification of CD68-positive cell numbers in the renal section. CD68 is a surface marker for monocytes/macrophages. The CD68-positive monocytes/macrophages were widely distributed throughout the renal tissue section (Fig. 4, A–C). Figure 4D illustrates the count of infiltrating macrophage cells in renal tissue. Renal tissue macrophage cell infiltration was significantly less (P < 0.05) in TNFR2KO (0.02 ± 0.01 cells/mm2 area) but not in TNFR1KO mice (1.19 ± 0.14 cells/mm2 area) compared with the values in WT mice (1.65 ± 0.45 cells/mm2 area) due to administration of ANG II and HS intake for 2 wk. This indicates that TNFR2 is involved in mediating the infiltration of monocytes/macrophages in the kidney during chronic ANG II administration.
Fig. 4.
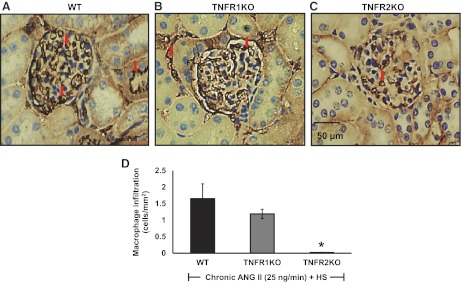
A–C: representative photomicrographs of CD68 immunostaining in the kidney sections (macrophage infiltration) of HS-fed WT (n = 6), TNFR1KO (n = 6), and TNFR2KO (n = 6) mice treated with chronic ANG II infusion at a rate of 25 ng/min for a 2-wk period at ×40 magnification of objective lens (examples of some dark brown-stained cells are indicated by arrow). D: mean values of the number of infiltrating CD68-positive macrophage cells in renal cell sections. Values are means ± SE. *P < 0.05 vs. WT.
Glomerular Sclerosis Responses to ANG II + HS Treatment in TNFR1KO and TNFR2KO Mice
The extent of glomerular sclerosis was evaluated by automatic image analysis of glomeruli in PAS-stained sections (Fig. 5, A–C). As shown in Fig. 5D, percent area of glomerulosclerosis was similar in TNFR1KO but significantly less (P < 0.05) in TNFR2KO mice than the values in WT mice treated with chronic ANG II (35.7 ± 2.2% area in WT, 31.6 ± 2.5% area in TNFR1 KO, and 26.3 ± 2.6% area in TNFR2 KO). These results demonstrate that TNFR2 is mainly involved in the development of glomerular sclerosis during ANG II-induced renal injury.
Fig. 5.

A–C: representative photomicrographs of PAS-stained kidney sections (indicating glomerulosclerosis) of WT (n = 6), TNFR1KO (n = 6), and TNFR2KO (n = 6) mice fed with HS diet in response to chronic ANG II treatment at a rate of 25 ng/min for a 2-wk period at ×40 magnification of objective lens (examples of some dark purple stained sclerotic areas inside glomerulus are indicated by arrow). D: mean values of glomerulosclerosis by semiquantitative morphometric evaluation. Values are means ± SE. *P < 0.05 vs. WT.
Renal Interstitial Collagen Deposition in Response to ANG II + HS Treatment in TNFR1KO and TNFR2KO Mice
Collagen deposition was marked by blue staining in kidney sections prepared using Gomori's trichrome method. The extent of renal interstitial fibrosis (deposition of collagen fibers) was quantitated by image analysis of blue staining in each microscopic field in the renal cortex. Collagen fibers are normally present at low levels in the renal interstitium (Fig. 6, A–D). Analysis using a computer-aided semi-automatic quantification system demonstrated that, after 14 days of chronic ANG II administration and HS intake, the percent area of fibrosis (collagen deposition), was similar in the renal interstitium in WT and TNFR1KO mice. Interstitial fibrosis was significantly lowered (P < 0.05) in TNFR2KO (5.18 ± 0.64% area) but not in TNFR1KO (7.08 ± 2.02% area) mice compared with the values in WT mice (8.07 ± 1.08% area). This further indicates that activation of TNFR2 is involved in chronic ANG II-induced interstitial collagen deposition (fibrosis) in the kidney.
Fig. 6.

A–C: representative photomicrographs of Gomori's trichrome-stained kidney sections (indicating interstitial fibrosis) of HS-fed WT (n = 6), TNFR1KO (n = 6), and TNFR2KO (n = 6) mice in response to chronic ANG II treatment at a rate of 25 ng/min for a 2-wk period at ×20 magnification of objective lens (examples of some light blue stained fibrotic areas between tubules are indicated by arrow). D: mean values of interstitial collagen deposition or fibrosis by semiquantitative morphometric evaluation. Values are means ± SE. *P < 0.05 vs WT.
DISCUSSION
In this present investigation, it has been demonstrated that the hypertensive response to chronic administration of ANG II given with HS diet for a 2-wk period was similar in both TNFR1KO and TNFR2KO mice, and this increase in blood pressure was identical to the hypertensive response observed in WT. However, the renal injury responses induced by ANG II administration and HS intake were significantly attenuated in TNFR2KO but not in TNFR1KO mice, indicating that an activation of TNFR2 was mainly involved in this inflammatory mechanism. Such attenuation of renal injury without any significant change in the hypertensive response in TNFR2KO mice demonstrates that the renal damage induced by chronic ANG II treatment and HS intake can occur independent of hemodynamic changes. It has been shown previously that ANG II promotes inflammatory response and causes end-organ damage largely independent of blood pressure (30) and that TNF-α is not involved in the ANG II-mediated hemodynamic changes (32). Our study also supports previous findings by others (32) for the role of immunocompetent cells in causing renal injury independent of blood pressure changes in a non-immune ANG II-induced disease model. It should be noted here that the mice from all three different genotypes showed higher levels of water intake (a reflection of the dipsogenic response associated with ANG II) (18) and urine output after ANG II treatment and HS intake for a 2-wk period compared with their basal values. This also suggests that all these mice exhibit a heightened sensitivity to ANG II infusion when fed a HS diet irrespective of presence or absence of the receptors for TNF-α. Moreover, the basal MAP in conscious TNFR1KO and TNFR2KO in the present study were not significantly different than that in WT mice, suggesting that these mice do not exhibit any different phenotype, which is consistent with other reports (7, 13, 37). However, the reductions in renal macrophage infiltration, glomerular sclerosis, and renal interstitial fibrosis only in TNFR2KO but not in TNFR1KO mice suggest that TNF-α mainly modulates renal inflammatory responses to ANG II via activation of TNFR2.
The reason for relative lack of TNFR1-mediated renal inflammatory and cytotoxic effects in ANG II-treated mice in the present experiments is not clear yet. Since most of the cytotoxic effects of TNF-α have been attributed to TNFR1 (1, 8, 48), it seems an unexpected finding that TNFR2, but not TNFR1, is linked to renal tissue injury in response to ANG II treatment. Although we did not examine this in the present study, it has been shown earlier by another laboratory (7) that chronic ANG II administration in mice caused marked increases in TNFR2 mRNA in renal cortical and medullary tissues, whereas TNFR1 mRNA decreased in the medulla with no changes in the cortical tissue. TNF-α is a highly pleiotropic cytokine that plays a role in the immune inflammatory response. Intracellular signaling through TNF-α receptors may lead to apoptosis, cell activation, and/or cell proliferation. Substantial evidence indicates the involvement of TNFR1 signaling in a number of pathological states (8, 48), whereas the role of TNFR2 in organ pathology is not widely established. However, elevated TNFR2 expression and/or serum levels of soluble TNFR2 have also been reported in a number of inflammatory conditions, including inflammatory bowel diseases (31), sepsis (39), acute respiratory distress syndrome (28), and cerebral malaria (28), possibly reflecting a need for high levels of TNFR2 expression to mediate biological actions. Although most pro-inflammatory effects of TNF-α are associated with activation of TNFR1 (1), TNFR2 has also been linked to vascular inflammation (28), apoptosis, and necrosis in cisplatin-induced acute renal failure (35), and glomerulonephritis (46), as well as having an allelic association with essential hypertension in humans (3, 10). TNFR2 also participates in acceleration of the early phase of collagen-induced arthritis (43). Coherent with the above findings, we also found that TNFR2 is involved in both sclerosis and fibrosis of renal tissue induced by ANG II, either directly or indirectly. The number of inflammatory cells (CD68-positive macrophage cells) in the renal tissue in different groups of mice closely correlates with the severity of glomerular and interstitial lesions, supporting the idea that inflammatory mechanisms play an important role in the pathogenesis of chronic renal injury (38). Therefore, our results indicate that increased infiltration of immune cells leading to renal injury in chronic ANG II treatment is mediated by TNF-α acting via TNFR2. This current finding that TNFR2 mediates chronic renal injury participates in the growing list of disorders in which TNFR2 has been shown to play an important role. For example, TNFR2 is upregulated in intestinal inflammation, and TNFR2-deficient mice develop less severe intestinal inflammation (31).
The findings in the present study demonstrate that the hypertensive response induced by ANG II is not primarily dependent on activation of either type (type 1 or type 2) of TNF-α receptors. These results seem unexpected as the deletion of the gene for TNF-α protein (42) or one of its sources, T-cells (17), in mice and also treatment with etanercept (TNF-α blocker) in rats (12) or mice (17) reportedly attenuates the hypertensive response to chronic ANG II. It has been shown previously that TNF-α is required for the complete expression of ANG II-induced salt appetite and hypertension (42). These previous studies (12, 17, 42) mostly suggested an involvement of TNF-α activity in the signaling mechanism mediating the hypertensive responses to chronic administration of ANG II within the 2-wk period. Although ANG II treatment did not alter the hypertensive responses in the present study, the inflammatory response was markedly attenuated in TNFR2KO mice compared with wild-type mice within the 2-wk treatment period. Thus it is conceivable that a 2-wk protocol period is sufficient to expose the concomitant role of TNF-α activation during administration of ANG II.
It could also be argued that a considerably higher dose of ANG II used in the present study might have masked any role for the TNF-α receptors' deletion on the hypertensive response to ANG II. However, it should be noted that the exact same dose of ANG II (1 μg·kg−1·min−1) was used in a previous study evaluating ANG II-induced hypertensive responses in TNF-α knockout mice (42), which were also given a drink with high salt containing solution (1.8% sodium chloride). In that study (42), the hypertensive response to ANG II and HS intake was markedly attenuated in TNF-α knockout mice, whereas such a hypertensive response to similar ANG II dose and HS intake remained intact in TNF-α receptor knockout mice in the present study. Moreover, a marked attenuation of ANG II-induced hypertension was also noted in interleukin-6 knockout mice (26), which were given a much larger (more than three times higher) dose of ANG II (90 ng/min) than that used in the present study. An earlier study (7) using a higher dose of ANG II (1.6 μg·kg−1·min−1) for only 7 days of infusion showed that the deletion of TNF-α receptor type 1 was associated with an exacerbated response in systolic blood pressure but not in the diastolic pressure, indicating that such a possibility of masking the response at high dose of ANG II seems unlikely. Thus it is conceivable that the dose variation is not the reason for lack of attenuation in the hypertensive response to ANG II in receptor deleted mice in the present study.
An activation of nuclear factor-κB (NF-κB) is one of the important components in the signal transduction mechanism in the development of hypertension induced by many factors, including ANG II (9, 16, 19, 33, 36). Thus the attenuation of the chronic ANG II-induced hypertensive response in mice with deficiency in TNF-α (42, 17) could be linked to absence of NF-κB activation by this cytokine. However, the contrasting finding in the present study, that the hypertensive response induced by chronic ANG II remained intact in TNFR1KO or in TNFR2KO mice, indicates that such activation of NF-kB can occur in the absence of either one of the TNF-α receptors. Although the binding of TNF-α to both the type 1 and type 2 receptors initiates different intracellular signaling events, it was also reported that both TNFR1 and TNFR2 can independently cause activation of NF-κB (44).
In conclusion, the results of the present study demonstrated that the hypertensive response to chronic ANG II administration and HS intake is not primarily dependent on activation of either type (type 1 or type 2) of TNF-α receptors. These findings also demonstrated that the renal inflammatory changes leading to renal injury induced by chronic ANG II administration and HS intake are mainly mediated by TNF-α receptor type 2.
GRANTS
This study was supported by grants from the National Heart, Lung, and Blood Institute (no. 66432). This study was presented in abstract form at the American Federation for Medical Research 2012 Southern Regional Meeting (J Invest Med 60: 114–115, abstract no. 417), and at EB 2012 (FASEB J 26: 868.20).
DISCLOSURES
No conflicts of interest, financial or otherwise, are declared by the author(s).
AUTHOR CONTRIBUTIONS
Author contributions: P.S. and D.S.A.M. conception and design of research; P.S., L.B., and A.C. performed experiments; P.S., L.B., A.C., and D.S.A.M. analyzed data; P.S. and D.S.A.M. interpreted results of experiments; P.S., L.B., A.C., and D.S.A.M. prepared figures; P.S. drafted manuscript; P.S., L.B., A.C., and D.S.A.M. approved final version of manuscript; L.B., A.C., and D.S.A.M. edited and revised manuscript.
REFERENCES
- 1.Barbara JA, Smith WB, Gamble JR, Van Ostade X, Vandenabeele P, Tavernier J, Fiers W, Vadas MA, Lopez AF. Dissociation of TNF-alpha cytotoxic and proinflammatory activities by p55 receptor- and p75 receptor- selective TNF-alpha mutants. EMBO J 13: 843–850, 1994 [DOI] [PMC free article] [PubMed] [Google Scholar]
- 2.Baud L, Oudinet JP, Bens M, Noe L, Peraldi MN, Rondeau E, Etienne J, Ardaillou R. Production of tumor necrosis factor by rat mesangial cells in response to bacterial lipopolysaccharide. Kidney Int 35: 1111–1118, 1989 [DOI] [PubMed] [Google Scholar]
- 3.Benjafield AV, Wang XL, Morris BJ. Tumor necrosis factor receptor 2 gene (TNFRSF1B) in genetic basis of coronary artery disease. J Mol Med 79: 109–115, 2001 [DOI] [PubMed] [Google Scholar]
- 4.Botchkina GI, Meistrell ME, 3rd, Botchkina IL, Tracey KJ. Expression of TNF and TNF receptors (p55 and p75) in the rat brain after focal cerebral ischemia. Mol Med 3: 765–781, 1997 [PMC free article] [PubMed] [Google Scholar]
- 5.Castillo A, Islam MT, Prieto MC, Majid DS. Tumor necrosis fact-alpha receptor type 1, not the type 2, mediates its acute responses in the kidney. Am J Physiol Renal Physiol 302: F1650–F1657, 2012 [DOI] [PMC free article] [PubMed] [Google Scholar]
- 6.Cervenka L, Vaneckova I, Huskova Z, Vanourkova Z, Erbanova M, Thumova M, Skaroupkova P, Opocensky M, Maly J, Chábova VC, Tesar V, Bürgelova M, Viklický O, Teplan V, Zelízko M, Kramer HJ, Navar LG. Pivotal role of angiotensin II receptor subtype 1A in the development of two-kidney, one-clip hypertension: study in angiotensin II receptor subtype 1A knockout mice. J Hypertens 26: 1379–1389, 2008 [DOI] [PMC free article] [PubMed] [Google Scholar]
- 7.Chen CCA, Pedraza PL, Hao S, Stier CT, Ferreri NR. TNFR1 deficient mice display altered blood pressure and renal responses to ANG II infusion. Am J Physiol Renal Physiol 299: F1141–F1150, 2010 [DOI] [PMC free article] [PubMed] [Google Scholar]
- 8.Deng GM, Liu L, Kyttaris VC, Tsokos GC. Lupus serum IgG induces skin inflammation through the TNFR1 signaling pathway. J Immunol 184: 7154–7161, 2010 [DOI] [PMC free article] [PubMed] [Google Scholar]
- 9.Ding W, Yang L, Zhang M, Gu Y. Chronic inhibition of nuclear factor kappa B attenuates aldosterone/salt-induced renal injury. Life Sci 90: 600–606, 2012 [DOI] [PubMed] [Google Scholar]
- 10.Eguchi T, Maruyama T, Ohno Y, Morii T, Hirao K, Hirose H, Kawabe H, Saito I, Hayashi M, Saruta T. Possible association of tumor necrosis factor receptor 2 gene polymorphism with severe hypertension using the extreme discordant phenotype design. Hypertens Res 32: 775–779, 2009 [DOI] [PubMed] [Google Scholar]
- 11.Elmarakby AA, Quigley JE, Imig JD, Pollock JS, Pollock DM. TNF-alpha inhibition reduces renal injury in DOCA-salt hypertensive rats. Am J Physiol Regul Integr Comp Physiol 294: R76–R83, 2008 [DOI] [PMC free article] [PubMed] [Google Scholar]
- 12.Elmarakby AA, Quigley JE, Pollock DM, Imig JD. Tumor necrosis factor alpha blockade increases renal Cyp2c23 expression and slows the progression of renal damage in salt-sensitive hypertension. J Hypertens 47: 557–562, 2006 [DOI] [PubMed] [Google Scholar]
- 13.Erickson S, de Sauvage F, Kikly K, Carver-Moore K, Pitts-Meek S, Gillett N, Sheehan K, Schreiber R, Goeddel D, Moore M. Decreased sensitivity to tumor necrosis factor but normal T-cell development in TNF receptor-2-deficient mice. Nature 372: 560–563, 1994 [DOI] [PubMed] [Google Scholar]
- 14.Ferreri NR, Zhao Y, Takizawa H, McGiff JC. Tumor necrosis factor-α-angiotensin interactions and regulation of blood pressure. J Hypertens 15: 1481–1484, 1997 [DOI] [PubMed] [Google Scholar]
- 15.Gomori G. A rapid one-step trichrome stain. Am J Clin Pathol 20: 661–664, 1950 [DOI] [PubMed] [Google Scholar]
- 16.Gu JW, Tian N, Shparago M, Tan W, Bailey AP, Davis R. Renal NF-κB activation and TNF-α upregulation correlate with salt-sensitive hypertension in Dahl salt-sensitive rats. Am J Physiol Regul Integr Comp Physiol 291: R1817–R1824, 2006 [DOI] [PubMed] [Google Scholar]
- 17.Guzik TJ, Hoch NE, Brown KA, McCann LA, Rahman A, Dikalov S, Goronzy J, Weyand C, Harrison DG. Role of the T cell in the genesis of angiotensin II-induced hypertension and vascular dysfunction. J Exp Med 204: 2449–2460, 2007 [DOI] [PMC free article] [PubMed] [Google Scholar]
- 18.Hogarty DC, Speakman EA, Puig V, Phillips MI. The role of angiotensin, AT1 and AT2 receptors in the pressor, drinking and vasopressin responses to central angiotensin. Brain Res 586: 289–294, 1992 [DOI] [PubMed] [Google Scholar]
- 19.Hong HJ, Wu CC, Yen MH. Prrolidine dithiocarbamate improves the septic shock syndromes in spontaneously hypertensive rats. Clin Exp Pharmacol Physiol 25: 600–606, 1998 [DOI] [PubMed] [Google Scholar]
- 20.Jevnikar AM, Brennan DC, Singer GG, Heng JE, Maslinski W, Wuthrich RP, Glimcher LH, Kelley VER. Stimulated kidney tubular epithelial cells express membrane associated and secreted TNF-α. Kidney Int 40: 203–211, 1991 [DOI] [PubMed] [Google Scholar]
- 21.Kanda T, Wakino S, Hayashi K, Homma K, Ozawa Y, Saruta T. Effect of fasudil on Rho-kinase and nephropathy in subtotally nephrectomized spontaneously hypertensive rats. Kidney Int 64: 2009–2019, 2003 [DOI] [PubMed] [Google Scholar]
- 22.Kobori H, Ozawa Y, Suzaki Y, Nishiyama A. Enhanced intrarenal angiotensinogen contributes to early renal injury in spontaneously hypertensive rats. J Am Soc Nephrol 16: 2073–2080, 2005 [DOI] [PMC free article] [PubMed] [Google Scholar]
- 23.Kopkan L, Hess A, Husková Z, Cervenka L, Navar LG, Majid DS. High-salt intake enhances superoxide activity in eNOS knockout mice leading to the development of salt sensitivity. Am J Physiol Renal Physiol 299: F656–F663, 2010 [DOI] [PMC free article] [PubMed] [Google Scholar]
- 24.LaMarca BBD, Cockrell K, Sullivan E, Bennett W, Granger JP. Role of endothelin in mediating tumor necrosis factor-induced hypertension in pregnant rats. Hypertension 46: 82–86, 2005 [DOI] [PubMed] [Google Scholar]
- 25.Lara LS, McCormack M, Semprum-Prieto LC, Shenouda S, Majid DS, Kobori H, Navar LG, Prieto MC. At1 receptor-mediated augmentation of angiotensinogen, oxidative stress, and inflammation in Ang II-salt hypertension. Am J Physiol Renal Physiol 302: F85–F94, 2012 [DOI] [PMC free article] [PubMed] [Google Scholar]
- 26.Lee D, Sturgis L, Labazi H, Osborne J, Fleming C, Pollock J, Manhiani M, Imig J, Brands M. Angiotensin II hypertension is attenuated in interleukin-6 knockout mice. Am J Physiol Heart Circ Physiol 290: H935–H940, 2006 [DOI] [PubMed] [Google Scholar]
- 27.Lin RH, Hwang YW, Yang BC, Lin CS. TNF receptor-2-triggered apoptosis is associated with the down-regulation of Bcl-xL on activated T cells and can be prevented by CD28 costiumlation. J Immunol 158: 598–603, 1997 [PubMed] [Google Scholar]
- 28.Lucas R, Lou J, Morel DR, Ricou B, Suter PM, Grau GE. TNF receptors in the microvascular pathology of acute respiratory distress syndrome and cerebral malaria. J Leukoc Biol 61: 551–558, 1997 [DOI] [PubMed] [Google Scholar]
- 29.Luna LG. Histopathological Methods and Color Atlas of Special Stains and Tissue Artifacts (1st ed.). Gaithersburg, MD: American Histolabs, 1992 [Google Scholar]
- 30.Mervaala E, Müller DN, Schmidt F, Park JK, Gross V, Bader M, Breu V, Ganten D, Haller H, Luft FC. Blood pressure-independent effects in rats with human renin and angiotensinogen genes. Hypertension 35: 587–594, 2000 [DOI] [PubMed] [Google Scholar]
- 31.Mizoguchi E, Mizoguchi A, Takedatsu H, Cario E, Jong Y, Ooi C, Xavier R, Terhorst C, Podolsky D, Bhan A. Role of tumor necrosis factor receptor 2 (TNFR2) in colonic epithelial hyperplasia and chronic intestinal inflammation in mice. Gastroenterology 122: 134–144, 2002 [DOI] [PubMed] [Google Scholar]
- 32.Muller DN, Shagdarsuren E, Park JK, Dechend R, Mervaala E, Hampich F, Fiebeler A, Ju X, Finckenberg P, Theuer J, Viedt C, Kreuzer J, Heidecke H, Haller H, Zenke M, Luft FC. Immunosuppressive treatment protects against angiotensin II-induced renal damage. Am J Pathol 161: 1679–1693, 2002 [DOI] [PMC free article] [PubMed] [Google Scholar]
- 33.Muller DN, Dechend R, Mervaala EM, Park JK, Schmidt F, Fiebeler A, Theuer J, Breu V, Ganten D, Haller H, Luft FC. NF-kappaB inhibition ameliorates angiotensin II-induced inflammatory damage in rats. J Hypertens 35: 193–201, 2000 [DOI] [PubMed] [Google Scholar]
- 34.Pinckard JK, Sheehan KC, Schreiber RD. Ligand-induced formation of the p55 and p75 tumor necrosis factor receptor heterocomplexes on intact cells. J Biol Chem 272: 10784–10789, 1997 [DOI] [PubMed] [Google Scholar]
- 35.Ramesh G, Reeves WB. TNFR2-mediated apoptosis and necrosis in cisplatin-induced acute renal failure. Am J Physiol Renal Physiol 285: F610–F618, 2003 [DOI] [PubMed] [Google Scholar]
- 36.Rodriguez-Iturbe B, Ferrebuz A, Vanegas V, Quiroz Y, Mezzano S, Vaziri ND. Early and sustained inhibition of nuclear factor-kappa B prevents hypertension in spontaneously hypertensive rats. J Pharmacol Exp Ther 315: 51–57, 2005 [DOI] [PubMed] [Google Scholar]
- 37.Rothe J, Lesslauer W, Lotscher H, Lang Y, Koebel P, Kontgen F, Althage A, Zinkernagel R, Steinmetz M, Bluethmann H. Mice lacking the tumour necrosis factor receptor 1 are resistant to TNF-mediated toxicity but highly susceptible to infection by Listeria monocytogenes. Nature 364: 798–802, 1993 [DOI] [PubMed] [Google Scholar]
- 38.Ruiz-Ortega M, Ruperez M, Lorenzo O, Esteban V, Blanco J, Mezzano S, Egido J. Angiotensin II regulates the synthesis of proinflammatory cytokines and chemokines in the kidney. Kidney Int 62: S12–S22, 2002 [DOI] [PubMed] [Google Scholar]
- 39.Schroder J, Stuber F, Gallati H, Schade FU, Kremer B. Pattern of soluble TNF receptors I and II in sepsis. Infection 23: 143–148, 1995 [DOI] [PubMed] [Google Scholar]
- 40.Shahid M, Francis J, Majid DSA. Tumor necrosis factor-α induces renal vasoconstriction as well as natriuresis in mice. Am J Physiol Renal Physiol 295: F1836–F1844, 2008 [DOI] [PMC free article] [PubMed] [Google Scholar]
- 41.Simeonova PP, Gallucci RM, Hulderman T, Wilson R, Kommineni C, Rao M, Luster MI. The role of tumor necrosis factor-alpha in liver toxicity, inflammation, and fibrosis induced by carbon tetrachloride. Toxicol Appl Pharmacol 177: 112–120, 2001 [DOI] [PubMed] [Google Scholar]
- 42.Sriramula S, Haque M, Majid DS, Francis J. Involvement of tumor necrosis factor-alpha in angiotensin II-mediated effects on salt appetite, hypertension, and cardiac hypertrophy. Hypertension 5: 1345–1351, 2008 [DOI] [PMC free article] [PubMed] [Google Scholar]
- 43.Tada Y, Ho A, Koarada S, Morito F, Ushiyama O, Suzuki N, Kikuchi Y, Ohta A, Mak T, Nagasawa K. Collagen-induced arthritis in TNF receptor-1-deficient mice: TNF receptor-2 can modulate arthritis in the absence of TNF receptor-1. Clin Immunol 99: 325–333, 2001 [DOI] [PubMed] [Google Scholar]
- 44.Thommesen L, Lægreid A. Distinct differences between TNF receptor 1- and TNF receptor 2-mediated activation of NF-κB. J Biochem Mol Biol 38: 281–289, 2005 [DOI] [PubMed] [Google Scholar]
- 45.Totty Mucins BA. In. Theory and practice of histological techniques, edited by Bancroft JD, Gamble M. Livingstone, UK: Elsevier, 2008 [Google Scholar]
- 46.Vielhauer V, Stavrakis G, Mayadas TN. Renal cell-expressed TNF receptor 2, not receptor 1, is essential for the development of glomerulonephritis. J Clin Invest 115: 1199–1209, 2005 [DOI] [PMC free article] [PubMed] [Google Scholar]
- 47.Wang HD, Xu S, Johns DG, Du Y, Quinn MT, Cayatte AJ, Cohen RA. Role of NADPH oxidase in the vascular hypertrophic and oxidative stress response to angiotensin II in mice. Circ Res 88: 947–953, 2001 [DOI] [PubMed] [Google Scholar]
- 48.White LE, Santora RJ, Cui Y, Moore FA, Hassoun HT. TNFR1-dependent pulmonary apoptosis during ischemic acute kidney injury. Am J Physiol Lung Cell Mol Physiol 303: L449–L459, 2012 [DOI] [PMC free article] [PubMed] [Google Scholar]
- 49.Zhao X, Pollock DM, Zeldin DC, Imig JD. Salt-sensitive hypertension after exposure to angiotensin is associated with inability to upregulate renal epoxygenases. Hypertension 42: 775–780, 2003 [DOI] [PubMed] [Google Scholar]
- 50.Zheng LX, Fisher G, Miller RE, Peschon J, Lynch DH, Lenardo MJ. Induction of apoptosis in mature T cells by tumour necrosis factor. Nature 377: 348–351, 1995 [DOI] [PubMed] [Google Scholar]