Abstract
The α2-isoform of the Na,K-ATPase (α2) is the minor isoform of the Na,K-ATPase expressed in the cardiovascular system and is thought to play a critical role in the regulation of cardiovascular hemodynamics. However, the organ system/cell type expressing α2 that is required for this regulation has not been fully defined. The present study uses a heart-specific knockout of α2 to further define the tissue-specific role of α2 in the regulation of cardiovascular hemodynamics. To accomplish this, we developed a mouse model using the Cre/loxP system to generate a tissue-specific knockout of α2 in the heart using β-myosin heavy chain Cre. We have achieved a 90% knockout of α2 expression in the heart of the knockout mice. Interestingly, the heart-specific knockout mice exhibit normal basal cardiac function and systolic blood pressure, and in addition, these mice develop ACTH-induced hypertension in response to ACTH treatment similar to control mice. Surprisingly, the heart-specific knockout mice display delayed onset of cardiac dysfunction compared with control mice in response to pressure overload induced by transverse aortic constriction; however, the heart-specific knockout mice deteriorated to control levels by 9 wk post-transverse aortic constriction. These results suggest that heart expression of α2 does not play a role in the regulation of basal cardiovascular function or blood pressure; however, heart expression of α2 plays a role in the hypertrophic response to pressure overload. This study further emphasizes that the tissue localization of α2 determines its unique roles in the regulation of cardiovascular function.
Keywords: adrenocorticotropic hormone; transaortic constriction; blood pressure regulation; Na,K-ATPase signal transduction
there are four known isoforms of the catalytic α-subunit of the Na,K-ATPase (α1, α2, α3, and α4), with each isoform displaying a unique tissue distribution and expression pattern (15, 16, 30). In the mouse, the α2-isoform displays unique expression patterns in the brain, heart, skeletal muscle, and vascular smooth muscle, suggesting a tissue-specific role for the α2-isoform (30). The α2-isoform is the minor isoform of the Na,K-ATPase expressed in the vascular smooth muscle, with an α1-to-α2 protein expression ratio of ∼2.3 to 1 (29). In addition, the α2-isoform is also the minor functional isoform of the Na,K-ATPase expressed in cardiac myocytes, with current generated by α2 accounting for only ∼25% of total current generated by this enzyme (1, 11). Taken together, these reports demonstrate that the α2-isoform composes only ∼5% of the total Na,K-ATPase protein expression in the cardiovascular system.
Although the α2-isoform is expressed at low levels in the cardiovascular system, it is a critical regulator of cardiovascular function and blood pressure, as demonstrated in our previous studies using a global genetic knockout of one copy of α2 (α2+/−). In one study we observed hypercontractility in α2+/− mouse heart, along with altered Ca2+ levels (15). In addition, Zhang et al. (37) reported an elevation of systolic blood pressure (SBP) in α2+/− mice accompanied by an increase in myogenic tone in the vasculature. Furthermore, using a global genetic mouse model, we have previously shown that the cardiac glycoside binding site of the α2-isoform mediates ouabain and adrenocorticotropic hormone (ACTH)-induced hypertension (4–6, 8). To further evaluate the role of α2 in the cardiovascular system, we recently reported on a smooth muscle-specific knockout of α2 (SMα2−/−), in which the expression of α2 is reduced by ∼90% in both the vascular smooth muscle and cardiac myocytes (25). These SMα2−/− mice failed to develop ACTH-induced hypertension, indicating that the cardiovascular expression of α2 is required for the regulation of blood pressure in response to ACTH. In summary, it is generally accepted that α2 is vital for the regulation and maintenance of cardiovascular hemodynamics, including the regulation of blood pressure. However, the organ system expressing the α2 that is required for the regulation and maintenance of blood pressure has yet to be determined.
To further define the role of α2 in the organ systems/cell types involved in the regulation of blood pressure, we evaluated the role of the cardiac expression of α2. We hypothesized that α2 expression in the heart is a critical regulator of blood pressure. To test this hypothesis, a tissue-specific knockout of α2 in the heart was generated using the Cre/loxP system. The β-myosin heavy chain (β-MHC) Cre was used, which has been shown to drive efficient somatic recombination between loxP sites approaching 100% in the heart and skeletal muscle (20, 21).
MATERIALS AND METHODS
Animal model.
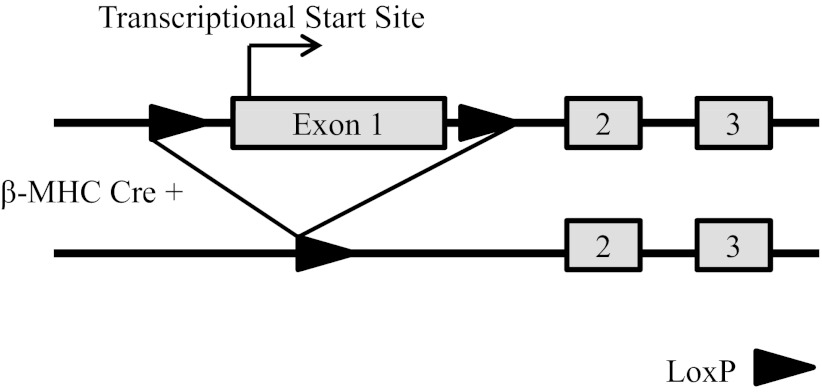
Homozygous α2-floxed (α2Flox/Flox) mice have been previously described (25), in which the first exon of the α2 locus (Atp1a2), containing the transcriptional start site, was flanked by loxP sites as depicted in Fig. 1. Homozygous α2Flox/Flox mice were mated to heterozygous β-MHC Cre mice [generous gift of Jeffery Molkentin (20, 21)] to generate a heart-specific knockout of α2 (α2Flox/Flox Cre+). Genotyping was determined through allele-specific PCR from tail biopsies, as previously described (25). All experiments were approved by the University of Cincinnati Institutional Animal Care and Use Committee.
Fig. 1.
Schematic representation of the α2 locus (Atp1a2) of the Na,K-ATPase. Top: partial structure of the floxed α2 allele in which exon 1 was flanked by loxP sites. Bottom: deleted α2 allele following the tissue-specific expression of the β-myosin heavy chain (β-MHC) Cre.
Whole tissue preparations.
Aorta (pooled), brain, and kidney were homogenized in radioimmunoprecipitation assay buffer, consisting of 150 mM NaCl, 10 mM Tris, 5 mM EDTA (pH 7.4), 0.1% SDS, 1% Na-deoxycholate, and 1% Triton-X, containing 1:100 protease and phosphatase inhibitor cocktails (Sigma-Aldrich, St. Louis, MO), as previously described for Western blot analysis (25). Protein containing supernatant was removed and stored at −80°C. Protein concentration was determined with the BCA protein assay kit (Thermo Fisher Scientific, Rockford, IL).
Microsomal preparations.
Cell membrane microsomal preparations were prepared from whole hearts as previously described for Western blot analysis (4, 25). Hearts were homogenized in homogenization buffer, consisting of (in mM) 250 sucrose, 30 imidazole, and 1 EDTA, containing 1:100 protease and phosphatase inhibitor cocktails (Sigma-Aldrich). To remove particulate matter, homogenates were then centrifuged at 5,000 rpm, and the supernatant was collected and ultracentrifuged at 200,000 g for 1 h. The pelleted microsomes were resuspended in resuspension buffer, consisting of (in mM) 1 imidazole, and 1 EDTA (pH 7.5), containing 1:100 protease and phosphatase inhibitor cocktails (Sigma-Aldrich), and protein concentration was determined with the BCA protein assay kit (Thermo Fisher Scientific).
Western blot analysis.
Western blot analysis were performed as previously described (4, 25). Protein samples were denatured at 37°C for 30 min in Laemmli loading buffer consisting of 125 mM Tris (pH 6.8), 6% SDS, 20% glycerol, 10% β-mercaptoethanol, and 0.1% bromophenal blue; separated by electrophoresis in 8% polyacrylamide gels; and transferred to polyvinylidene fluoride membranes. The membranes were blocked in blocking solution consisting of 5% nonfat dry milk in TBST, containing 150 mM Tris (pH 7.4), 100 mM NaCl, and 0.05% Tween-20 for 1 h at room temperature. The blots were incubated in primary antibodies overnight at 4°C in blocking solution as follows: α1-isoform monoclonal antibody, 1:2,000 [α6F (31), University of Iowa Developmental Studies Hybrid Bank, Iowa City, IA]; and affinity purified α2 polyclonal antibody, 1:1,000 [HERED, Pressley (23)]; Na/Ca exchanger (NCX) monoclonal antibody, 1:1,000 (MA3-926, Thermo Fisher Scientific). The primary antibodies were visualized with peroxidase-conjugated secondary antibodies (Calbiochem, San Diego, CA), following treatment with SuperSignal West Pico Chemiluminescent Substrate kit (Thermo Fisher Scientific), using HyBlot CL autoradiography film (Denville Scientific, Metuchen, NJ). Equal protein loading was confirmed by incubating the membranes in blocking solution containing primary antibodies for glyceraldehydes-3-phosphate dehydrogenase (GAPDH) polyclonal antibody 1:6,000 (14C10, Cell Signaling Technology, Beverly, MA) for whole tissue preparations or calsequestrin polyclonal antibody 1:2,000 (PA1-913, Thermo Fisher Scientific) for microsomal preparations. Signal intensities were quantitated by densitometry using ImageQuant software 5.1 (Molecular Dynamics, Sunnyvale, CA).
Blood pressure analysis.
Tail-cuff measurements of SBP were obtained using the CODA-8 System (Kent Scientific, Torrington, CT) computerized apparatus, as previously described (2, 25). Mice were acclimated to the system for 5 consecutive days, immediately followed by 7 days of baseline measurements and 3 days of drug treatment measurements when applicable. Daily blood pressure measurements consisted of five acclimation readings, followed immediately by 15 SBP measurements, with little time elapse between readings, and measurements were accepted when SBP was determined by the computer in at least 7 of the 15 measurements and was between 80 and 200 mmHg.
Cardiovascular performance.
Cardiovascular measurements were performed in closed-chest mice as previously described (4, 25). Adult mice (3 to 6 mo old) were anesthetized with an intraperitoneal injection of ketamine (50 μg/g body wt) and thiobutabarbital (Inactin, 100 μg/g body wt, Research Biochemical International, Natick, MA). A 1.4-F Scisense pressure catheter (Scisense, London, Ontario, Canada) was advanced into the left ventricle through the right carotid artery to monitor cardiac performance. In addition, the right femoral artery and vein were cannulated to monitor blood pressure and to allow for the infusion of drugs, respectively. Pressure tracings were recorded and analyzed using PowerLab 4/s and Chart software (ADInstruments, Colorado Springs, CO) with values for heart rate (HR), blood pressure, and left ventricular pressure being measured before and 3 min following the intravenous infusion of dobutamine (2, 8, and 32 ng·g body wt−1·min−1). The maximum rate of cardiac contraction (dP/dtmax) and the rate of cardiac contraction at 40 mmHg (dP/dt40) before and after infusion were calculated from the first derivative of the pressure waveforms.
Administration of ACTH.
Mice were administered 375 ng/g body wt Cortrosyn (Amphastar Pharmaceuticals, Rancho Cucamonga, CA), a synthetic peptide of ACTH or vehicle (saline), every 12 h by subcutaneous injection for 3 days, as previously described (25). SBP was obtained daily 3 h after administration of the a.m. dose, as described above. Following the final SBP recording, hearts were excised, dissected free from any connective tissue, and weighed. Hearts were then rapidly frozen in liquid N2 and stored at −80°C until crude microsomal preparations were performed as described above.
Transverse aortic constriction.
Pressure overload of the left ventricle was induced in mice by transverse aortic constriction (TAC) as previously described (27, 34). Mice (3 to 4 mo old) were anesthetized with 1.5 to 2.5% isoflurane and intubated. The transverse aortic segment was dissected through a midsternal incision, and a 7-0 silk suture was tied against a 27-gauge needle around the transverse aorta between the innominate and left carotid arteries to produce a stenosis of uniform diameter. Sham-operated mice underwent a similar procedure except that the suture was left untied. Perioperative mortality from the procedure was <10% in TAC and sham-operated mice. Terminal measurements were made at 3, 6, and 9 wk. Additionally, noninvasive tail-cuff measurements of SBP were obtained at 0, 3, 6, and 9 wk postsurgery as described above.
Echocardiography.
Echocardiography was performed on TAC (0, 3, 6, and 9 wk) and sham-operated (9 wk) mice following TAC surgical procedure as previously described (34). Mice were anesthetized with <2% isoflurane to effect, and two dimensional-guided M-mode echocardiography was performed using a Philips HDI/5000 SONOS CT machine equipped with 15- to 7-MHz broadband transducer (Philips Ultrasound, Bothell, WA). M-mode measurements were used to determine the left ventricular end-systolic and end-diastolic length (L) and area (A) from two consecutive cardiac cycles. The left ventricular end-systolic volume (ESV) and end-diastolic volume (EDV) were calculated using the equation (0.85·A2)/L. The stroke volume (SV) was calculated using the formula SV = EDV − ESV, and the percent ejection fraction (EF) was calculated using the formula EF = SV/EDV.
Transstenotic pressure gradient.
Transstenotic pressure gradients were performed in all mice that underwent TAC or sham operation at 9 wk by simultaneous pressure readings from the right carotid and femoral arteries as previously described (34). Mice were anesthetized with isoflurane, and the right carotid artery was cannulated with a Scisense pressure catheter for the measurement of upstream arterial blood pressure; in addition, the right femoral artery was cannulated to monitor downstream arterial blood pressure. Following the measurement of the pressure gradient, the Scisense pressure catheter was advanced into the left ventricle through the right carotid artery to monitor cardiac performance. At the conclusion of the experiments, hearts were excised, dissected free from any connective tissue, and weighed. Hearts were then either fixed in a 10% buffered formalin solution and paraffin embedded for further analysis as described, or ventricles were snap frozen in liquid nitrogen for mRNA and protein expression analysis as described.
Morphometric and histological analysis.
Following fixation, whole heart images were taken using a dissecting microscope. Because of cardiac hypertrophy in TAC hearts, separate images were obtained of both the atria and ventricles, and the two images were then merged to generate a composite image of the whole heart. Longitudinal sections of 5-μm thickness were obtained to assess myocyte cross-sectional area. To visualize the myocyte membranes, membranes were stained with wheat germ agglutinin (WGA) as previously described (21). Sections were deparaffinized and rehydrated into phosphate-buffered saline (PBS), and the sections were then permeablized with 0.2% Triton-X in PBS (Sigma-Aldrich). Sections were blocked with 5% BSA in PBS (Thermo Fisher Scientific), and for us to visualize the myocyte membranes, the sections were incubated with 1:10 dilution of tetramethyl rhodamine isothiocyanate-labeled WGA (1 mg/ml, Sigma-Aldrich) for 20 min. The sections were then washed with PBS and countered stained with 4′,6-diamidino-2-phenylindole dihydrochloride (DAPI, Invitrogen, Grand Island, NY) to visualize the nucleus. Coverslips were mounted on the sections using Fluoromount-G (Southern Biotech, Birmingham, AL). Images were acquired at ×40 magnification from 8 to 10 random fields within the left ventricular free wall from each heart. Myocyte diameter was determined from 6 to 10 myocytes per field (total of 48 to 100 myocytes per heart) using NIH ImageJ software.
Real-time PCR analysis.
Real-time PCR analysis was performed as previously described (24, 25). Briefly, total RNA was isolated from the ventricles using RNAzol RT (Molecular Research Center, Cincinnati, OH) according to the manufacturer's recommendations. SuperScript III first-strand synthesis system for RT-PCR (Invitrogen, Carlsbad, CA) was used to generate first-strand cDNA from 5 μg of total RNA according to the manufacturer's recommendations for use with random hexamer primers. Real-time PCR reactions were performed in triplicate using Absolute Blue QPCR SYBR Green fluorescein mix (Thermo Scientific, Florence, KY) with atrial natriuretic peptide (ANP)-specific primers (forward 5′-GCTTCCAGGCCATATTGGAG-3′, and reverse 5′-GGGGGCATGACCTCATCTT-3′), brain natriuretic peptide (BNP)-specific primers (forward 5′-GAGGTCACTCCTATCCTCTGG-3′, and reverse 5′-GCCATTTCCTCCGACTTTTCT-3′), β-MHC-specific primers (forward 5′-TTCATCCGAATCCATTTTGGGG-3′, and reverse 5′-GCATAATCGTAGGGGTTGTTGG-3′), c-fos-specific primers (forward 5′-CGGGTTTCAACGCCGACTA-3′, and 5′-TTGGCACTAGAGACGGACAGA-3′), c-jun-specific primers (forward 5′-CCTTCTACGACGATGCCCTC-3′, and 5′-GGTTCAAGGTCATGCTCTGTTT-3′), and GAPDH-specific primers (forward 5′-TGACCACAGTCCATGCCATC-3′, and reverse 5′-GACGGACACATTGGGGGTAG-3′). The relative amount of ANP, BNP, β-MHC, c-fos, and c-jun mRNA was normalized to GAPDH.
Statistical analysis.
Data are presented as means ± SE, with statistical analysis performed using SigmaStat 3.5 software (Systat Software, San José, CA). Student t-test and one-way or two-way ANOVA were performed, with differences considered significant at P < 0.05.
RESULTS
Expression of the α2-isoform of the Na,K-ATPase is reduced in the heart.
β-MHC Cre is highly expressed in the embryonic heart and has been shown to drive efficient somatic recombination between loxP sites approaching 100% (20, 21). Therefore, Western blot analyses were performed on the α2Flox/Flox Cre− (control) and α2Flox/Flox Cre+ (knockout) mice to examine the tissue-specific expression of α2. Representative immunoblots and relative protein expression levels for α1, α2, and the NCX are shown in Fig. 2. In heart microsomes, the abundance of α2 was significantly reduced by 90% in the knockout mice (P = 0.008; Fig. 2A). In addition, the expression profiles of α1 and NCX in heart microsomes were not significantly changed in knockout mice (Fig. 2A). Furthermore, there were no significant changes in the expression profiles of α1 and α2 in aorta (Fig. 2B) or brain (Fig. 2C) or in the expression profile of α1 in kidney (Fig. 2D). These results demonstrate that we have generated a significant knockout of α2 in the heart and that this knockout is specific for the heart within the cardiovascular system. Furthermore, the loss of the α2 in the heart did not alter the expression of α1 and NCX within the cardiovascular system.
Fig. 2.
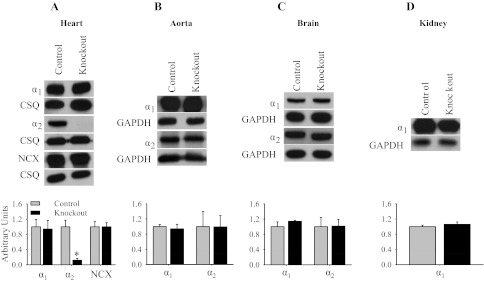
Basal expression profile of the α1- and α2-isoforms of the Na,K-ATPase and Na/Ca-exchanger (NCX). Representative immunoblots and relative protein expression for α1, α2, NCX, and GAPDH or calsequestrin (CSQ) in the heart (A), aorta (B), brain (C), and kidney (D). Relative protein expression was determined by densitometry and normalized to the abundance of GAPDH or CSQ. The data represent an arbitrary ratio of protein expression in knockout mice compared with expression in control mice. The data were obtained from 3 independent experiments and are displayed as arbitrary units ± SE, n = 3. *P = 0.008.
Mice with knockout of the α2-isoform of the Na,K-ATPase in cardiac myocytes exhibit normal basal cardiovascular function.
Morphometric analysis of heart, kidney, and body weight were performed on mice at 4 and 8 mo of age (Table 1). There were no significant differences in the heart-to-body or kidney-to-body weight ratios in control and knockout mice at 4 or 8 mo of age. These results indicate that there are no gross abnormalities in the structure of the heart as a result of the heart-specific knockout of α2. By tail-cuff, there was no significant difference in basal SBP between control and knockout mice (97 ± 1 and 99 ± 1, respectively, P = 0.164), indicating that the heart-specific expression of α2 does not play a role in the regulation of basal SBP. Cardiovascular function in anesthetized close-chest mice is shown in Fig. 3. Under basal conditions there were no significant differences in HR, mean atrial pressure, dP/dtmax, and dP/dt40 in knockout mice. Inotropic, chronotropic, and pressor responses to β-adrenergic stimulation with low doses of dobutamine were not different in knockout mice compared with control, but the inotropic response at the high dose of dobutamine (32 ng·g body wt−1·min−1) was slightly blunted (Fig. 3C). Taken together, these results indicate that the heart-specific expression of α2 does not play a major role in the regulation of cardiac function at rest or in response to β-adrenergic stimulation.
Table 1.
Basal morphometric analysis of heart knockout mice
| 4 mo |
8 mo |
|||
|---|---|---|---|---|
| Control | Knockout | Control | Knockout | |
| n | 9 | 7 | 4 | 6 |
| Body wt, g | 26.3 ± 1.3 | 26.6 ± 1.0 | 34.4 ± 1.9 | 32.2 ± 1.5 |
| Heart wt, mg | 121.6 ± 7.9 | 124.9 ± 4.1 | 149.8 ± 12.7 | 141.5 ± 10.3 |
| Kidney wt, mg | 323.8 ± 29.2 | 355.3 ± 20.1 | 408.3 ± 55.9 | 381.7 ± 30.1 |
| Heart wt:body wt | 4.6 ± 0.1 | 4.7 ± 0.1 | 4.4 ± 0.4 | 4.4 ± 0.2 |
| Kidney wt:body wt | 13.1 ± 0.5 | 13.1 ± 0.4 | 12.2 ± 1.4 | 11.8 ± 0.6 |
Values are means ± SE.
Fig. 3.
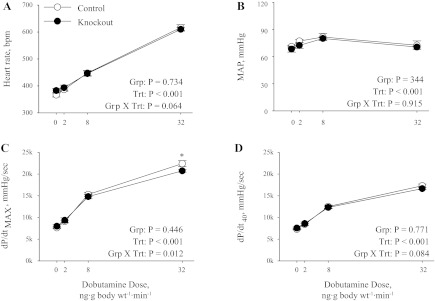
Basal cardiovascular performance. Heart rate [in beats/min (bpm); A], mean atrial pressure (MAP; B), maximum rate of cardiac contraction (dP/dtmax; C), and rate of cardiac contraction at 40 mmHg (dP/dt40; D) were determined in anesthetized control (n = 7) and knockout (n = 7) mice using a pressure catheter advanced into the left ventricle. Data were collected at baseline (0) and following administration of increasing doses of dobutamine. Values represent means ± SE. Main effects and interactions from 2-way repeated-measures ANOVA are shown in each panel. Grp, group; Trt, treatment. Post hoc comparisons were as follows: *P = 0.015 compared with control.
Mice with knockout of the α2-isoform of the Na,K-ATPase in cardiac myocytes develop ACTH-induced hypertension.
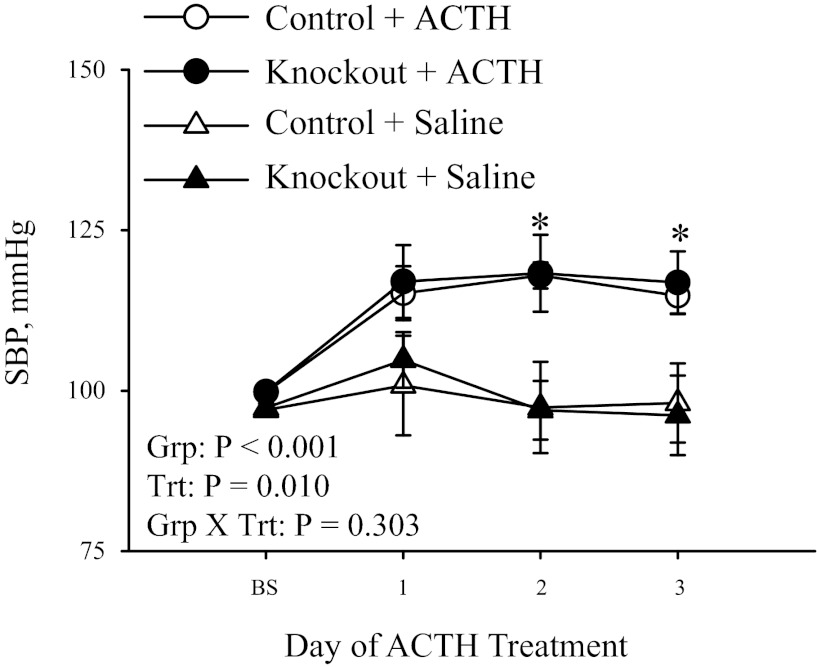
Since the cardiac expression of α2 resulted in no differences in basal cardiovascular hemodynamics as assessed by morphometric analysis, basal SBP, and cardiac functional analysis, we next examined whether cardiac α2 participates in the pressor response to ACTH. Administration of ACTH has been shown to induce hypertension that is dependent on the cardiac glycoside binding site of α2 and results from an increase in the concentration of circulating cardiac glycosides in the plasma (8, 19, 25). Therefore, we evaluated SBP by tail-cuff in control and heart-specific knockout mice in response to administration of ACTH. As shown in Fig. 4, there was no significant difference in the basal SBP in control and knockout mice, consistent with the basal blood pressure data. Administration of vehicle control (saline) resulted in no changes in SBP in control or knockout mice throughout the 3 days of treatment. However, control mice treated with ACTH developed hypertension by day 2 of ACTH treatment (101 ± 2 to 119 ± 3 mmHg; P < 0.05), and pressure remained elevated on day 3 of treatment. Similarly, knockout mice also developed hypertension by day 2 of ACTH treatment (99 ± 1 to 117 ± 6 mmHg; P < 0.05), and the pressure remained elevated on day 3 of treatment. These data indicate that the cardiac expression of α2 does not participate in the development of ACTH-induced hypertension.
Fig. 4.
ACTH-induced hypertension. Systolic blood pressure (SBP) was measured by the tail-cuff method in 3- to 6-mo-old mice following ACTH treatment (control, n = 6; and knockout, n = 4) or saline (control, n = 5; and knockout, n = 5). Baseline (BS) measurement was the average of 7 days of basal SBP measurements, followed by 3 days of ACTH or saline treatment. Values represent means ± SE. Main effects and interactions from 2-way repeated-measures ANOVA are shown. Post hoc comparisons were as follows: *P < 0.05 compared with saline treatment.
There were no significant differences in the heart-to-body weight ratio in control and knockout mice treated with ACTH for 3 days (Table 2), indicating that ACTH did not cause any gross abnormalities in the structure of the heart in either control or knockout mice. Additionally, representative immunoblots and relative protein expression levels for α1, α2, and NCX are shown in Fig. 5. ACTH treatment did not result in any significant changes in expression profiles of α1 (Fig. 5A), α2 (Fig. 5B), or NCX (Fig. 5C) in control and knockout mice. However, consistent with the basal α2 expression levels shown in Fig. 2A, there is a significant reduction in the expression level of α2 in knockout heart microsomes. These results indicate that ACTH treatment did not change the expression profiles of α1, α2, or NCX in either control or knockout mice.
Table 2.
Morphometric analysis of heart knockout mice following 3 days of ACTH treatment
| Saline |
ACTH |
|||
|---|---|---|---|---|
| Control | Knockout | Control | Knockout | |
| Body wt, g | 23.0 ± 1.6 | 22.7 ± 1.0 | 21.7 ± 0.7 | 21.4 ± 0.7 |
| Heart wt, mg | 106.2 ± 5.7 | 106.8 ± 4.6 | 106.4 ± 4.3 | 101.6 ± 2.0 |
| Heart wt:body wt | 4.6 ± 0.1 | 4.7 ± 0.1 | 4.9 ± 0.1 | 4.7 ± 0.2 |
Values are means ± SE; n = 5.
Fig. 5.
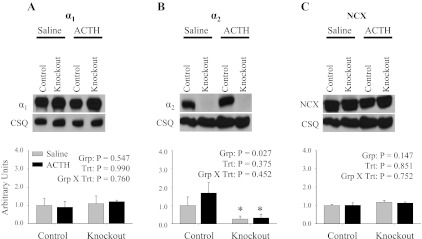
Expression profile of the α1- and α2-isoforms of the Na,K-ATPase and NCX following ACTH treatment. Representative immunoblots and relative protein expression in heart microsomes of α1 (A), α2 (B), and NCX (C) following 3 days of ACTH treatment are shown. Relative protein expression was determined by densitometry and normalized to the abundance of CSQ. The data represent a relative ratio of protein expression to that of saline control. The data were obtained from 3 independent experiments and are displayed as arbitrary units ± SE, n = 3. Main effects and interactions from 2-way ANOVA are shown in each panel. Post hoc comparisons were as follows: *P < 0.05 compared with control.
Mice with the knockout of the α2-isoform of the Na,K-ATPase in cardiac myocytes display delayed onset of pressure overload-induced cardiac dysfunction.
Since cardiac expression of α2 is not required for ACTH-induced hypertension, we then evaluated the role of cardiac expression of α2 during chronic mechanical stress using transaortic constriction (TAC). Unlike ACTH-induced hypertension, which places stress on both the vasculature and the heart (32, 35), the mechanical stress induced by TAC is primarily directed toward the heart. Pressure gradients produced by TAC were comparable in both groups of mice at 3, 6, and 9 wk post-TAC (3 wk: control = 65.4 ± 4.1, knockout = 75.3 ± 5.8; 6 wk: control = 67.5 ± 11.4, knockout = 77.2 ± 2.4; and 9 wk: control = 63.6 ± 4.6, knockout = 63.1 ± 4.1). There were no appreciable gradients in sham-operated mice. There were no significant differences in body weight in control and knockout mice following TAC and sham-operation procedures (0 wk, 26.7 ± 0.8; 9 wk, 30.7 ± 0.9; group P = 0.217, treatment P < 0.001, interaction P = 0.832).
Representative composite whole heart images are shown in Fig. 6A, illustrating a substantial degree of hypertrophy in response to 9 wk of TAC in both groups of mice, but there were no gross differences between control and knockout mice 9 wk after TAC or sham operation. Gravimetric analysis of heart weight normalized to body weight at 0, 3, 6, and 9 wk post-TAC (Fig. 7C) indicated that the hypertrophic response to TAC was not different between control and knockout mice (significant treatment effect, but no group effect or interaction). To further examine the hypertrophic response, myocyte cross-sectional area was determined from control and knockout hearts at 9 wk post-TAC using WGA to stain myocyte membranes. Representative images of WGA-stained myocytes are shown in Fig. 6B, with the summary of myocytes cross-sectional areas in Fig. 6D. Interestingly, myocyte cross-sectional area was significantly higher in knockout mice compared with control mice, both under baseline conditions (sham operation) and following TAC; however, the increase in response to TAC was equivalent in both groups (significant group and treatment effect, but no interaction). Taken together, these results indicate that there are no major morphological differences in the hypertrophic response to TAC in knockout versus control hearts.
Fig. 6.
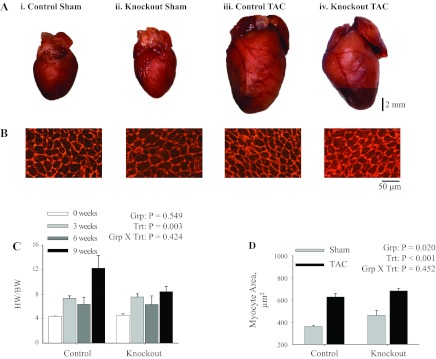
Morphology of hearts following 9 wk of transaortic constriction (TAC). Representative composite images of gross morphology of whole hearts (A) and longitudinal sections of the left ventricular free wall (B) from hearts of mice that underwent sham operation [control (i) and knockout (ii)] or TAC [control (iii) knockout (iv)] at 9 wk postsurgery. Longitudinal sections were stained with wheat germ agglutinin to visualize the cardiac myocyte membranes, and images were obtained at ×40 magnification. Comparison of whole heart weight normalized to body weight (HW/BW; C) were made following TAC: sham (0 wk; n = 4), 3 wk TAC (n = 3), 6 wk TAC (n = 2), and 9 wk TAC (control, n = 9; and knockout, n = 15). Cardiac myocyte cross-sectional area (D) was measured in 48–100 myocytes from each heart that underwent sham operation (control, n = 4; and knockout, n = 4) or TAC (control, n = 4; and knockout, n = 5). Values represent means ± SE. Main effects and interactions from 2-way ANOVA are shown in each panel.
Fig. 7.
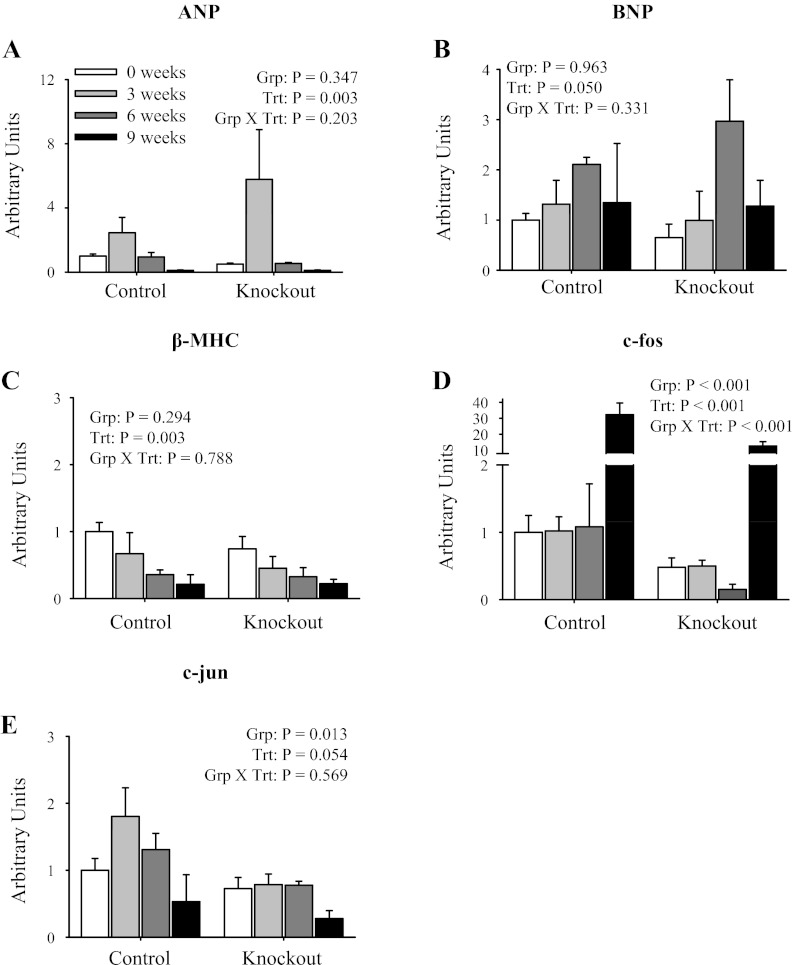
mRNA expression profile of cardiac hypertrophy markers in isolated ventricles following TAC. Quantitative real-time PCR analysis of mRNA expression of atrial natriuretic peptide (ANP; A), brain natriuretic peptide (BNP; B), β-MHC (C), c-fos (D), and c-jun (E) normalized to GAPDH expression is shown. Data were collected from mice at 0 (sham), 3, 6, and 9 wk post-TAC surgery. The data represent a relative ratio of mRNA expression to that of the 0-wk control. Values represent means ± SE; n = 4. Main effects and interactions from 2-way ANOVA are shown in each panel.
Cardiac hypertrophy is an adaptive response to increased hemodynamic demands on the heart, which is often accompanied by reactivation of fetal gene programs (3, 26, 27). Expression profiles of fetal gene programs including ANP, BNP, and β-MHC are shown in Fig. 7. There was increased ANP expression (Fig. 7A) at 3 wk post-TAC and increased BNP expression (Fig. 7B) at 6 wk post-TAC, consistent with previous reports (3, 26, 27). However, the increased expression of ANP and BNP in response to TAC was not different between control and knockout mice (significant treatment effect, but no group effect or interaction). Interestingly, there was decreased β-MHC expression (Fig. 7C) in both control and knockout mice following TAC. These results indicate that the heart-specific knockout of α2 does not alter the reactivation of fetal gene programs in response to pressure overload.
The Na,K-ATPase has been shown to function as a signal transducer in response to low doses of ouabain, resulting in the activation of early response genes including c-fos and c-jun that are implicated in cardiac growth and hypetrophy (18, 22, 36). As shown in Fig. 7, there was decreased expression of both c-fos (Fig. 7D) and c-jun (Fig. 7E) in knockout animals at baseline (week 0; significant group effect). Furthermore, there was significant activation of c-fos expression (Fig. 7D) at 9 wk post-TAC in control mice; however, there was decreased activation in knockout mice (signifcant treatment and interaction). Taken together, these results indicate that the heart-specific knockout of α2 decreases the activation of early response genes including c-fos and c-jun.
To assess whether the mechanical stress on the heart induced by TAC affected blood pressure regulation, SBP was evaluated at 0, 3, 6, and 9 wk post-TAC. As shown in Table 3, there was no significant difference in the basal (0) SBP in control and knockout mice, consistent with the basal blood pressure data and Fig. 4. Additionally, no significant differences in SBP were found in control and knockout mice at 3, 6, and 9 wk post-TAC. These results indicate that the pressure overload induced by TAC did not alter SBP and therefore supports that the mechanical stress induced by TAC is specific to the heart.
Table 3.
SBP following transaortic constriction
| SBP, mmHg |
||
|---|---|---|
| Post-TAC | Control | Knockout |
| 0 wk | 98.5 ± 0.8 | 97.0 ± 1.0 |
| 3 wk | 96.4 ± 7.5 | 91.7 ± 2.6 |
| 6 wk | 99.6 ± 5.6 | 91.4 ± 2.9 |
| 9 wk | 93.2 ± 3.4 | 96.5 ± 3.5 |
Values are means ± SE; control (n = 5) and knockout (n = 10). Baseline (0), 3-, 6-, and 9-wk measurements are the average of 3 days of systolic blood pressure (SBP) measurements. Main effects and interactions from 2-way ANOVA are as follows: group, P = 0.200; treatment, P = 0.792; and group X treatment, P = 0.501.
To determine the effect of the heart-specific knockout of α2 on cardiac function following TAC, echocardiographs were performed (Table 4 and Fig. 8). As shown in Table 4 and Fig. 8F, there were no significant differences in the HR between any groups; in addition, the HR was within the normal range for animals under isoflurane anesthesia. However, there was a significant decrease in the HR of both groups following 9 wk of TAC, consistent the development of cardiac dysfunction. Furthermore, as shown in Table 4, heart function was not different between sham-operated control and sham-operated knockout mice. In addition, before TAC, there were no significant differences in the ESV (Fig. 8A), EDV (Fig. 8B), SV (Fig. 8C), EF (Fig. 8D), or left ventricular posterior wall thickness during diastole (Fig. 8E) in control and knockout mice. Taken together, these results further support that the expression of α2 in the heart does not play a major role in the regulation of basal cardiac function. Following TAC, knockout mice displayed a decreased severity of cardiac dysfunction at 3 and 6 wk postsurgery compared with control mice, as assessed through ESV (Fig. 8A), EDV (Fig. 8B), and EF (Fig. 8D). Furthermore, there were no significant differences in the SV (Fig. 8C) or left ventricular posterior wall thickness during diastole (Fig. 8E) between control and knockout mice following TAC. Interestingly, at 9 wk post-TAC, the severity of cardiac dysfunction in knockout mice reached control levels, as assessed through ESV (Fig. 8A), EDV (Fig. 8B), and EF (Fig. 8D). Interestingly, as shown in Fig. 9, there were no differences in cardiac contraction (dP/dtmax; Fig. 9A) or cardiac relaxation (dP/dtmin; Fig. 9B) in anesthetized mice following TAC. Taken together, these results indicate that the heart-specific knockout of α2 delays the progression of cardiac dysfunction in response to pressure overload; however, the absence of α2 is not sufficient to prevent the onset of cardiac dysfunction.
Table 4.
Functional echocardiography data for sham-operated mice at 9 wk
| Control | Knockout | |
|---|---|---|
| End-systolic volume, ml | 0.034 ± 0.002 | 0.029 ± 0.002 |
| End-diastolic volume, ml | 0.059 ± 0.005 | 0.058 ± 0.006 |
| Stroke volume, ml | 0.024 ± 0.003 | 0.029 ± 0.004 |
| Ejection fraction, % | 41.1 ± 2.7 | 49.7 ± 1.7 |
| LVPWd, mm | 1.299 ± 0.164 | 1.241 ± 0.038 |
| Heart rate, beats/min | 521.3 ± 11.3 | 528.8 ± 7.2 |
Values are means ± SE; n = 4. LVPWd, left ventricular posterior wall thickness diastole.
Fig. 8.
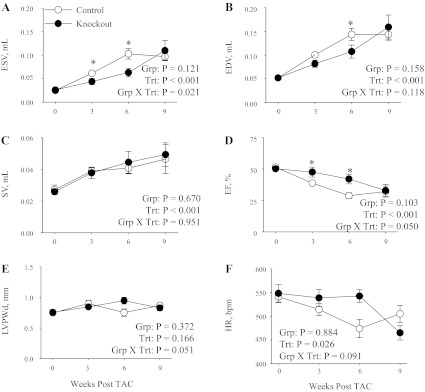
Echocardiography in control and knockout mice following transaortic constriction. Echocardiographic measurements for end-systolic volume (ESV; A), end-diastolic volume (EDV; B), stroke volume (SV; C), ejection fraction (EF; D), left ventricular posterior wall thickness during diastole (LVPWd; E), and heart rate (HR; F) were made in control (n = 9) and knockout (n = 9) mice. Data were collected at baseline (0) and 3, 6, and 9 wk post-TAC surgery. Values represent means ± SE. Main effects and interactions from 2-way repeated-measures ANOVA are shown in each panel. Post hoc comparisons were as follows: *P < 0.05 compared with control.
Fig. 9.
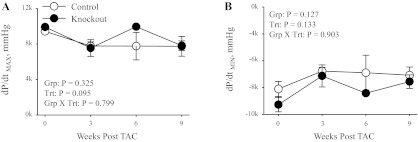
Cardiovascular performance in control and knockout mice following TAC. Maximum rate of cardiac contraction (dP/dtmax; A), and minimum rate of cardiac contraction (dP/dtmin; B) were determined in anesthetized mice using a pressure catheter advanced into the left ventricle. Data were collected from mice at 0 (sham), 3, 6, and 9 wk post-TAC surgery (0 wk, n = 4; 3 wk TAC, n = 3; 6 wk TAC control, n = 2, and knockout, n = 1; 9 wk TAC control, n = 5, and knockout, n = 10). Values represent means ± SE. Main effects and interactions from 2-way ANOVA are shown in each panel.
Finally, to assess the possible role of altered Ca2+ handling in the delayed onset of cardiac dysfunction in knockout mice following TAC, the expression profile for α1, α2, and NCX were performed on mice following 9 wk of TAC. Representative immunoblots and relative protein expression levels for α1, α2, and NCX are shown in Fig. 10. The TAC surgical procedure did not result in any significant changes in expression profiles of α1 (Fig. 10A), α2 (Fig. 10B), or NCX (Fig. 10C) in control and knockout mice. However, consistent with the basal α2 expression levels shown in Fig. 2A, there was significant reduction in the expression level of α2 in knockout heart microsomes. These results indicate that TAC did not change the expression profiles of α1, α2, or NCX in either control or knockout mice. These results suggest that alterations in Ca2+ handling are not responsible for the delayed onset of cardiac dysfunction.
Fig. 10.
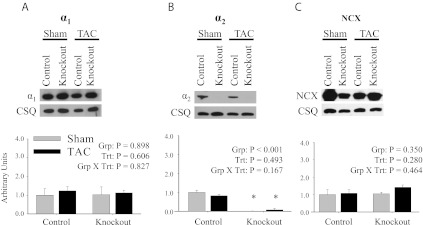
Expression profile of the α1- and α2-isoforms of the Na,K-ATPase and NCX following TAC. Representative immunoblots and relative protein expression in heart microsomes of α1 (A), α2 (B), and NCX (C) following 9 wk of TAC. Relative protein expression was determined by densitometry and normalized to the abundance of CSQ. The data represent a relative ratio of protein expression to that of the 0-wk control. The data were obtained from 3 independent experiments and are displayed as arbitrary units ± SE; n = 3. Main effects and interactions from 2-way ANOVA are shown in each panel. Post hoc comparisons were as follows: *P < 0.05 compared with control.
DISCUSSION
Although the α2-isoform of the Na,K-ATPase is a minor isoform of the Na,K-ATPase expressed in the cardiovascular system, the α2 plays a critical role in the regulation of cardiovascular function (1, 11, 15, 25, 29, 37). However, the organ system expressing the α2 that is required for this regulation has not been fully defined. The present study uses a heart-specific knockout of the α2-isoform of the Na,K-ATPase to further examine the tissue-specific role of α2 in the regulation of cardiovascular hemodynamics. The β-MHC Cre was used to generate a heart-specific knockout of α2, and from quantitative Western blot analysis, there was a ∼90% reduction in α2 expression in the heart. In addition, the β-MHC Cre has been shown to drive efficient recombination in skeletal muscle; however, this not expected to affect cardiovascular hemodynamics (21).
Consistent with our previous report on the vascular SMα2−/− (25), the heart-specific knockout mice also exhibit normal basal cardiac function and SBP. This is in striking contrast to the basal hypertension and cardiac hypercontractility observed in mice with the global genetic knockout of one copy of α2 (α2+/−) (37) and further suggests that the α2-isoform of the Na,K-ATPase in another tissue is responsible for the regulation of basal cardiovascular function. Interestingly, several reports have shown that increased levels of endogenous brain ouabain activate the renin-angiotensin system (13, 17, 38). Furthermore, Hou et al. (12) have shown that the activation of the renin-angiotensin system is increased in the brain of α2+/− mice, which may contribute to the basal hypertension. Additionally, increased salt (NaCl) in cerebrospinal fluid has been shown to result in an increase in the level of endogenous brain ouabain. The increased endogenous brain ouabain results in increased HR and hypertension that is dependent on the ouabain-binding site of α2-isoform in the brain (33). Taken together, these results suggest that the chronic reduction in the activity/expression of α2 in the brain of the α2+/− mice is likely responsible for the previously reported basal hypertension and hypercontractility.
Administration of ACTH, at doses similar to ours, results in a 1.5-fold increase in ACTH in circulating plasma (32). In addition, we have shown that these doses result in a 2.5-fold increase in circulating endogenous cardiac glycosides in mice (7, 8, 32). Therefore, ACTH administration acts as a stress on mice, resulting in a significant increase in blood pressure, which is associated with changes in cardiac output and total peripheral resistance (10, 28, 32, 35). Surprisingly, the heart-specific knockout mice developed ACTH-induced hypertension in response to 3 days of ACTH administration that was not quantitatively different from that seen in control mice. This is in contrast to our previous reports on the SMα2−/− mice, which failed to develop ACTH-induced hypertension in response to 5 days of ACTH administration. The SMα2−/− mice exhibit knockout of α2 in both the heart and vascular smooth muscle (25). Taken together, these findings suggest that ACTH-induced hypertension is primarily dependent on vascular smooth muscle α2 expression. Furthermore, these results suggest that α2 expression in the heart and vascular smooth muscle are playing distinct roles in the regulation of cardiovascular hemodynamics.
Cardiac hypertrophy and ensuing heart failure can result from an assortment of mechanical, hemodynamic, and hormonal stresses on the heart (9, 14, 27). During TAC, a model of pressure overload-induced hypertrophy, the heart undergoes a remodeling process that is initially characterized by hypertrophy of ventricular walls and cardiac myocytes, which is accompanied by a reactivation of fetal gene programs. The pressure overload ultimately leads to ventricular dilation and diminished cardiac function if left untreated (3, 9, 26, 27). Interestingly, the heart-specific knockout mice display a delayed onset of cardiac dysfunction compared with control mice at 3 and 6 wk post-TAC. However, at 9 wk post-TAC, cardiac dysfunction in the heart-specific knockout mice has deteriorated to control levels. These results suggest that cardiac expression of α2 participates in the rapid onset of cardiac dysfunction in control mice exposed to pressure overload but that the absence of α2 was not sufficient to prevent the onset of cardiac dysfunction.
Interestingly, the Na,K-ATPase is known to function as a signal transducer in response to low doses of ouabain, resulting in the activation of early response genes including c-fos and c-jun that are implicated in cardiac growth and hypetrophy (18, 22, 36). Furthermore, there was a significant decrease in expression of early response genes c-fos and c-jun in knockout mice at baseline. Additionally, there was a significant decrease in c-fos activation in knockout mice in response to TAC, indicating that knockout mice exhibited a diminished signaling response to TAC. Taken together, these results suggest that the activation of signaling cascades through the α2-isoform in the heart is required for the rapid onset of cardiac dysfunction in control mice exposed to pressure overload.
In summary, the present study refines the roles of α2 expression in the brain, vascular smooth muscle, and heart in the regulation of cardiovascular function. Though vascular smooth muscle expression of α2 appears to be required for ACTH-induced hypertension, cardiac expression does not. By contrast, cardiac expression of α2 seems to participate in the hypertrophic response to pressure overload though the activation of early response genes. Based on these and previous findings, we surmise that the expression of α2 in the brain is required for the basal regulation of cardiovascular function, whereas the vascular smooth muscle and heart expression of α2 play distinct roles in the regulation of cardiovascular function in response to mechanical stress. These data support the hypothesis that the tissue localization of the α2-isoform of the Na,K-ATPase determines its unique roles in the regulation of cardiovascular function.
ACKNOWLEDGMENTS
We thank Robyn Pilcher-Roberts for technical assistance, Dr. Palanikumar Manoharan for help with the preparation of the manuscript, and Maureen Bender for animal husbandry.
GRANTS
This research was supported by National Heart, Lung, and Blood Institute Grant R01-HL-28573(to J. B. Lingrel).
DISCLOSURES
No conflicts of interest, financial or otherwise, are declared by the author(s).
AUTHOR CONTRIBUTIONS
T.N.R., J.N.L., and J.B.L. conception and design of research; T.N.R., V.M.L., M.L.N., and M.O. performed experiments; T.N.R., V.M.L., M.L.N., and J.N.L. analyzed data; T.N.R. and J.N.L. interpreted results of experiments; T.N.R. prepared figures; T.N.R. drafted manuscript; T.N.R., V.M.L., M.L.N., J.N.L., and J.B.L. edited and revised manuscript; T.N.R., V.M.L., M.L.N., M.O., J.N.L., and J.B.L. approved final version of manuscript.
REFERENCES
- 1. Berry RG, Despa S, Fuller W, Bers DM, Shattock MJ. Differential distribution and regulation of mouse cardiac Na+/K+-ATPase alpha1 and alpha2 subunits in T-tubule and surface sarcolemmal membranes. Cardiovasc Res 73: 92–100, 2007 [DOI] [PubMed] [Google Scholar]
- 2. Daugherty A, Rateri D, Hong L, Balakrishnan A. Measuring blood pressure in mice using volume pressure recording, a tail-cuff method. J Vis Exp pii: 1291, 2009. [DOI] [PMC free article] [PubMed] [Google Scholar]
- 3. Dorn GW, 2nd, Robbins J, Ball N, Walsh RA. Myosin heavy chain regulation and myocyte contractile depression after LV hypertrophy in aortic-banded mice. Am J Physiol Heart Circ Physiol 267: H400–H405, 1994 [DOI] [PubMed] [Google Scholar]
- 4. Dostanic I, Lorenz JN, Schultz Jel J, Grupp IL, Neumann JC, Wani MA, Lingrel JB. The alpha2 isoform of Na,K-ATPase mediates ouabain-induced cardiac inotropy in mice. J Biol Chem 278: 53026–53034, 2003 [DOI] [PubMed] [Google Scholar]
- 5. Dostanic I, Paul RJ, Lorenz JN, Theriault S, Van Huysse JW, Lingrel JB. The α2-isoform of Na-K-ATPase mediates ouabain-induced hypertension in mice and increased vascular contractility in vitro. Am J Physiol Heart Circ Physiol 288: H477–H485, 2005 [DOI] [PubMed] [Google Scholar]
- 6. Dostanic I, Schultz Jel J, Lorenz JN, Lingrel JB. The alpha 1 isoform of Na,K-ATPase regulates cardiac contractility and functionally interacts and co-localizes with the Na/Ca exchanger in heart. J Biol Chem 279: 54053–54061, 2004 [DOI] [PubMed] [Google Scholar]
- 7. Dostanic-Larson I, Lorenz JN, Van Huysse JW, Neumann JC, Moseley AE, Lingrel JB. Physiological role of the α1- and α2-isoforms of the Na+-K+-ATPase and biological significance of their cardiac glycoside binding site. Am J Physiol Regul Integr Comp Physiol 290: R524–R528, 2006 [DOI] [PubMed] [Google Scholar]
- 8. Dostanic-Larson I, Van Huysse JW, Lorenz JN, Lingrel JB. The highly conserved cardiac glycoside binding site of Na,K-ATPase plays a role in blood pressure regulation. Proc Natl Acad Sci USA 102: 15845–15850, 2005 [DOI] [PMC free article] [PubMed] [Google Scholar]
- 9. Grossman W, Jones D, McLaurin LP. Wall stress and patterns of hypertrophy in the human left ventricle. J Clin Invest 56: 56–64, 1975 [DOI] [PMC free article] [PubMed] [Google Scholar]
- 10. Gruber KA, Eskridge-Sloop SL, Eldridge JC, Callahan MF. ACTH-induced hypertension in rats: fact or artifact? Am J Physiol Regul Integr Comp Physiol 256: R1308–R1312, 1989 [DOI] [PubMed] [Google Scholar]
- 11. Han F, Tucker AL, Lingrel JB, Despa S, Bers DM. Extracellular potassium dependence of the Na+-K+-ATPase in cardiac myocytes: Isoform specificity and effect of phospholemman. Am J Physiol Cell Physiol 297: C699–C705, 2009 [DOI] [PMC free article] [PubMed] [Google Scholar]
- 12. Hou X, Theriault SF, Dostanic-Larson I, Moseley AE, Lingrel JB, Wu H, Dean S, Van Huysse JW. Enhanced pressor response to increased CSF sodium concentration and to central ANG I in heterozygous alpha2 Na+-K+-ATPase knockout mice. Am J Physiol Regul Integr Comp Physiol 296: R1427–R1438, 2009 [DOI] [PMC free article] [PubMed] [Google Scholar]
- 13. Huang BS, Leenen FH. Brain “ouabain” and angiotensin II in salt-sensitive hypertension in spontaneously hypertensive rats. Hypertension 28: 1005–1012, 1996 [DOI] [PubMed] [Google Scholar]
- 14. Hunter JJ, Chien KR. Signaling pathways for cardiac hypertrophy and failure. N Engl J Med 341: 1276–1283, 1999 [DOI] [PubMed] [Google Scholar]
- 15. James PF, Grupp IL, Grupp G, Woo AL, Askew GR, Croyle ML, Walsh RA, Lingrel JB. Identification of a specific role for the Na,K-ATPase alpha2 isoform as a regulator of calcium in the heart. Mol Cell 3: 555–563, 1999 [DOI] [PubMed] [Google Scholar]
- 16. Kaplan JH. Biochemistry of Na,K-ATPase. Annu Rev Biochem 71: 511–535, 2002 [DOI] [PubMed] [Google Scholar]
- 17. Leenen FH. The central role of the brain aldosterone-“ouabain” pathway in salt-sensitive hypertension. Biochim Biophys Acta 1802: 1132–1139, 2010 [DOI] [PubMed] [Google Scholar]
- 18. Liang M, Cai T, Tian J, Qu W, Xie ZJ. Functional characterization of src-interacting Na/K-ATPase using RNA interference assay. J Biol Chem 281: 19709–19719, 2006 [DOI] [PubMed] [Google Scholar]
- 19. Lorenz JN, Loreaux EL, Dostanic-Larson I, Lasko V, Schnetzer JR, Paul RJ, Lingrel JB. ACTH-induced hypertension is dependent on the ouabain-binding site of the α2-Na+-K+-ATPase subunit. Am J Physiol Heart Circ Physiol 295: H273–H280, 2008 [DOI] [PMC free article] [PubMed] [Google Scholar]
- 20. Oka T, Maillet M, Watt AJ, Schwartz RJ, Aronow BJ, Duncan SA, Molkentin JD. Cardiac-specific deletion of Gata4 reveals its requirement for hypertrophy, compensation, and myocyte viability. Circ Res 98: 837–845, 2006 [DOI] [PubMed] [Google Scholar]
- 21. Parsons SA, Millay DP, Wilkins BJ, Bueno OF, Tsika GL, Neilson JR, Liberatore CM, Yutzey KE, Crabtree GR, Tsika RW, Molkentin JD. Genetic loss of calcineurin blocks mechanical overload-induced skeletal muscle fiber type switching but not hypertrophy. J Biol Chem 279: 26192–26200, 2004 [DOI] [PubMed] [Google Scholar]
- 22. Peng M, Huang L, Xie Z, Huang WH, Askari A. Partial inhibition of Na+/K+-ATPase by ouabain induces the Ca2+-dependent expressions of early-response genes in cardiac myocytes. J Biol Chem 271: 10372–10378, 1996 [DOI] [PubMed] [Google Scholar]
- 23. Pressley TA. Phylogenetic conservation of isoform-specific regions within α-subunit of Na+-K+-ATPase. Am J Physiol Cell Physiol 262: C743–C751, 1992 [DOI] [PubMed] [Google Scholar]
- 24. Rajan S, Jagatheesan G, Karam CN, Alves ML, Bodi I, Schwartz A, Bulcao CF, D'Souza KM, Akhter SA, Boivin GP, Dube DK, Petrashevskaya N, Herr AB, Hullin R, Liggett SB, Wolska BM, Solaro RJ, Wieczorek DF. Molecular and functional characterization of a novel cardiac-specific human tropomyosin isoform. Circulation 121: 410–418, 2010 [DOI] [PMC free article] [PubMed] [Google Scholar]
- 25. Rindler TN, Dostanic I, Lasko VM, Nieman ML, Neumann JC, Lorenz JN, Lingrel JB. Knockout of the Na,K-ATPase α2-isoform in the cardiovascular system does not alter basal blood pressure but prevents ACTH-induced hypertension. Am J Physiol Heart Circ Physiol 301: H1396–H1404, 2011 [DOI] [PMC free article] [PubMed] [Google Scholar]
- 26. Rockman HA, Ross RS, Harris AN, Knowlton KU, Steinhelper ME, Field LJ, Ross J, Jr, Chien KR. Segregation of atrial-specific and inducible expression of an atrial natriuretic factor transgene in an in vivo murine model of cardiac hypertrophy. Proc Natl Acad Sci USA 88: 8277–8281, 1991 [DOI] [PMC free article] [PubMed] [Google Scholar]
- 27. Sakata Y, Hoit BD, Liggett SB, Walsh RA, Dorn GW., 2nd Decompensation of pressure-overload hypertrophy in G alpha q-overexpressing mice. Circulation 97: 1488–1495, 1998 [DOI] [PubMed] [Google Scholar]
- 28. Schyvens CG, Mangos GJ, Zhang Y, McKenzie KU, Whitworth JA. Telemetric monitoring of adrenocorticotrophin-induced hypertension in mice. Clin Exp Pharmacol Physiol 28: 758–760, 2001 [DOI] [PubMed] [Google Scholar]
- 29. Shelly DA, He S, Moseley A, Weber C, Stegemeyer M, Lynch RM, Lingrel J, Paul RJ. Na+ pump α2-isoform specifically couples to contractility in vascular smooth muscle: evidence from gene-targeted neonatal mice. Am J Physiol Cell Physiol 286: C813–C820, 2004 [DOI] [PubMed] [Google Scholar]
- 30. Sweadner KJ. Isozymes of the Na+/K+-ATPase. Biochim Biophys Acta 988: 185–220, 1989 [DOI] [PubMed] [Google Scholar]
- 31. Takeyasu K, Tamkun MM, Renaud KJ, Fambrough DM. Ouabain-sensitive (Na+ + K+)-ATPase activity expressed in mouse L cells by transfection with DNA encoding the alpha-subunit of an avian sodium pump. J Biol Chem 263: 4347–4354, 1988 [PubMed] [Google Scholar]
- 32. Turner SW, Wen C, Li M, Fraser TB, Whitworth JA. Adrenocorticotrophin dose-response relationships in the rat: haemodynamic, metabolic and hormonal effects. J Hypertens 16: 593–600, 1988 [DOI] [PubMed] [Google Scholar]
- 33. Van Huysse JW, Dostanic I, Lingrel JB, Hou X, Wu H. Hypertension from chronic central sodium chloride in mice is mediated by the ouabain-binding site on the Na,K-ATPase α2-isoform. Am J Physiol Heart Circ Physiol 301: H2147–H2153, 2011 [DOI] [PMC free article] [PubMed] [Google Scholar]
- 34. Wansapura AN, Lasko VM, Lingrel JB, Lorenz JN. Mice expressing ouabain-sensitive α1-Na,K-ATPase have increased susceptibility to pressure overload-induced cardiac hypertrophy. Am J Physiol Heart Circ Physiol 300: H347–H355, 2011 [DOI] [PMC free article] [PubMed] [Google Scholar]
- 35. Wen C, Fraser T, Li M, Turner SW, Whitworth JA. Haemodynamic mechanisms of corticotropin (ACTH)-induced hypertension in the rat. J Hypertens 17: 1715–1723, 1999 [DOI] [PubMed] [Google Scholar]
- 36. Xie Z, Askari A. Na+/K+-ATPase as a signal transducer. Eur J Biochem 269: 2434–2439, 2002 [DOI] [PubMed] [Google Scholar]
- 37. Zhang J, Lee MY, Cavalli M, Chen L, Berra-Romani R, Balke CW, Bianchi G, Ferrari P, Hamlyn JM, Iwamoto T, Lingrel JB, Matteson DR, Wier WG, Blaustein MP. Sodium pump alpha2 subunits control myogenic tone and blood pressure in mice. J Physiol 569: 243–256, 2005 [DOI] [PMC free article] [PubMed] [Google Scholar]
- 38. Zhao X, White R, Huang BS, Van Huysse J, Leenen FH. High salt intake and the brain renin-angiotensin system in dahl salt-sensitive rats. J Hypertens 19: 89–98, 2001 [DOI] [PubMed] [Google Scholar]


