

Abstract
Time-lapse fluorescence microscopy of single, growing Bacillus subtilis cells with 2-12 s time resolution reveals the mechanisms of antimicrobial peptide (AMP) action on a Gram-positive species with unprecedented detail. For the human cathelicidin LL-37 attacking B. subtilis, the symptoms of antimicrobial stress differ dramatically depending on the bulk AMP concentration. At 2 μM LL-37, the mean single-cell growth rate decreases, but membrane permeabilization does not occur. At 4 μM LL-37, cells abruptly shrink in size at the same time that Sytox Green enters the cytoplasm and stains the nucleoids. We interpret the shrinkage event as loss of turgor pressure (and presumably the membrane potential) due to permeabilization of the membrane. Movies of Sytox Green staining at 0.5 frame/s show that nucleoid staining is initially local, more consistent with pore formation than with global permeabilization models. In a novel “growth recovery” assay, cells are incubated with LL-37 for a variable period and then rinsed with fresh growth medium lacking LL-37. The growth rate attenuation observed at 2 μM LL-37 is a recoverable symptom, while the abrupt cell shrinkage observed at 4 μM LL-37 is not.
Keywords: Bacillus subtilis, antimicrobial peptide, LL-37, fluorescence microscopy
1. Introduction
Antimicrobial peptides (AMPs) are components of the innate immune system of many organisms, including insects, mammals, and amphibians [1, 2]. AMPs function as both antimicrobial agents and modulators of the immune system. While there is considerable diversity in the sequence and structure of these peptides, most have a net positive charge, a mixture of cationic and hydrophobic residues, and an amphipathic structure when bound to model lipid bilayers. The net positive charge allows the peptides to preferentially interact with the negatively charged surfaces of bacteria in favor of the more neutral surfaces of eukaryotic cells. However, the detailed mechanism(s) by which AMPs disrupt bacterial membranes and kill cells are not well understood [3, 4].
Standard bulk culture measurements of AMP activity include the minimum inhibitory concentration assay (MIC) and the minimum bactericidal concentration assay (MBC) [5]. The MIC is the concentration above which cell growth is not observed over a specified number of hours (usually 6 to 24 h) in the continuing presence of AMP. The (typically larger) MBC is the concentration at which cells removed from the AMP-containing medium do not produce new colonies on fresh agar plates lacking the AMP. It is often observed that L- and D-optical isomers of the same antimicrobial peptide have very similar MIC values. This strongly suggests that the growth-halting mechanism is primarily biophysical, rather than some specific mode of binding to a particular protein [6]. There are exceptions to this observation, as some AMPs have been shown to inhibit peptidoglycan synthesis[7]. Many of the proline rich AMP’s have been shown to have a non-membrane permeabilizing mechanism of action, and do not exhibit similar MIC values for optical isomers of the peptide [6]. Real time RT-PCR performed on B. subtilis exposed to the AMPs LL-37 and PG-1 have suggested that AMPs cause significant changes in gene expression by triggering stress-related signaling pathways [8].
Experiments that study AMP interactions with model lipid bilayer systems have provided important structural characterization by NMR, oriented circular dichroism, and x-ray and neutron scattering. Different mechanisms of membrane disruption have been proposed, including localized pore formation [9], global lipid segregation [10], and carpet- or detergent-like micellization [11]. For the human antimicrobial peptide LL-37 of interest here, there has been debate about its mechanism of membrane disruption. Some work supports a carpet model for membrane disruption [12, 13], while other work supports the pore mechanism [14, 15]. In a complementary method, molecular dynamics simulations using an atomistic model of melittin in a lipid bilayer strongly suggests that localized AMP-induced membrane disruptions have ill-defined structures only vaguely reminiscent of well-defined barrel-stave or toroidal pores [16]. Similar results were found for the shape of the pores formed by magainin [17]. The relevance of studies of model lipid bilayers to real bacterial membranes remains an open question.
We are developing single-cell, time-resolved fluorescence microscopy techniques that provide a new window on AMP interactions with live bacterial cells. A combination of imaging methods monitors cell length and membrane permeabilization events over time in each individual cell. Our initial study [18] of the attack of the α-helical AMP LL-37 and a rhodamine-labeled derivative (Rh-LL-37) on the Gram-negative E. coli showed that cell growth halted when Rh-LL-37 translocated across the outer membrane to gain access to the periplasm. This occurred long before permeabilization of the cytoplasmic membrane. On translocation Rh-LL-37 binds to immobile elements within the periplasm. We suggested that the growth-halting mechanism was interference with peptidoglycan synthesis.
Here we present a detailed study of the effects of LL-37 on the model Gram-positive bacterium Bacillus subtilis. Our data suggests two different mechanisms of growth inhibition depending on the bulk LL-37 concentration. At 2 μM LL-37 (twice the 6-hr MIC), the cell growth rate decreases without permeabilization of the membrane to the small dye Sytox Green. At 4 μM LL-37, cells abruptly shrink and Sytox Green gains entry to the cytoplasm, indicating loss of turgor pressure and presumably loss of the transmembrane potential. In a novel “recovery assay”, we remove the LL-37 after a fixed interaction time and monitor for recovery of normal growth over several hours. The growth-slowing symptom at 2 μM LL-37 is reversible for at least some cells, while the abrupt permeabilization symptom at 4 μM is not.
2. Materials and methods
2.1 Chemicals
Solid LL-37 was purchased from Anaspec (95% pure, Catalog no. 61302, Fremont, CA) and used without further purification. A 1 mM stock solution of LL-37 was made from 1 mg LL-37 and sterile, ultrapure (18 MΩ) water. This solution was separated into 50 μL aliquots, and stored at -20°C until needed. LL-37 composed of all D-amino acids (D-LL-37) at 92% purity was made by the University of Wisconsin-Madison Biotech center and stored the same way. A 5 mM Sytox Green solution in DMSO was purchased from Molecular Probes (Catalog no. S7020, Grand Island, NY). The sodium salt of nigericin was purchased from Sigma Aldrich (Catalog no. N7143, St. Louis, MO) and dissolved in ethanol. Supplements used for the media (5X EZ supplement Beta, M3104; 10X ACGU Beta, M3103; 10X MOPS mix, M2137) were purchased from Teknova (Hollister, CA).
2.2 Strains and growth conditions
B. subtilis 168 from the Bacillus Genetic Stock Center (BGSC, code 1A1) was used as the wild type strain. Plasmid pAD43-25 [19], also from BGSC, produces GFPmut3 under the control of a constitutive promoter. Our B. subtilis strain was made competent and then transformed with pAD43-25 based on the two-step method found in Molecular Biological Methods for Bacillus [20]. The strain with pAD43-25 was grown and imaged with 5 μg/mL chloroamphenicol to select for the plasmid. All strains were grown in a rich defined medium that we name s-EZRDM (“subtilis-EZRDM”), at 37°C and 200 rpm (0.9 g) in a New Brunswick Excella E24 Incubator-Shaker. The recipe is given in the Supplemental Information (Tables S1-S4). This medium offers the benefit of a doubling time similar to that of B. subtilis in Luria-Bertani broth (20 min at 37°C), but with low background fluorescence. Cultures were grown in s-EZRDM overnight, inoculated from a frozen glycerol culture. The following day, dilutions of at least 1/200 were made into pre-warmed s-EZRDM. Cells were grown to an OD of 0.04-0.06 (600 nm, 1 mm path length) as measured on a Nanodrop 2000 from Thermo Scientific, and then harvested for microscopy or MIC measurements.
2.3 Minimum Inhibitory Concentration (MIC) Assay
MICs were measured only on wild type B. subtilis. A serial dilution of either LL-37 or D-LL-37 was performed in one row of a polystyrene 96-well plate in s-EZRDM, beginning at 32 μM and with twofold dilution at each step. The final volume in each well in the row was 50 μL after serial dilution. A liquid cell culture was grown in the same conditions as described in Section 2.2, to a final OD of 0.04-0.06. This culture was diluted in s-EZRDM to an OD of 0.005. 50 μL of the diluted culture was added to each well of the LL-37 serial dilution, so that the maximum concentration tested was 16 μM. The final OD in each well was 0.0025, and the final volume in each well was 100 μL. A second row contained 50 μL of s-EZRDM plus 50 μL of inoculum (positive growth control), while a third row contained 100 μL of s-EZRDM in each well (negative growth control and blank for OD measurements). The plate was incubated at 37°C while shaking at 200 rpm (0.9 g) in an Excella 24 Incubator/Shaker from New Brunswick Scientific for up to 12 h. The “6-hr MIC” is reported as the lowest concentration for which no cell growth could be detected after 6 hr, as determined by measurements of OD at 595 nm using a Wallac EnVision 2100 Multilabel Reader from Perkin-Elmer. The MIC experiments were performed three times, and were reproducible to within a dilution factor of two. D-LL-37 and LL-37 had the same 6-hr MIC of 1 μM.
2.4 Microscopy experiments
All microscopy experiments were carried out at 37°C. The home built, temperature-controlled flow chamber, with an internal volume of ~60 μL, was described previously [18]. The only modification was coverslip preparation. We initially tried poly-L-lysine coated slides to immobilize cells for observation, but found that B. subtilis had difficulty growing on this surface. Instead, coverslips were sonicated for 30 min in acetone, rinsed with ultrapure water, and dried with nitrogen gas. Cells harvested from the mid-log phase liquid culture were diluted 1/6 in pre-warmed s-EZRDM, then injected into the flow chamber. The cells were rinsed with at least 0.8 mL of fresh medium to remove unadhered cells. The 0.5 mL antimicrobial solution, also made with s-EZRDM, contained both LL-37 and 0.5-1 nM Sytox Green, unless otherwise stated. This solution was vortexed for at least 10 s to break up possible aggregates of LL-37. Time-lapse imaging began when a region with a suitable density of plated cells was found. LL-37/Sytox Green was injected 7.5 min after the beginning of the movie; the injection itself required ~20 s. The growth medium was subsequently static after injection.
Time-lapse, widefield imaging of a field of single cells monitored entry of Sytox Green into the cytoplasm by the onset of its green fluorescence, as well as cell length and width vs time by phase contrast imaging. In some experiments, Sytox Green was omitted and cytoplasmic GFP was imaged in the green channel. The Nikon Eclipse TE300 microscope was equipped with a Nikon Phase Contrast Type DLL Objective, NA = 1.3 and an Andor iXon 897 EMCCD camera. All fluorescence images were taken using 488 nm excitation light from an Ar+ laser at an intensity of 6.6 W/cm2 at the focal plane where the cells are imaged. A 500 nm long-pass filter (HQ500LP, Chroma Technology) was used in the microscope dichroic cube. Emission filters (also from Chroma) were HQ510/20M for Sytox Green, and ET525/50M for cytoplasmic GFP. Phase contrast images were collected with the same emission filter used to image the corresponding fluorescence channel.
Most time lapse movies were obtained as follows. A 50-ms fluorescence image was taken, followed 6 s later by a 50-ms phase contrast image. This 12-s imaging cycle was repeated 300 times to obtain a 1 h movie. A few of the growth control movies used an 18 s cycle time. Faster movies focusing on the staining dynamics of Sytox Green (but still including alternate phase contrast images) were obtained with a 2-s cycle time. The fastest movies with a 0.5-s cycle time imaged only the green fluorescence.
The environment inside the chamber is temperature controlled and contains a rich medium, but the experiments presented here were performed under static conditions. We are unable to flow LL-37 continuously due to the large volume of injection solution needed and the cost of the peptide. The B. subtilis cells in the chamber are presumably growing anaerobically during most of the observation period, since oxygen is not continuously replenished. B. subtilis can grow anaerobically through fermentation if both glucose and all 20 amino acids are provided [21], as in our growth medium. The doubling time of the cells in the static flow chamber is approximately 60 min, three times longer than the 20-min doubling time in aerated liquid culture. When B. subtilis cells are grown in the chamber with a continuous flow of aerated medium, the doubling time matches the liquid culture doubling time, suggesting that interaction with the glass surface does not impede growth.
2.5 Data analysis
Movies from time-lapse imaging were analyzed using imageJ [22], and the program microbeTracker [23] using algorithm 4 with modifications to the following parameters: areaMin = 300, thresFactorM = 1.2, thresFactorF = 1.2, splitThreshold = 0.5, joindist = 8, joinangle = 1.2. MicrobeTracker calculates cell length and volume for each cell at all frames. Cell width w was calculated as the average of the width measurements obtained from the MicrobeTracker meshes over the central 60% of the cell length L. This ensured the endcaps were excluded from the width measurements. Width measurements were also performed using ImageJ on fluorescence images of GFP in the strain of B. subtilis producing cytoplasmic GFP. The width estimates from the two methods were consistent with one another. The values of cell length, width, and volume calculated from MicrobeTracker were compared to a spherocylinder model to confirm that the program was returning reasonable data (Fig. S1 and Table S5). Relative cell length vs time was calculated as Ltotal/L0, where Ltotal is the sum of the tip-to-tip lengths of the original cell plus any daughter cells it created and L0 is the length of the cell at the beginning of the movie. Relative changes in cellular dimensions as calculated by MicrobeTracker are quite reliable, while the absolute values depend somewhat on parameters chosen within the program.
3. Results
3.1 Effects of LL-37 on growth of individual cells
We have studied the effects of LL-37 on the growth of single B. subtilis cells in the concentration range 0 to 4 μM (up to four times the 6-h MIC of 1 μM). A total of 62 cells were analyzed (0 μM LL-37, N = 9; 1 μM, N = 15; 2 μM, N = 21; 4 μM, N = 17). LL-37 and D-LL-37 yielded similar results. Figure 1 shows the typical effects of LL-37 on the growth of individual cells. A representative example from a “growth control” experiment (medium with no LL-37 injected) is shown in Fig. 1A-C. This particular cell forms an obvious septum at t ~ 30 min and eventually divides. Sytox Green staining does not occur, as shown by the absence of Sytox Green fluorescence (Fig. 1B). Cell length and cell volume, as measured by MicrobeTracker, are presented in Fig. 1C. The red lines represent exponential fits to the data, using the exponential growth function Y (t)= Y0 exp[(t − t0)/τ], where Y represents either cell length (L) or volume (V). Here t0 is the time at which observation begins and Y0 is the length or volume of the cell at t0. The only fitting parameter is the base-e time constant τ. The time constant τ is related to the more typically reported doubling time td as: td = τ ln2 = 0.693 τ. For this particular cell, a good fit is obtained with the value τ = 77 min (td = 54 min) for cell length, and τ = 68 min (td = 47 min) for cell volume. Volume is not proportional to length due to endcap effects.
Figure 1.
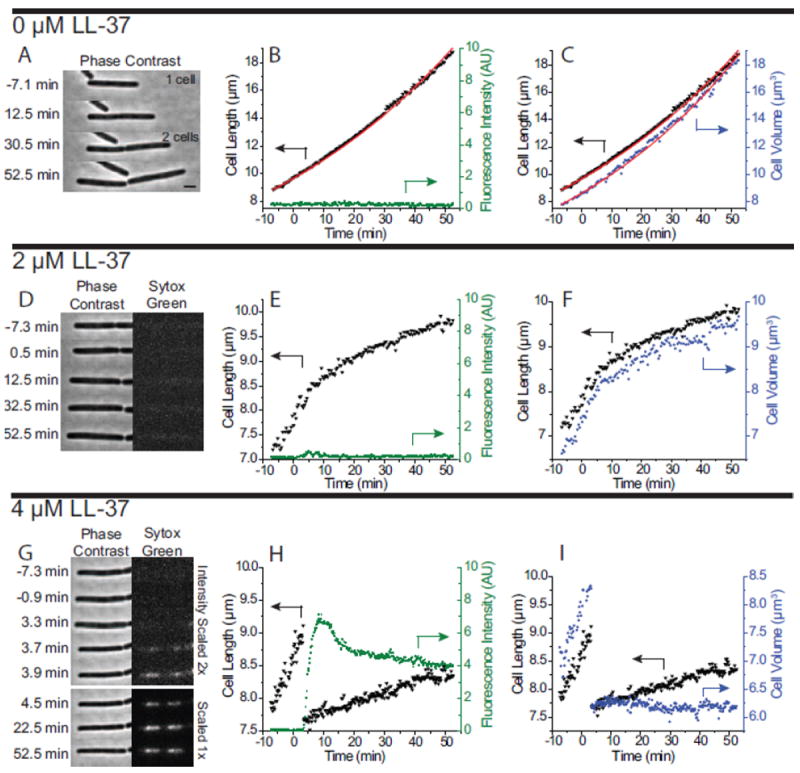
Imaging and analysis of one typical cell for LL-37 concentrations of 0 μM (panels A-C), 2 μM (D-F), and 4 μM LL-37 (G-I). Column at left shows phase contrast and green fluorescence images vs time. Middle column shows cell length (inverted triangles, left axis) and integrated Sytox Green fluorescence intensity (green circles, right axis) vs time. Column at right shows cell length (inverted triangles, left axis) and cell volume (blue squares, right axis) vs time. The red lines in B and C are exponential fits to the length data. Scale bar is 2 μm.
An example of the effects of 2 μM LL-37 (twice the 6-h MIC) on B. subtilis growth in the flow chamber is shown in Fig. 1D-F, and in Supplementary Movie 1. Prior to injection and for a lag time of ~5 min after injection, the length increases vs time with a slope reminiscent of unperturbed growth. At t ~ 5 min after injection the curvature turns negative rather abruptly while the length continues to increase, i.e., the growth rate decreases. The cell continues to lengthen, albeit more and more slowly, over the entire 50 min of observation after injection. The cell evidently maintains much of its biopolymer content throughout, as evidenced by the absence of apparent changes in phase contrast between the cytoplasm and the surrounding medium. As shown in the green fluorescence images (Fig. 1D) and the integrated Sytox Green intensity plot vs time (Fig. 1E), the cell nucleoid is not stained with Sytox Green, a cell-impermeant nucleic acid stain with a higher affinity for DNA than RNA [24]. Cells should exhibit nucleoid staining only if the barrier function of the plasma membrane has been compromised to Sytox Green. Evidently, cell growth rate is attenuated by 2 μM LL-37, but the barrier function of the membrane is maintained, at least to Sytox Green. The estimated radius of Sytox Green is ~1 nm [25], assuming a spherical molecule. Cell volume and cell length vs time (Fig. 1F) exhibit similar curves, indicating that real growth (increasing volume) is occurring.
The observations are very different at 4 μM LL-37 (four times the 6-h MIC), as shown in Fig. 1G-I and Supplementary Movie 2. At t = 3.5 min after injection of LL-37, the cell length shrinks abruptly by 16%, while the width shrinks by 7% (Fig. 1G and H). The change in cell width is calculated for the frames immediately before and after shrinkage. This abrupt shrinkage typically occurs in less than one imaging cycle (<12 s). Within 10-20 s of the cell shrinkage event, the Sytox Green fluorescence signal begins a sharp rise, direct evidence of membrane permeabilization (Fig 1H). The cytoplasm still maintains its overall biopolymer density as judged by phase contrast images, which indicates that most cytoplasmic components remain within the cell wall. We interpret the abrupt shrinkage as arising from membrane permeabilization and loss of turgor pressure, as discussed in detail below.
A surprising behavior at 4 μM LL-37 is the gradual increase in cell length immediately after the shrinkage event, as shown in Fig. 1I. While the cell never achieves its pre-shrink length over the 50-min observation time, the increase in length could mean that cell growth has been reestablished, albeit at a slower rate than before introduction of LL-37. However, the volume measurements (Fig. 1I) show no appreciable change in cell volume after cell shrinkage, indicating no real cell growth. While cell length is increasing, the cell width is decreasing in a way that preserves volume. Values of cell length, width, and volume before and after shrinkage can be found in Table S6, and confirm our hypothesis about cell volume preservation.
In order to test whether or not the membrane remains permeable after the shrinkage event, we performed experiments in which 4 μM LL-37 in growth medium without Sytox Green was injected at t = 0, and Sytox Green in growth medium was injected at varying delay times after all of the cells in the field of view had shrunk. Without Sytox Green, cell length again slowly recovered after abrupt shrinkage, indicating that Sytox Green was not causing the slow length recovery. When 1 nM Sytox Green was injected either ~5 min or ~40 min after the last cell in the field of view had shrunk (t = 10 min or 45 min, respectively), visible staining of the nucleoid again occurred within ~20 s of Sytox Green injection. These experiments demonstrate that the loss of membrane integrity is irreversible on the 50-min time scale, i.e., the membrane does not re-establish its barrier function to molecules the size of Sytox Green.
We also measured several length vs time curves at 8 μM LL-37 without Sytox Green (Fig. S1). Abrupt shrinkage events occur earlier at this higher concentration (within ~1 min for 8 μM LL-37, compared to ~3 min for 4 μM LL-37). In contrast to the typical behavior at 4 μM LL-37, there was little or no recovery of length after shrinkage. We discuss possible interpretations of the length and volume behavior below.
3.2 Comparisons among cells
Thus far we have presented data on single cells, to show the level of information we can acquire from these experiments. In Fig. 2 we compare length vs time plots for a number of cells observed at LL-37 concentrations of 0, 1, 2, and 4 μM. Because cells have different lengths prior to injection, we plot the relative cell length L(t)/L0, where L0 is the length at the beginning of the movie (t0, prior to injection). If all cells grew exponentially at the same rate, then all of the L(t)/L0 plots would superimpose.
Figure 2.
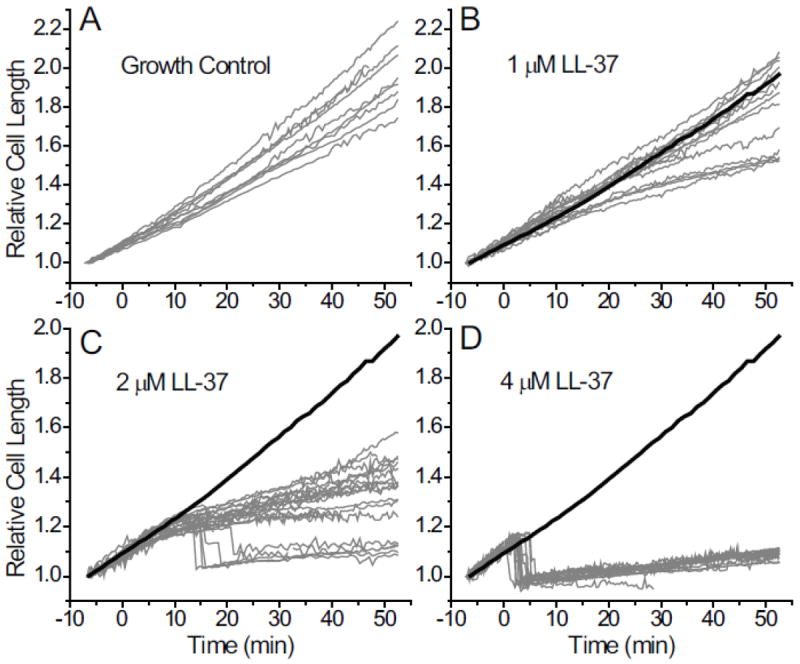
Plots of relative cell length L(t)/L0 vs time over 60 min for 62 B. subtilis cells at (A) 0 μM, (B) 1 μM, (C) 2 μM, and (D) 4 μM. LL-37 was injected at t = 0. L0 is the cell length at t = −7 min, the beginning of the observation period. The mean of the best-fit base-e growth time constants for the growth control curves in panel A is τ = 85 ± 10 min (± 1 standard deviation). For reference, the mean of the growth control curves in panel A is shown in panels B, C, and D as the heavy black line.
As estimated from length, the growth control curves (0 μM LL-37, Fig. 2A) have a mean value of the base-e growth time constant of <τ> = 85 ± 10 min (± one standard deviation), corresponding to a mean doubling time of <td> = 59 ± 6 min. The modest dispersion may be due to natural variations among cells or to mild heterogeneities within the sample cell. As a reference, the mean of all 9 growth control curves is plotted as a heavy black line in the plots of L(t)/L0 for non-zero LL-37 concentrations.
At 1 μM LL-37 (equal to the 6-h MIC value, Fig. 2B), some cells continue to grow normally throughout the 50-min observation period while approximately one-third of the cells show mild growth rate attenuation. The signature of growth rate attenuation is the change in curvature of L(t)/L0 from positive to negative. Sytox Green never stains the nucleoid at 1 μM LL-37. At 2 μM LL-37 (Fig. 2C), ~70% of cells exhibit growth rate attenuation without Sytox Green staining. The growth rate attenuation is more severe than at 1 μM LL-37. About 30% of the cells exhibit abrupt shrinkage and subsequent Sytox Green staining. At 4 μM LL-37 (Fig. 2D), all of the cells exhibit shrinkage and Sytox Green staining. The mean lag time between LL-37 injection and shrinkage is 3.5 ± 1.2 min. After shrinkage, most cells exhibit a modest recovery of cell length over 50 min. At 8 μM LL-37 (Fig. S2), all cells shrink abruptly with a mean time to shrinkage of 0.8 ± 0.2 min. There is little or no evidence of gradual recovery of length after shrinkage at 8 μM LL-37.
In Fig. 2, the experiment was repeated at least 3 times for each of the four different concentrations. All the data are combined. The variability in Fig. 2B, C, D is primarily due to variation between individual experimental runs, rather than cellular heterogeneity within a single experiment. Figure S3 shows this in greater detail. The cause of the experimental variability may be our inability to prepare uniformly active LL-37 samples, variable loss of peptide to the surfaces of the sample chamber, or inherent day-to-day variability in growing of B. subtilis cultures.
3.3 Localized Sytox Green Staining Events
As visualized by Sytox Green fluorescence at long times, most cells under these growth conditions exhibit two major nucleoid lobes (Fig. 1G). For longer cells, each lobe shows evidence of partial segregation into two sub-lobes. The fast movies of Fig. 3 demonstrates that at 4 μM LL-37, the initial entry of Sytox Green into the cytoplasm is localized. Using 2 s/frame time resolution, ~50% of the cells show initial staining in a single punctum, followed by a gradual spreading of intensity to the rest of the nucleoid. The other half of the cells exhibit two or more puncta, and only one or two cells in the group of 28 observed cells showed apparent “global” staining (staining without initial spatial localization.) In the example of Fig. 3A and Supplementary Movie 3, staining begins at the endcap of the cell and spreads to completely stain all nucleoid lobes in 1.6 min. This is an example of initial staining at one punctum. In the example of Fig. 3B, staining begins at both endcaps almost simultaneously, and then moves towards the middle of the cell to completely stain all nucleoid lobes.
Figure 3.
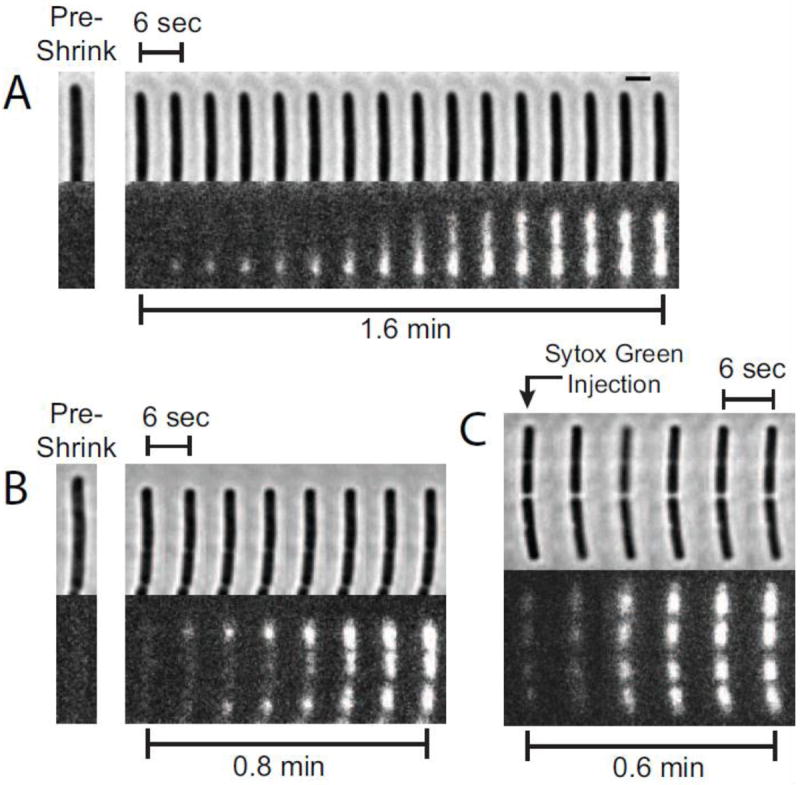
Sytox Green images vs time after abrupt shrinkage events using 4 μM LL-37. Images were acquired every 2 s, but only every third frame is shown in the sequence of images (6-s spacing). (A) An example of localized staining that begins at a single pole, and subsequently spreads to the rest of the nucleoid. The scale bar of 2 μm also applies to the images in B and C. (B) Example of localized staining beginning at both poles. (C) Example of a more global staining pattern when Sytox Green is added 45 min after introduction of LL-37, long after the shrinkage event. Staining begins simultaneously at all four nucleoid lobes and is not localized.
As an additional experiment, we injected Sytox Green ~45 min after introduction of LL-37, well after cell shrinkage (Fig. 3C). At these long time delays, Sytox Green staining was rapid, but was more global than punctal. The more global staining pattern might be due to global disruption of membrane function to molecules the size of Sytox Green. It may also be due to one local, highly permeable patch that admits Sytox Green so rapidly that we do not catch the localized staining in time.
The initially punctal staining pattern fits a model in which Sytox Green enters the cytoplasm through a small membrane patch, binds locally to DNA, gradually saturates the local binding sites, and then spreads outward in space to find additional binding sites until the entire nucleoid lobe is saturated. In such a model, the time scale on which the staining coats the entire nucleoid lobe depends on many factors, including the Sytox Green bulk concentration, the permeability of the small patch, and the binding/diffusion kinetics of Sytox Green within the cytoplasm. These factors combine to determine the observed ~1 min time scale for complete staining.
In the earliest image showing clear Sytox Green staining, the puncta are typically round but not diffraction limited. Even at 2 s/frame, the initial full width at half-maximum (FWHM) intensity is typically about 500 nm. Because the FWHM of the point-spread function is ~250 nm, we estimate an upper limit on the breadth of the source of the fluorescence as ~400 nm. Because the Sytox Green will spread out in space after entry into the cytoplasm, the small size of the initial staining patch sets an upper bound on the size of the initially permeabilized membrane patch. Localized staining implies localized membrane permeabilization, but diffraction-limited fluorescence microscopy cannot determine whether the initially permeabilized membrane patch is a pore or a disordered local disruption of the membrane. We can only say that the small size of the initial Sytox Green/DNA patch is consistent with pore formation.
3.4 Gradual Permeabilization to Larger Species at Long Times by LL-37 at 4 μM
We carried out several experiments using 4 μM LL-37 on cells expressing GFP in the cytoplasm. To avoid interference in the green channel, no Sytox Green was added. A fluorescence intensity vs time trace for a single cell is shown in Fig. 4. In all cells observed (N = 9) with 12-s cycle time between frames, the GFP fluorescence intensity first decreased by ~20–30% in one camera frame, coincident in time with the instant of cell shrinkage, and then abruptly leveled off. As argued below, we believe the abrupt decrease in intensity at the time of shrinkage is a photophysical effect, i.e., that it is not due to loss of GFP from the cytoplasm. At much longer times, t ~ 15-50 min after injection, the remaining GFP signal was lost. This loss occurs gradually over 5 to 10 min; the trace shows rounded edges at the beginning and end. We attribute this second loss of GFP fluorescence to delayed permeabilization of the membrane to GFP. It should be noted that for molecules the size of GFP, it is possible that the peptidoglycan layer may act as a permeability barrier along with the membrane.
Figure 4.
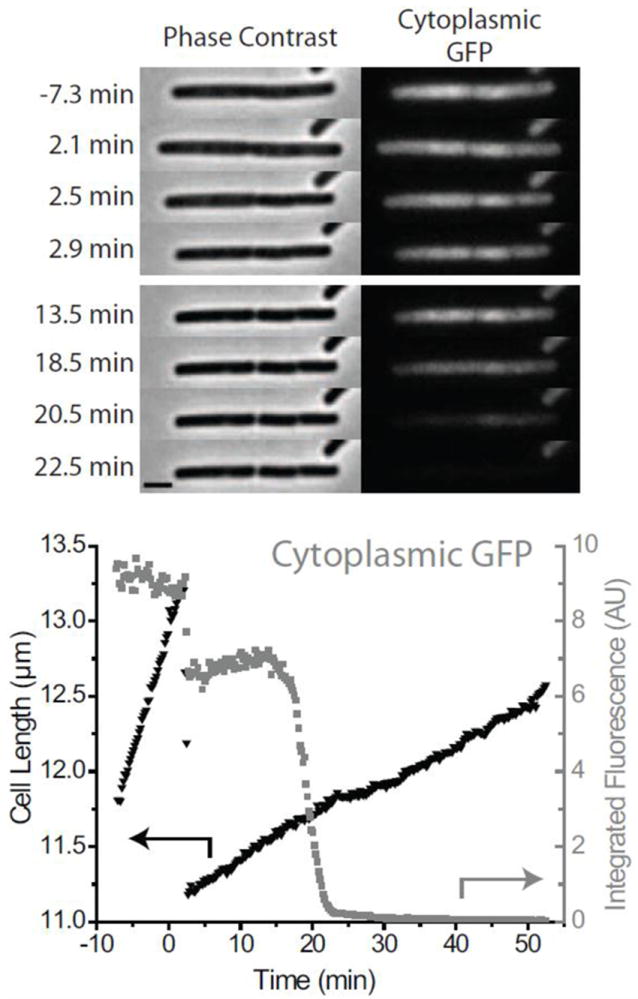
Typical effects of 4 μM LL-37 cells expressing cytoplasmic GFP. Black inverted triangles are cell length (left axis) and Cytoplasmic GFP fluorescence is shown by gray squares (right axis.) Two shrinkage events occur in rapid sequence (see frames at 2.5 and 2.9 min after injection of LL-37). This indicates the presence of a complete septum between two joined cells. GFP intensity decreases abruptly at the moment of cell shrinkage due to photophysical effects. A second decrease in GFP intensity occurs after a 15 min delay, over a period of ~10 min. This is due to delayed permeabilization of the membrane to GFP. See Section 3.4 for details. Scale bar is 2 μm.
The 20–30% loss of GFP intensity at the time of shrinkage occurred in a single camera frame even when the frame time was as short as 0.5 s (Fig. S4). If this were due to loss of GFP, it would require much of the GFP to find the localized permeabilization patch in < 0.5 s. While we have found no measurements of the diffusion constant of GFP inside the cytoplasm of B. subtilis in the literature, the diffusion constant of GFP in E. coli has been found to range from ~4-14 μm2/s [26, 27]. Even at 14 μm2/s, it would not be possible for the GFP to diffuse through the localized permeabilization patch in less than half a second. The argument is presented in detail in the Supplemental Information. Instead, we believe that the abrupt decrease in cytoplasmic pH during the shrinkage event causes a decrease in GFP quantum yield. Our medium is buffered at pH 7.4, which leads to an internal pH of ~7.8-8.1 [28, 29]. When the membrane is permeabilized, the pH in the cytoplasm will abruptly decrease by ~0.5 pH units to the pH of the buffered medium. The particular GFP used here, GFPmut3, is known to be sensitive to pH with decreasing fluorescence intensity as pH decreases, the same direction as our observations [30]. As an additional test, we carried out experiments injecting the drug nigericin, which eliminates the ΔpH across the membrane by exchanging K+ for H+ across the membrane [31, 32]. As shown in Fig. S5, 5 μM nigericin leads to an approximately 30% decrease in GFP signal for the cell shown; all cells analyzed showed a 25-35% loss of GFP signal. For nigericin treatment, there is never complete loss of GFP at longer times after shrinkage (up to 1 hr). Separate experiments confirmed that after nigericin treatment, Sytox Green did not enter the cytoplasm up to 52.5 min after injection.
In one experiment, cells not expressing GFP were incubated in 4 μM LL-37 without Sytox Green and observed for longer periods of 2-3 h. Cells abruptly shrank at t ~ 2-4 min as usual. For the two cells shown in Fig. 5 and Supplementary Movie 4, beginning at t ~ 80 min, we observed yet another behavior in which the shrunken cells lost phase contrast over a period of ~70 min. The time at which loss of phase contrast begins and the length of time over which it is lost is highly variable across cells and individual experimental runs. Similar results were obtained with cells producing cytoplasmic GFP.
Figure 5.
Long-time phase contrast images of two cells treated with 4 μM LL-37. Loss of phase contrast begins at about 80 min and continues over at least one hour. Scale bar is 2 μm.
To summarize, 4 μM of LL-37 gradually causes permeabilization of the membrane to larger and larger species over a period of hours. Simultaneous with the shrinkage event, Sytox Green permeates the membrane locally; the pH presumably equilibrates across the membrane at the same time. The membrane is permeabilized to proteins the size of GFP only much later, ~10-50 min after LL-37 addition. Localized Sytox Green staining is not observed when Sytox Green is injected ~45 min after LL-37 introduction (presumably when cytoplasmic GFP has already been lost). Still later, at t ~ 90 min, even ribosomes permeate the membrane. It is important to note that at some point during the gradual increase in permeabilization, the peptidoglycan layer will also act as a permeability barrier. In order for large, 20-nm diameter species [33] like ribosomes to escape from the peptidoglycan layer, the natural mesh size of the layer must expand [34]. We suspect that the driving force for this breakdown in the peptidoglycan layer is autolysis [35, 36], as further explored in the discussion section.
3.5 Recovery experiments
For all data reported thus far, B. subtilis cells are incubated in LL-37 throughout the entire observation period, as would occur in an MIC assay. In the following “recovery” experiments, cells in the flow chamber are incubated at a given LL-37 concentration for a period of time, and then rinsed with fresh, aerated growth medium. Sytox Green is not present. Observation by phase contrast continues for 2-3 h, depending on the time scale of symptoms. This is analogous to a single-cell minimum bactericidal concentration (MBC) assay. The goal is to determine the extent to which cells whose growth has been altered by LL-37 can recover and grow normally after restoration of aerated s-EZRDM growth medium.
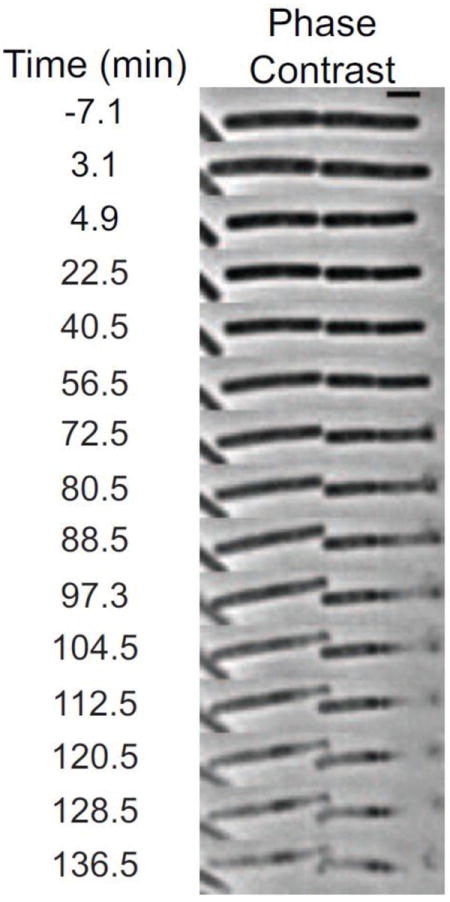
In Fig. 6A, we show a cell incubated in 2 μM LL-37 beginning at t = 0 and then rinsed thoroughly at t = 33 min and again at t = 58 min. The rinses cause defocusing of the phase contrast image and small jogs in the L(t) curve. As described in Section 3.1, LL-37 changes the curvature of L(t) (attenuates the growth rate) but does not entirely halt growth. Within ~20 min of rinsing with fresh growth medium, L(t) again turns upward for the cell shown in Fig 6A. As judged by the base-e time constant τ = 113 min, the cell has reestablished growth, albeit at a slower growth rate than if LL-37 had never been present. There is heterogeneity across cells in the recovery behavior at 2 μM LL-37. Some cells resume normal growth, as in Fig. 6A. Some cells abruptly shrink at longer time scales even though external LL-37 has been removed. Still other cells never resume growth during the observation period of 2-3 hr. Evidently an entire culture whose growth rate was attenuated by exposure to 2 μM LL-37 for ~30 min would readily recover after restoration of normal growth medium.
Figure 6.
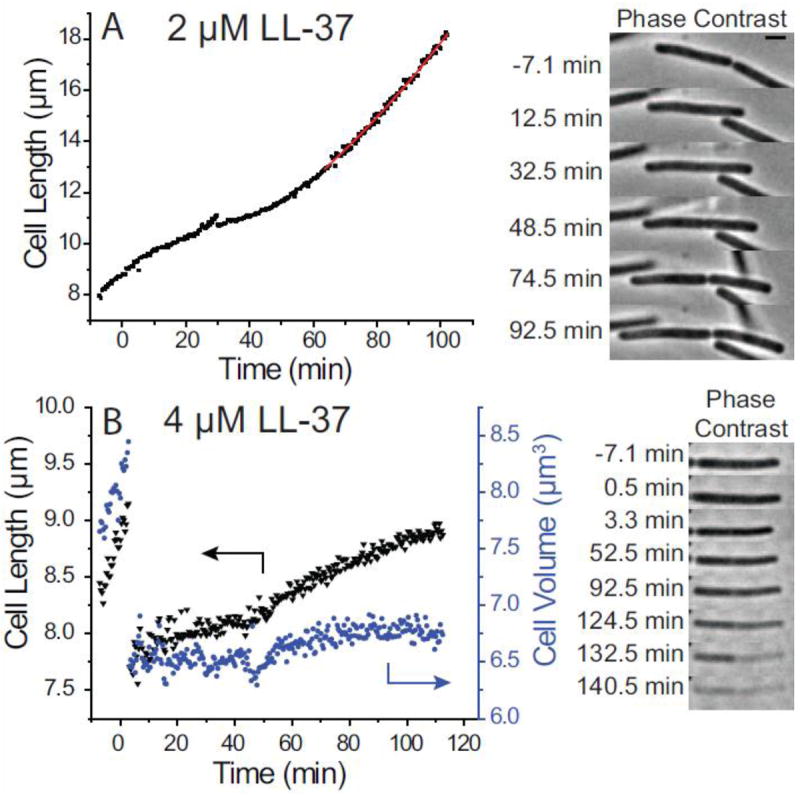
Recovery experiments at LL-37 concentrations of 2 μM (panel A) and 4 μM (panel B). Left: plots of cell length and volume vs time. Right: Phase contrast images vs time. For 2 μM LL-37, cells were rinsed first at 32.5 min and again at 57.5 min after injection. Growth resumes shortly after the initial rinse. For 4 μM LL-37, cells were rinsed first at 5.5 min and again at 12.5 min after injection. There is no clear evidence of growth, and at long times the cytoplasm loses phase contrast. Scale bar is 2 μm.
In contrast, Fig. 6B shows the recovery behavior of a cell initially incubated in 4 μM LL-37. In this experiment, all the observed cells suffered abrupt shrinkage events within 4 min of exposure to LL-37. The cells were rinsed with fresh, aerated growth medium at t = 6 min and again at t = 13 min. As occurred without rinsing (Fig. 5), the typical rinsed cell (Fig. 6B) gradually lengthens after the shrinkage event, but never regains its pre-shrink length. The volume curve, although noisy, shows no clear evidence of real growth. Following the rinses, and beginning at about 60 min, this particular cell gradually loses phase contrast, suggesting substantial loss of biopolymer content. Of the 12 cells studied by the recovery method at 4 μM LL-37, all but one lost phase contrast before reaching the pre-shrink maximum length. This is essentially the same behavior observed without rinsing. None of the observed cells had resumed normal growth by the end of the observation period of 2-3 hr. Evidently the damage inflicted on the cell by exposure to 4 μM for only 6 min is permanent and irreversible, in contrast to that imposed by 2 μM for 30 min.
4. Discussion
4.1 Comparison of LL-37 attack on E. coli and B. subtilis
The single-cell, real time assay reveals new layers of detail in the modes of attack of antimicrobial peptides on live bacterial cells. In earlier work, we studied the attack of LL-37 on the Gram-negative species E. coli. Rhodamine-labeled LL-37 (Rh-LL-37) at 8 μM (4 times the 12-h MIC of 2 μM) uniformly coats the cell outer membrane in less than 1 min. Cells that were already septating at t = 0 were subsequently attacked earlier than non-septating cells. After a lag time of about 10 min, Rh-LL-37 translocates across the outer membrane to enter the periplasm primarily at the septal region, which is evidently much more susceptible to translocation than mature outer membrane regions. Growth halts immediately thereafter, just before periplasmic GFP leaves the cell and long before permeabilization of the cytoplasmic membrane to Sytox Green. Below a threshold bulk Rh-LL-37 concentration of 4 μM (twice the MIC), the outer membrane was coated but growth did not halt. We speculated that the growth-halting mechanism involved interference with cell wall synthesis within the periplasm, perhaps due to binding of the highly cationic LL-37 to anionic components of the nascent peptidoglycan layer. Non-septating cells appeared to continue to grow until septum formation, at which time LL-37 penetrated the outer membrane and growth halted.
Here we extend the work to the Gram-positive species B. subtilis, which has only one membrane. We find no evidence for preferential attack on septating vs non-septating cells, although we are insensitive to cell cycle due to phase contrast microscopy’s limitations in visualizing septa in B. subtilis. For both Rh-LL-37 at 8 μM on E. coli and unlabeled LL-37 at 4 μM on B. subtilis (four times the MIC in both cases), we observe a several-minute time lag between injection of LL-37 and the halting of growth. In E. coli, the lag was dominated by slow translocation across the outer membrane to reach the periplasm. Bulk and surface-bound Rh-LL-37 rapidly establish an equilibrium [37]. At Rh-LL-37 bulk concentrations near the MIC, the surface concentration builds up quickly, but translocation and growth halting does not occur during a 60-min observation time. At 8 μM, the higher surface concentration led to translocation in septating cells, but only after a 10-min time lag. This is consistent with a cooperative model of translocation. It suggests that even when a critical surface concentration of Rh-LL-37 is present, multiple peptide molecules must come together and insert into the membrane, enabling facile translocation. Slow nucleation of this insertion step may explain the long time lag before translocation.
In the B. subtilis study we have avoided use of Rh-LL-37 because we did not observe the same set of symptoms as those induced by unlabeled LL-37. Rh-LL-37 did not cause the abrupt shrinkage step, even at concentrations as high as 24 μM. The abrupt, local membrane permeabilization step for B. subtilis at 4 μM of unlabeled LL-37 again exhibits characteristics consistent with a cooperative event [38] having a nucleation step as a bottleneck. Below a threshold bulk concentration, the membrane permeabilization step does not occur. At 4 μM and above, abrupt permeabilization always occurs, but only after a substantial time lag. The time lag might be due to slow adsorption of LL-37 into the peptidoglycan layer; without labels, we cannot discern the time scale of equilibration between bulk and surface LL-37. It may also be limited by slow diffusion of the highly positively charged LL-37 through the thick, negatively charged layer of mature peptidoglycan. Slow dissociation of helical bundles of LL-37 in the peptidoglycan layer may also contribute; these bundles are stable in salty solution and may also be stable in the hydrophilic environment of the peptidoglycan layer.
4.2 Growth Rate Suppression at Low LL-37 Concentration
At 2 μM of LL-37 on B. subtilis (twice the MIC), the concentration is evidently too low to induce permeabilization of the membrane. An alternative mechanism is observed (Fig. 1D-F). The growth rate, as measured by the slope of plots of cell length vs time, begins to decrease about 5 min after injection of LL-37. Cells grow more and more slowly over at least 50 min, and Sytox Green never enters the cytoplasm. One plausible cause of this behavior is direct interference with cell wall synthesis, analogous to the growth-halting mechanism proposed for E. coli. LL-37 presumably displaces the dipositive cations Mg2+ and Ca2+ within the peptidoglycan layer. A second possibility is transduction of a stress signal through the membrane [8], triggering a change in the transcription profile, and a decrease in the cell wall production rate. A third possibility involves a gradual decrease in the proton motive force across the bacterial membrane. This would lead to gradually decreasing intracellular levels of ATP, and a gradual decrease in growth rate. We tried to observe changes in internal pH at 2 μM LL-37 using the strain of B. subtilis expressing cytoplasmic GFP. Unfortunately, our assay is ineffective at measuring gradual changes in GFP intensity (and thus, internal pH), due to the competing effect of photobleaching. The cause of the gradual slowing of growth remains an open question.
4.3 Abrupt Shrinkage at High LL-37 Concentration
At 4 μM and 8 μM of LL-37, a lag time of a several minutes after injection is followed by abrupt shrinkage of all observed cells. LL-37 permeabilizes the membrane, which enables leakage of small molecules and ions from the cytoplasm to the surrounding medium. Much of the turgor pressure is lost. Sytox Green at 0.5-1 nM bulk concentration enters the cytoplasm and begins to stain the nucleoid less than 20 s after the shrinkage event. It takes about 5 minutes for the Sytox Green staining to reach its asymptotic value. Presumably a membrane permeable to Sytox Green is also permeable to protons, indicating that the cell membrane potential is abruptly lost as well. The phase contrast of the cytoplasm relative to the surrounding medium shows no obvious change immediately after shrinkage, indicating that much of the biopolymer content remains within the cytoplasm.
Cell length shrinks by about 15% on average, while the width shrinks by about 6%, implying an overall volume decrease of 25%. The turgor pressure is assumed to drop uniformly across the peptidoglycan. Thus, the change in aspect ratio on loss of turgor suggests that the normal turgor pressure stretches the peptidoglycan layer more easily along the long axis than circumferentially.
At 4 μM LL-37 the abrupt shrinkage event is followed by a gradual recovery of cell length. This recovery does not occur at 8 μM. In the E. coli study, we often observed a similar shrinkage and partial recovery of cell length [37]. At least in the case of B. subtilis, the gradual length recovery is not due to real cell growth. The cell never regains its pre-shrink length over 50 min of observation. Importantly, cell volume does not increase during this slow increase in length (Fig. 1I). In addition, the membrane potential evidently remains zero after the abrupt permeabilization event, preventing ATP synthesis and also disrupting many crucial metabolic pathways. The experiments using delayed addition of Sytox Green after shrinkage of the cells confirm that the membrane barrier function is not restored during the period of slow length recovery. The delayed loss of cytoplasmic GFP indicates that cell wall damage gradually becomes more severe over tens of minutes. We do not understand the restoring force driving the slow length recovery. It could be due to gradual remodeling of the peptidoglycan layer by autolysins, whose activity continues even after the membrane potential is abolished.
4.4 Pore Formation?
The observed localized permeabilization of the membrane revealed by the initially punctal Sytox Green staining at 4 μM LL-37 is consistent with the hypothesis of pore formation. Accordingly, recent structural studies on model lipid bilayers indicate that LL-37 indeed forms pores [14]. However, our assay provides no detailed information about the structure of the localized membrane disruption in B. subtilis. We only know that it is small, at most about 400 nm in breadth, because the earliest images of DNA staining are round with full width at half-maximum intensity of ~500 nm. Different studies suggested that LL-37 permeates model membranes by a “carpet” or “detergent-like” mechanism [12, 13]. The observed localized permeabilization events argue against this mechanism in real bacterial membranes.
The delayed loss of cytoplasmic GFP at t ~ 30 min (Fig. 4) and the even later loss of most cytoplasmic content at t ~ 1.5 h (Figs. 5 and 6B) indicates that LL-37 treatment slowly causes permeabilization of the membrane to larger and larger biomolecules, including ribosomes, over a period of several hours. This occurs both when the cells remain in contact with LL-37 and when the bulk LL-37 is rinsed away. The underlying mechanism of this slow membrane disruption is not clear. After the initial permeabilization event, the size limit on which cytoplasmic species are lost may be determined by the porosity of the peptidoglycan layer rather than the membrane itself. One possibility is that autolysins continue to degrade the peptidoglycan layer long after the onset of permeabilization and the halting of growth.
4.5 Recovery assay
Here we introduced a rudimentary “single-cell minimal bactericidal concentration” (MBC) assay by injecting LL-37, allowing it to act over a variable period of time, rinsing the plated cells to remove bulk LL-37, and then observing whether or not cells recover and resume normal growth. Although 2 μM exceeds the 6-h MIC, the slowing of growth on a 30-min time scale at this concentration is a “recoverable” symptom for many cells. When fresh growth medium is restored, some cells return to normal growth over a period of ~30 min. We suspect that fresh medium is able to remove much of the LL-37 from the peptidoglycan layer, i.e., that binding to the cell wall is reversible. Because the symptoms observed in our 1-h observation period are reversible, the data do not reveal the mechanism by which 2 μM LL-37 halts growth over 6 h in the MIC assay.
The recovery experiments at 4 μM rinsed away bulk LL-37 just minutes after the shrinkage events. No cells were observed to recover and grow normally on a time scale of 2-3 hr. It seems clear that the abrupt permeabilization event is sufficient to kill cells. The reason that permeabilization is not a recoverable symptom is less clear. Possibilities include irreversible loss of critical cytoplasmic components, irreparable damage to the cell wall by the action of autolysins, disruption of the membrane potential, or a combination of all of these effects.
Finally, we comment on the relationship between our 1-h, single-cell antimicrobial action assay and the time-honored minimum inhibitory concentration assay (MIC). The MIC is measured as the minimum antimicrobial concentration that inhibits growth over an extended time period, typically chosen as 6-12 h. For LL-37 on B. subtilis in EZRDM growth medium at 37°C, our measured 6-h MIC is 1 μM, accurate within a factor of two. On the time scale convenient for these microscopy experiments, about 1 h, we observe only minor effects of 1 μM LL-37 on cell growth (Fig. 3). Our studies focused on the concentration range 2-8 μM, well above the 6-h MIC, because these concentrations yield measureable effects on a 1-h time scale. The effects observed on the 1-h time scale are very different at 1 μM, μ2 M, and 4-8 μM. This suggests that for concentrations above the MIC, the dominant microscopic mechanism of anti-bacterial action may vary substantially with increasing antimicrobial concentration. However, we cannot be certain that the microscope sample chamber maintains the initial bulk LL-37 concentration over long periods. It remains possible that the growth rate suppression observed at 1-2 μM is the real behavior at constant bulk concentrations just below the MIC and that the abrupt shrinkage observed at 4-8 μM is the real behavior at constant bulk concentrations just above the MIC. In future work, recovery assays with much longer exposure times to LL-37 will be carried out in a microfluidic flow chamber to ensure constant bulk peptide concentration.
Supplementary Material
HIGHLIGHTS.
Time-lapse images of Bacillus subtilis were obtained during exposure to LL-37
Cells exposed to 2 μM LL-37 show growth rate attenuation but no membrane disruption
Cells exposed to 4 μM LL-37 abruptly shrink and exhibit membrane disruption
Nucleoid staining by Sytox Green suggests localized membrane disruption
Symptoms at 2 μM LL-37 are recoverable, while symptoms at 4 μM LL-37 are not
Abbreviations
- AMP
Antimicrobial Peptide
- GFP
Green Fluorescent Protein
- MIC
Minimum Inhibitory Concentration
- MBC
Minimum Bactericidal Concentration
- FWHM
Full-Width Half Maximum
Footnotes
Publisher's Disclaimer: This is a PDF file of an unedited manuscript that has been accepted for publication. As a service to our customers we are providing this early version of the manuscript. The manuscript will undergo copyediting, typesetting, and review of the resulting proof before it is published in its final citable form. Please note that during the production process errors may be discovered which could affect the content, and all legal disclaimers that apply to the journal pertain.
References
- 1.Brogden KA. Antimicrobial peptides: pore formers or metabolic inhibitors in bacteria? Nat Rev Microbiol. 2005;3:238–250. doi: 10.1038/nrmicro1098. [DOI] [PubMed] [Google Scholar]
- 2.Zasloff M. Antimicrobial peptides of multicellular organisms. Nature. 2002;415:389–395. doi: 10.1038/415389a. [DOI] [PubMed] [Google Scholar]
- 3.Wimley WC, Hristova K. Antimicrobial peptides: successes, challenges and unanswered questions. J Membr Biol. 2011;239:27–34. doi: 10.1007/s00232-011-9343-0. [DOI] [PMC free article] [PubMed] [Google Scholar]
- 4.Melo MN, Ferre R, Castanho MA. Antimicrobial peptides: linking partition, activity and high membrane-bound concentrations. Nat Rev Microbiol. 2009;7:245–250. doi: 10.1038/nrmicro2095. [DOI] [PubMed] [Google Scholar]
- 5.Andrews JM. Determination of minimum inhibitory concentrations. J Antimicrob Chemother. 2001;48(Suppl 1):5–16. doi: 10.1093/jac/48.suppl_1.5. [DOI] [PubMed] [Google Scholar]
- 6.Scocchi M, Tossi A, Gennaro R. Proline-rich antimicrobial peptides: converging to a non-lytic mechanism of action. Cell Mol Life Sci. 2011;68:2317–2330. doi: 10.1007/s00018-011-0721-7. [DOI] [PMC free article] [PubMed] [Google Scholar]
- 7.Schneider T, Kruse T, Wimmer R, Wiedemann I, Sass V, Pag U, Jansen A, Nielsen AK, Mygind PH, Raventos DS, Neve S, Ravn B, Bonvin AM, De Maria L, Andersen AS, Gammelgaard LK, Sahl HG, Kristensen HH. Plectasin, a fungal defensin, targets the bacterial cell wall precursor Lipid II. Science. 2010;328:1168–1172. doi: 10.1126/science.1185723. [DOI] [PubMed] [Google Scholar]
- 8.Pietiainen M, Gardemeister M, Mecklin M, Leskela S, Sarvas M, Kontinen VP. Cationic antimicrobial peptides elicit a complex stress response in Bacillus subtilis that involves ECF-type sigma factors and two-component signal transduction systems. Microbiology. 2005;151:1577–1592. doi: 10.1099/mic.0.27761-0. [DOI] [PubMed] [Google Scholar]
- 9.Huang HW, Chen FY, Lee MT. Molecular mechanism of Peptide-induced pores in membranes. Phys Rev Lett. 2004;92:198304. doi: 10.1103/PhysRevLett.92.198304. [DOI] [PubMed] [Google Scholar]
- 10.Epand RM, Epand RF. Bacterial membrane lipids in the action of antimicrobial agents. J Pept Sci. 2011;17:298–305. doi: 10.1002/psc.1319. [DOI] [PubMed] [Google Scholar]
- 11.Shai Y. Mode of action of membrane active antimicrobial peptides. Biopolymers. 2002;66:236–248. doi: 10.1002/bip.10260. [DOI] [PubMed] [Google Scholar]
- 12.Oren Z, Lerman JC, Gudmundsson GH, Agerberth B, Shai Y. Structure and organization of the human antimicrobial peptide LL-37 in phospholipid membranes: relevance to the molecular basis for its non-cell-selective activity. Biochem J. 1999;341(Pt 3):501–513. [PMC free article] [PubMed] [Google Scholar]
- 13.Porcelli F, Verardi R, Shi L, Henzler-Wildman KA, Ramamoorthy A, Veglia G. NMR structure of the cathelicidin-derived human antimicrobial peptide LL-37 in dodecylphosphocholine micelles. Biochemistry. 2008;47:5565–5572. doi: 10.1021/bi702036s. [DOI] [PMC free article] [PubMed] [Google Scholar]
- 14.Lee CC, Sun Y, Qian S, Huang HW. Transmembrane pores formed by human antimicrobial peptide LL-37. Biophys J. 2011;100:1688–1696. doi: 10.1016/j.bpj.2011.02.018. [DOI] [PMC free article] [PubMed] [Google Scholar]
- 15.Henzler Wildman KA, Lee DK, Ramamoorthy A. Mechanism of lipid bilayer disruption by the human antimicrobial peptide, LL-37. Biochemistry. 2003;42:6545–6558. doi: 10.1021/bi0273563. [DOI] [PubMed] [Google Scholar]
- 16.Sengupta D, Leontiadou H, Mark AE, Marrink SJ. Toroidal pores formed by antimicrobial peptides show significant disorder. Biochim Biophys Acta. 2008;1778:2308–2317. doi: 10.1016/j.bbamem.2008.06.007. [DOI] [PubMed] [Google Scholar]
- 17.Leontiadou H, Mark AE, Marrink SJ. Antimicrobial peptides in action. J Am Chem Soc. 2006;128:12156–12161. doi: 10.1021/ja062927q. [DOI] [PubMed] [Google Scholar]
- 18.Sochacki KA, Barns KJ, Bucki R, Weisshaar JC. Real-time attack on single Escherichia coli cells by the human antimicrobial peptide LL-37. Proc Natl Acad Sci U S A. 2011;108:E77–81. doi: 10.1073/pnas.1101130108. [DOI] [PMC free article] [PubMed] [Google Scholar]
- 19.Dunn AK, Handelsman J. A vector for promoter trapping in Bacillus cereus. Gene. 1999;226:297–305. doi: 10.1016/s0378-1119(98)00544-7. [DOI] [PubMed] [Google Scholar]
- 20.Harwood CR, Cutting SM. Molecular Biological Methods for Bacillus. John Wiley & Sons; 1990. [Google Scholar]
- 21.Nakano MM, Dailly YP, Zuber P, Clark DP. Characterization of anaerobic fermentative growth of Bacillus subtilis: identification of fermentation end products and genes required for growth. J Bacteriol. 1997;179:6749–6755. doi: 10.1128/jb.179.21.6749-6755.1997. [DOI] [PMC free article] [PubMed] [Google Scholar]
- 22.Rasband WS, editor. ImageJ. B. U.S. National Institutes of Health; Maryland, USA: 1997. http://rsb.info.nih.gov/ij/ [Google Scholar]
- 23.Sliusarenko O, Heinritz J, Emonet T, Jacobs-Wagner C. High-throughput, subpixel precision analysis of bacterial morphogenesis and intracellular spatio-temporal dynamics. Mol Microbiol. 2011;80:612–627. doi: 10.1111/j.1365-2958.2011.07579.x. [DOI] [PMC free article] [PubMed] [Google Scholar]
- 24.Roth BL, Poot M, Yue ST, Millard PJ. Bacterial viability and antibiotic susceptibility testing with SYTOX green nucleic acid stain. Appl Environ Microbiol. 1997;63:2421–2431. doi: 10.1128/aem.63.6.2421-2431.1997. [DOI] [PMC free article] [PubMed] [Google Scholar]
- 25.Briandet R, Lacroix-Gueu P, Renault M, Lecart S, Meylheuc T, Bidnenko E, Steenkeste K, Bellon-Fontaine MN, Fontaine-Aupart MP. Fluorescence correlation spectroscopy to study diffusion and reaction of bacteriophages inside biofilms. Appl Environ Microbiol. 2008;74:2135–2143. doi: 10.1128/AEM.02304-07. [DOI] [PMC free article] [PubMed] [Google Scholar]
- 26.Elowitz MB, Surette MG, Wolf PE, Stock JB, Leibler S. Protein mobility in the cytoplasm of Escherichia coli. J Bacteriol. 1999;181:197–203. doi: 10.1128/jb.181.1.197-203.1999. [DOI] [PMC free article] [PubMed] [Google Scholar]
- 27.Konopka MC, Shkel IA, Cayley S, Record MT, Weisshaar JC. Crowding and confinement effects on protein diffusion in vivo. J Bacteriol. 2006;188:6115–6123. doi: 10.1128/JB.01982-05. [DOI] [PMC free article] [PubMed] [Google Scholar]
- 28.Martinez KA, 2nd, Kitko RD, Mershon JP, Adcox HE, Malek KA, Berkmen MB, Slonczewski JL. Cytoplasmic pH response to acid stress in individual cells of Escherichia coli and Bacillus subtilis observed by fluorescence ratio imaging microscopy. Appl Environ Microbiol. 2012;78:3706–3714. doi: 10.1128/AEM.00354-12. [DOI] [PMC free article] [PubMed] [Google Scholar]
- 29.Breeuwer P, Drocourt J, Rombouts FM, Abee T. A Novel Method for Continuous Determination of the Intracellular pH in Bacteria with the Internally Conjugated Fluorescent Probe 5 (and 6-)- Carboxyfluorescein Succinimidyl Ester. Appl Environ Microbiol. 1996;62:178–183. doi: 10.1128/aem.62.1.178-183.1996. [DOI] [PMC free article] [PubMed] [Google Scholar]
- 30.Kitko RD, Cleeton RL, Armentrout EI, Lee GE, Noguchi K, Berkmen MB, Jones BD, Slonczewski JL. Cytoplasmic acidification and the benzoate transcriptome in Bacillus subtilis. PLoS One. 2009;4:e8255. doi: 10.1371/journal.pone.0008255. [DOI] [PMC free article] [PubMed] [Google Scholar]
- 31.Henderson PJ, McGivan JD, Chappell JB. The action of certain antibiotics on mitochondrial, erythrocyte and artificial phospholipid membranes. The role of induced proton permeability. Biochem J. 1969;111:521–535. doi: 10.1042/bj1110521. [DOI] [PMC free article] [PubMed] [Google Scholar]
- 32.Lamsa A, Liu WT, Dorrestein PC, Pogliano K. The Bacillus subtilis cannibalism toxin SDP collapses the proton motive force and induces autolysis. Mol Microbiol. 2012;84:486–500. doi: 10.1111/j.1365-2958.2012.08038.x. [DOI] [PMC free article] [PubMed] [Google Scholar]
- 33.Schuwirth BS, Borovinskaya MA, Hau CW, Zhang W, Vila-Sanjurjo A, Holton JM, Cate JH. Structures of the bacterial ribosome at 3.5 A resolution. Science. 2005;310:827–834. doi: 10.1126/science.1117230. [DOI] [PubMed] [Google Scholar]
- 34.Demchick P, Koch AL. The permeability of the wall fabric of Escherichia coli and Bacillus subtilis. J Bacteriol. 1996;178:768–773. doi: 10.1128/jb.178.3.768-773.1996. [DOI] [PMC free article] [PubMed] [Google Scholar]
- 35.Smith TJ, Blackman SA, Foster SJ. Autolysins of Bacillus subtilis: multiple enzymes with multiple functions. Microbiology. 2000;146(Pt 2):249–262. doi: 10.1099/00221287-146-2-249. [DOI] [PubMed] [Google Scholar]
- 36.Vollmer W, Joris B, Charlier P, Foster S. Bacterial peptidoglycan (murein) hydrolases. FEMS Microbiol Rev. 2008;32:259–286. doi: 10.1111/j.1574-6976.2007.00099.x. [DOI] [PubMed] [Google Scholar]
- 37.Sochacki KA. Chemistry, vol PhD. University of Wisconsin-Madison; Madison, WI: 2011. [Google Scholar]
- 38.Huang HW. Molecular mechanism of antimicrobial peptides: the origin of cooperativity. Biochim Biophys Acta. 2006;1758:1292–1302. doi: 10.1016/j.bbamem.2006.02.001. [DOI] [PubMed] [Google Scholar]
Associated Data
This section collects any data citations, data availability statements, or supplementary materials included in this article.