

Abstract
Purpose
To evaluate the effects of radiation therapy on primary tumor vasculature using dual energy (DE) micro-computed tomography (micro-CT).
Methods and Materials
The Cre-loxP system was used to generate primary sarcomas with mutant Kras and p53. Unirradiated tumors were compared to tumors irradiated with 20 Gy. A long-circulating PEGylated liposomal-iodinated contrast agent was administered one day after treatment, and mice were imaged immediately after injection (day 1) and three days later (day 4) using DE micro-CT. CT-derived tumor sizes were used to assess tumor growth. After DE decomposition, iodine maps were used to assess tumor fractional blood volume (FBV) at day 1 and tumor vascular permeability at day 4. For comparison, tumor vascularity and vascular permeability were also evaluated histologically using CD31 immunofluorescence and fluorescently-labeled dextrans.
Results
Radiation treatment significantly decreased tumor growth (P<0.05). There was a positive correlation between CT-measurement of tumor FBV and extravasated iodine with microvascular density (MVD) (R2=0.53) and dextran accumulation (R2=0.63), respectively. Despite no change in MVD measured by histology, tumor FBV significantly increased after irradiation as measured by DE micro-CT (0.070 vs. 0.091, P<0.05). Both dextran and liposomal-iodine accumulation in tumors increased significantly after irradiation with dextran fractional area increasing 4.2-fold and liposomal-iodine concentration increasing 3.0-fold.
Conclusions
DE micro-CT is an effective tool for non-invasive assessment of vascular changes in primary tumors. Tumor blood volume and vascular permeability increased after a single therapeutic dose of radiation treatment.
INTRODUCTION
Approximately 50% of all human tumors are treated with radiation therapy, and single dose or hypofractionated radiation is becoming more common in the clinic (1). While it is generally accepted that radiation therapy cures tumors by killing tumor clonogens (2), accumulating evidence suggests that the tumor stroma may also dictate tumor response to radiation therapy (3). For example, tumor hypoxia mediated by decreased blood flow can decrease the effectiveness of radiation therapy (4). Stable vasculature is necessary to maintain perfusion and cancer cell oxygenation throughout the course of treatment, but may also support the survival and growth of cancer cell clonogens (5). While a number of studies have investigated alterations in tumor perfusion following radiation therapy, few have measured vascular permeability post-irradiation (5–7). Moreover, all of these pre-clinical studies have utilized xenograft or syngeneic model systems that may not adequately reflect the vasculature of primary tumors. Using conditional mutations in Kras and Trp53, a primary mouse model of soft-tissue sarcoma was previously established (8). Understanding the effects of radiation treatment on tumors requires appropriate methods for quantitative assessment.
Non-invasive functional imaging methods that assess tumor perfusion and vascular permeability provide particularly appealing approaches to develop cancer biomarkers. In clinical trials, dynamic contrast-enhanced (DCE)-CT and DCE-MRI correlated well with histological parameters of tumor angiogenesis such as MVD or expression of angiogenic markers (9). The clinical availability of dual-energy computed tomography imaging enables quantitative functional imaging in oncology. The linear correlation between signal intensity and iodine concentration, and the ability to perform spectral CT, has enabled more accurate methods for assessing the functional status of tumor vasculature. The development of low-dose radiation techniques combined with advanced image-processing algorithms and rapid image acquisition is further driving the clinical use of this technique. While such methods are gaining momentum in the clinic, they are largely absent in the pre-clinical domain. However, such non-invasive and quantitative imaging techniques would improve our understanding of the mechanisms and efficacy of novel cancer drugs and therapies tested in animal models of cancer. A pre-clinical dual source micro-CT system was previously built (10) that enables not only faster dynamic imaging but also allows DE micro-CT studies (11). This study represents our first application of DE micro-CT to assess effects of radiation treatment in soft tissue sarcomas.
In this study, we investigated changes in tumor perfusion and vascular permeability in primary sarcomas after a single high dose radiation therapy using DE micro-CT and a nanoparticle contrast agent. Our results indicate that this imaging technique will be useful to study the role of the vasculature in mediating tumor response to radiation therapy.
METHODS AND MATERIALS
Fabrication of liposomal CT contrast agent
Liposomal-iodinated CT contrast agent was prepared using methods described previously (12). The size distribution of liposomes in the final formulation was determined by dynamic light scattering (DLS) using a Malvern Zetasizer Nanoseries (Malvern Instruments, Worcestershire, UK) at 25 °C. The iodine concentration in the final liposomal solution was quantified by spectrophotometry (Abs at 245 nm). The final iodine concentration in the PEGylated liposomal-iodine formulation was 110 mg/mL. The average liposome size was 140 nm and the poly-dispersity index was less than 0.15.
Animal model and radiation treatment
All animal studies were performed in accordance with the Institutional Animal Care and Use Committee-approved protocols. Sarcomas were generated in LSL-KrasG12D; p53FL/FL compound mutant mice as described previously (8). Many of the mice contained conditional alleles for Bax or ATM, so that ATM or Bax levels in the tumor parenchymal cells varied between mice. Because Cre is not expressed in the tumor vasculature of these mice, all of the mice in this study had wild-type vasculature. Therefore, the vascular response to radiation has been combined across genotypes. When tumors reached ~250 mm3 by caliper measurement, sarcomas were irradiated with 20 Gy delivered in parallel-opposed anterior and posterior fields using the X-RAD 225Cx small animal image guided irradiator (Precision X-Ray, Inc.). The sarcoma was localized to isocenter (source to subject distance was 30.76 cm) via fluoroscopy at 40 kVp, 2.5 mA with a 2 mm Al filter. Irradiation was performed using a collimating cone to produce a 15 mm diameter circular radiation field at the treatment isocenter with an average dose rate of 300 cGy/min with a 225 kVp, 13 mA beam and a 0.3 mm Cu filter. A total of twelve mice were used for the study with animals equally divided into control and treated groups.
DE micro-CT setup and imaging
The treated group of mice was irradiated on day 0. DE micro-CT scanning was performed at day 1 and day 4. Mice were intravenously injected with liposomal-iodinated contrast agent (dose 0.4 ml/25 g mouse) on day 1, just prior to imaging. The free-breathing animals were scanned while under anesthesia induced with 1% isoflurane delivered by nose-cone. All scans were performed on the custom-built dual source micro-CT system (10) using 40 kVp, 250mA, and 16 ms per exposure for one X-ray source and 80 kVp, 160mA, and 10 ms for the second X-ray source. Both x-ray tubes were triggered simultaneously. Each acquisition consisted of 360 projections per x-ray source/detector. A single scan required approximately 5 minutes to complete. CT reconstructions were performed with the Feldkamp algorithm (13) and resulted in reconstructed 40 and 80 kVp volumes with isotropic, 88 microns voxels. The estimated cumulative radiation dose associated with our longitudinal in vivo studies was 0.26 Gy.
Image post-processing
Affine registration was performed to improve registration between corresponding 40 and 80 kVp reconstructed volumes using ANTs, an open-source, ITK-based registration toolkit (Advanced Normalization Tools, http://picsl.upenn.edu/ANTS/; ITK rev. 4.0.0). Affine registration in ANTs optimized mutual information (14). Registration between each pair of 40 and 80 kVp data generally completed in less than two minutes using a Mac OS X workstation with dual 2.66 GHz, quad-core Xeon processors and 16 GB of RAM.
To ultimately improve the results of DE decomposition, each data set was de-noised using bilateral filtration (BF). BF is a well-characterized edge-preserving smoothing filter that considers both the distribution of neighboring voxels in space and intensity. BF was implemented using MATLAB (MathWorks, Natick, MA), and generally was completed within 15–20 minutes per volume using the computer system previously listed. Details of the application of (“classic”) BF to murine CT data can be found in Sawall et al. 2011 (15) and in Clark et al. 2012 (16). A quantitative evaluation of the application of BF to DE micro-CT data can be found in Badea et al. 2012 (11).
DE decomposition of CT images
Since tumors were placed on a hind limb containing bones, a DE decomposition of calcium and iodine was performed after registration and filtration, using corresponding 80 and 40 kVp data by solving the following linear system at each voxel:
Expanding the linear system:
In this formulation, x was the least squares solution for the concentration of the iodine (CI) and calcium (CCa) in mg/mL in the voxel under consideration. A was a constant sensitivity matrix measured in HU/mg/mL for iodine (CTI,40, CTI,80) and calcium (CTCa,40, CTCa,80) at 40 and 80 kVp, respectively. Finally, b was the intensity of the voxel under consideration at 40 kVp (CT40) and 80 kVp (CT80) in Hounsfield Units (HU).
Values for CTI,40, CTI,80, CTCa,40, and CTCa,80 were determined empirically using a calibration phantom and were 31.52, 44.61, 25.61, and 19.13 HU/mg/mL, respectively. Voxels with negative concentrations of both materials were set to zero.
To isolate the tumors for analysis after DE decomposition, masks were manually defined for each 40 and 80 kVp set using Avizo (Visualization Sciences Group, Burlington, MA). The masks separated the tumors from surrounding muscle and bone, enabling measurements of tumor volume.
Analysis
After masking the results of the DE decomposition to isolate the tumor volume, several metrics were computed using the iodine concentration map as a basis to compare the treated and untreated tumors. FBV characterized the degree of tumor vascularity. Due to the long circulating nature of the liposomal contrast agent (t1/2 ~40 hours) (12), the signal enhancement obtained immediately after injection of the liposomal contrast agent is truly proportional to the tumor FBV. Assessment of FBV was done one day after radiation treatment for the treated group and on the corresponding day for the untreated, control group. To compensate for the apparent iodine concentration of muscle in the decomposed data (CI,Muscle, empirically determined to be 2.24 mg/mL), a hard threshold was applied to CI,n, yielding C′I,n.
FBV was next computed as:
where N1 was the total number of tumor voxels on day 1, MAXI,1 was the iodine concentration within the blood (measured per animal in the lumen of descending aorta), and where C′I,n was the iodine concentration in tumor voxel n (mg/mL).
To assess changes in vascular permeability, we computed the accumulated mass of iodine in tumors. The accumulated mass at day 4 (AM4, measured in mg) characterized the mass of extravasated iodine in each tumor four days after the date of radiation treatment:
where v was the voxel volume and where CI,n was the iodine concentration in tumor voxel n (mg/mL) on day 4. Because the iodine extravasated from the vasculature to the surrounding tissue, CI,Muscle was subtracted from each CI,n value, with negative values set to zero before summation. Due to the long blood half-life of the liposomal contrast agent, residual blood pool signal was observed on day 4. To remove this residual blood pool enhancement, a corrected, accumulated mass (CAM4) was computed:
The correction term subtracted from AM4 assumed that the FBV measured on day 1 was roughly equivalent to the FBV on day 4. TV4 was the tumor volume, and MAXI,4 was the iodine concentration in the blood pool at day 4 measured using C′I,n for each animal. Normalizing the corrected, accumulated mass for each tumor by the volume of that tumor at day 4 yielded an average accumulated concentration (AC4) which was used to compare treated and untreated tumors:
Histological analysis
Eight of the 12 mice (four from each group) were also injected intravenously with 1 mg lysine-fixable TMR-conjugated 2 × 10⁶ Da dextrans (Invitrogen) at the time of liposomal-iodine injection. After scanning on day 4, mice were euthanized and the sarcoma and contralateral gastrocnemius were collected and snap frozen. Tissue specimens were embedded directly in OCT compound (Sakura Finetek) and stored at −80°C. Ten μm sections were stained with rat anti-mouse CD31 IgG (BD Pharmingen) diluted 1:250 in 10% donkey serum at room temperature for 2 hours. After washing with PBS, sections were incubated with Alexa Fluor 488-conjugated donkey anti-rat IgG (Invitrogen) diluted 1:500 in donkey serum for 1 hour at room temperature. Six images (200x) per slide were randomly taken from a central section of each sarcoma and three images (200x) were taken of normal muscle. CD31 and dextran fractional areas were quantified using ImageJ (NIH). In order to account for variation in dextran injection and mouse weight, fractional area of dextran in tumor was normalized to fractional area of dextran in normal muscle.
Statistics
Results were presented as means and standard errors. Two-tailed Student’s t tests were performed to compare the means of two groups. Correlations between histological and micro-CT findings were calculated by linear regression. Statistical analysis was performed using Prism 5 (GraphPad). A P-value less than 0.05 was considered statistically significant.
RESULTS
Tumor imaging and radiation
The average tumor volume (Fig. 1A) was larger in unirradiated tumors on day 1 (1.826 vs. 1.187 cm3), but this was not statistically significant (P=0.23). The irradiated tumors grew significantly less (Fig. 1A), growing 0.067 cm3 on average from day 1 to day 4 compared to 0.558 cm3 for unirradiated tumors (P<0.05). DE micro-CT enabled the separation and quantification of iodine concentration within the tumors at day 1 and day 4 (Fig. 1C). Maximum intensity projections (MIPs) over the whole tumor illustrated increased accumulation of iodine at day 4 in treated tumors compared to unirradiated tumors.
Figure 1.
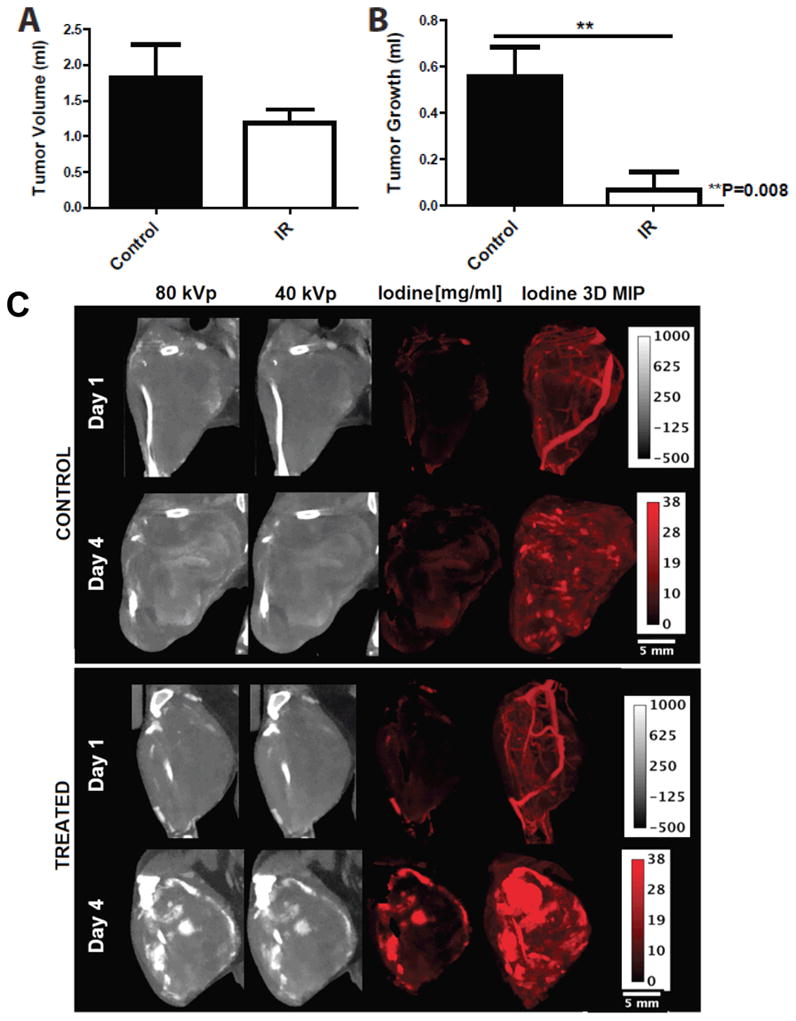
Comparison of sarcomas in mice treated with 20 Gy (IR) and untreated controls (Control). A) CT-derived tumor volumes on day 1 of imaging. B) Tumor growth from day 1 to day 4 measured by micro-CT. *P<0.05 by Student’s t test. C) 40 and 80 kVp data at day 1 and day 4. DE micro-CT allows separation and quantification of the iodine concentration (red maps, measured in mg/ml). MIPs over the whole tumor show vascular architecture at day 1 and illustrate increased accumulation of iodine at day 4 in the treated group.
Tumor vascularity after radiation
The MVD measured histologically by CD31 staining was not significantly different between the treated and control tumors (Fig. 2A). FBV measured by DE micro-CT on day 1 was significantly higher in irradiated tumors (FBV = 0.091) compared to control tumors (FBV = 0.070) (Fig. 2B). Linear regression demonstrated a positive correlation between FBV measured on day 1 by DE micro-CT and MVD measured on day 4 (R2=0.53) (Fig. 2C).
Figure 2.

Histological and DE micro-CT analysis of tumor vascularity for unirradiated sarcomas (Control) and sarcomas treated with 20 Gy (IR). A) Average MVD measured by CD31 fractional area at day 4 post-irradiation. B) FBV measured by DE micro-CT at day 1 post-irradiation. *P<0.05 by Student’s t test. C) Correlation by linear regression of DE micro-CT measured FBV and MVD measured by histology (R2=0.53). For all graphs, n=6 per group.
Tumor vascular permeability after radiation
Irradiated sarcomas had more dextran accumulation than unirradiated tumors (7.257 vs. 1.393, P<0.05) (Fig. 3A and B). Similar to the fluorescently-labeled dextrans, iodine accumulation measured at day 4 was significantly greater in treated tumors (Fig. 3C). After accounting for residual blood pool enhancement, radiation treatment increased the average accumulated iodine concentration in tumors from 0.634 to 2.521 mg/mL (P<0.05). Linear regression demonstrated a positive correlation between averaged accumulated iodine concentration measured by DE micro-CT and dextran accumulation (R2=0.63) (Fig. 3D).
Figure 3.
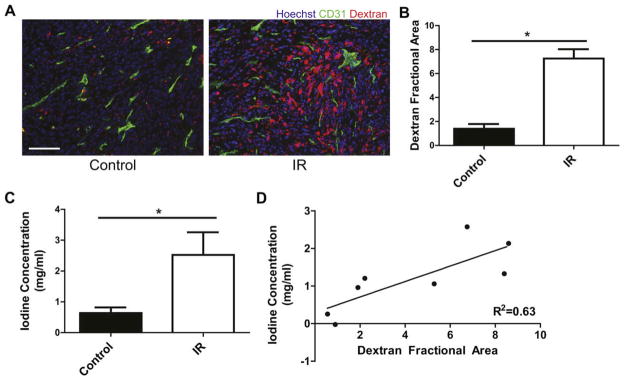
Histological and DE micro-CT analysis of tumor vascular permeability for unirradiated sarcomas (Control) and sarcomas treated with 20 Gy (IR). A) Representative fluorescence images from CD31 (green) and Hoechst 33324 (blue) stained frozen sections of unirradiated and irradiated sarcomas from mice injected with TMR-conjugated dextran (red) on day 1 and euthanized on day 4. Scale bar=100 μm. B) Sarcoma average dextran fractional area normalized to average dextran fractional area of normal muscle in the contralateral leg. *P<0.05 by Student’s t test, n=4 per group. C) Accumulated concentration of iodine corrected for residual blood pool enhancement measured by DE micro-CT for sarcomas injected with liposomal-iodine on day 1 and imaged on day 4 post-irradiation. *P<0.05 by Student’s t test, n=6 per group. D) Correlation by linear regression of dextran accumulation measured by histology and iodine accumulation measured by DE micro-CT (R2=0.63).
DISCUSSION
Numerous studies have investigated changes in tumor blood volume and perfusion following radiation therapy using xenograft and syngeneic models (5). Changes in blood flow and vascular volume varied from study to study, but the majority of the studies observed either no change or an increase in blood flow shortly after radiation (17–19). In our study, FBV of primary sarcomas significantly increased one day after radiation therapy. While we observed an increased FBV measured by DE micro-CT, there was not a significant change in MVD as determined using CD31 staining. CD31 staining identifies the presence of blood vessels, but it does not assess vascular function. In addition, CD31 staining was performed on frozen sections that were collected four days after radiation treatment, whereas FBV analysis was performed on day 1 which may explain the difference between these two measured values. Furthermore, FBV measurements are performed on the entire tumor whereas MVD measurements are performed on random but limited 2D sections. Despite this limitation, a positive correlation was shown between MVD and FBV measured by DE micro-CT.
Vascular permeability following radiation has previously not been evaluated as thoroughly as tumor blood volume. Using contrast-enhanced MRI, Schwickert et al. observed increased capillary permeability one day after radiation treatment (15 Gy) in a rat model of mammary adenocarcinoma (7). More recently, Giustini et al. demonstrated a two-fold increase in the tumor accumulation of nanoparticles following irradiation with 15 Gy, which they attributed to an increase in vascular permeability (6). In our study, dextran accumulation increased 4.2-fold following radiation and correlated well with accumulation of liposomal-iodine measured by DE micro-CT, which increased 3.0-fold. Note that the liposomes (~140 nm) are ~60 times larger than the dextrans (2×10⁶ Da), which may explain the difference in accumulation. Nonetheless, the increased dextran and accumulation of liposomal-iodinated nanoparticles observed in this study demonstrates that vascular permeability increases one day after irradiation of primary tumors. This period of increased permeability might be utilized to increase delivery of anti-cancer drugs.
A possible limitation of our DE-micro-CT method is the assumption of equal FBV at day 1 and day 4. However, this represents the only way to separate CT enhancements due to residual blood pool and extravasation when a single type of contrast material is used. A solution could be to use gold and iodinated nanoparticles to simultaneously visualize and compute FBV and permeability with DE-micro-CT (20).
CT is a fast, quantitative, and high-resolution volumetric imaging technique. However, high resolution demands scan times on the order of a few minutes for micro-CT, resulting in a need for contrast agents with long blood half-lives such as our liposomal-based contrast agent. DE micro-CT allows better separation of potential equally enhancing regions of bone and vessels than single energy micro-CT, and it provides quantification of iodine concentrations. Furthermore, DE micro-CT can measure FBV and permeability without pre-contrast scans and there is no penalty in sampling time by acquiring two sets simultaneously. The use of ionizing radiation has the potential to affect the tumor. However, the cumulative imaging dose of 0.26 Gy represents only 1.3% of the treatment dose (20 Gy). Therefore, it is unlikely to affect the results of this study.
In conclusion, we have shown that DE micro-CT is a powerful tool for monitoring vascular changes after radiation therapy. We have used this technology to demonstrate an increase in tumor FBV and vascular permeability one day following irradiation in a primary mouse model of soft tissue sarcoma. This model system will be useful for longitudinal studies investigating the response of tumor vasculature to radiation therapy.
Acknowledgments
All in vivo imaging work was performed at the Duke Center for In Vivo Microscopy, an NIH/NCRR/NIBIB national Biomedical Technology Research Center (P41 EB015897), with additional support from NCI (P30 CA14236).
Footnotes
CONFLICTS OF INTEREST NOTIFICATION
KG is a consultant for Marval Biosciences and holds stock options. The remaining authors declare that they do not have any competing or financial interests.
References
- 1.Lo SS, Fakiris AJ, Chang EL, et al. Stereotactic body radiation therapy: a novel treatment modality. Nat Rev Clin Oncol. 2010;7:44–54. doi: 10.1038/nrclinonc.2009.188. [DOI] [PubMed] [Google Scholar]
- 2.Koch U, Krause M, Baumann M. Cancer stem cells at the crossroads of current cancer therapy failures--radiation oncology perspective. Semin Cancer Biol. 2010;20:116–124. doi: 10.1016/j.semcancer.2010.02.003. [DOI] [PubMed] [Google Scholar]
- 3.Begg AC, Stewart FA, Vens C. Strategies to improve radiotherapy with targeted drugs. Nat Rev Cancer. 2011;11:239–253. doi: 10.1038/nrc3007. [DOI] [PubMed] [Google Scholar]
- 4.Dewhirst MW, Cao Y, Moeller B. Cycling hypoxia and free radicals regulate angiogenesis and radiotherapy response. Nat Rev Cancer. 2008;8:425–437. doi: 10.1038/nrc2397. [DOI] [PMC free article] [PubMed] [Google Scholar]
- 5.Kozin S, Duda D, Munn L, et al. Neovascularization After Irradiation: What is the Source of Newly Formed Vessels in Recurring Tumors? Journal of the National Cancer Institute. 2012 doi: 10.1093/jnci/djs239. [DOI] [PMC free article] [PubMed] [Google Scholar]
- 6.Giustini AJ, Petryk AA, Hoopes PJ. Ionizing radiation increases systemic nanoparticle tumor accumulation. Nanomedicine. 2012 doi: 10.1016/j.nano.2012.05.001. [DOI] [PMC free article] [PubMed] [Google Scholar]
- 7.Schwickert HC, Stiskal M, Roberts TP, et al. Contrast-enhanced MR imaging assessment of tumor capillary permeability: effect of irradiation on delivery of chemotherapy. Radiology. 1996;198:893–898. doi: 10.1148/radiology.198.3.8628889. [DOI] [PubMed] [Google Scholar]
- 8.Kirsch DG, Dinulescu DM, Miller JB, et al. A spatially and temporally restricted mouse model of soft tissue sarcoma. Nat Med. 2007;13:992–997. doi: 10.1038/nm1602. [DOI] [PubMed] [Google Scholar]
- 9.Goh V, Padhani A. Imaging tumor angiogenesis: functional assessment using MDCT or MRI? Abdominal imaging. 2006;31:194–203. doi: 10.1007/s00261-005-0387-4. [DOI] [PubMed] [Google Scholar]
- 10.Badea C, Johnston S, Johnson B, et al. A dual micro-CT system for small animal imaging. Proceedings of SPIE. 2008;6913:691342. doi: 10.1117/12.772303. [DOI] [PMC free article] [PubMed] [Google Scholar]
- 11.Badea CT, Guo X, Clark D, et al. Dual-energy micro-CT of the rodent lung. Am J Physiol Lung Cell Mol Physiol. 2012;302:L1088–1097. doi: 10.1152/ajplung.00359.2011. [DOI] [PMC free article] [PubMed] [Google Scholar]
- 12.Ghaghada K, Badea C, Karumbaiah L, et al. Evaluation of tumor microenvironment in an animal model using a nanoparticle contrast agent in computed tomography imaging. Academic radiology. 2011;18:20–50. doi: 10.1016/j.acra.2010.09.003. [DOI] [PMC free article] [PubMed] [Google Scholar]
- 13.Feldkamp LA, Davis LC, Kress JW. Practical cone-beam algorithm. J Opt Soc Am. 1984;1:612–619. [Google Scholar]
- 14.Hermosillo G, Chefd’Hotel C, Faugeras O. Variational methods for multimodal image matching. International Journal of Computer Vision. 2002;50:329–343. [Google Scholar]
- 15.Sawall S, Bergner F, Lapp R, et al. Low-dose cardio-respiratory phase-correlated cone-beam micro-CT of small animals. Med Phys. 2011;38:1416–1424. doi: 10.1118/1.3551993. [DOI] [PubMed] [Google Scholar]
- 16.Clark D, Johnson GA, Badea CT. Denoising of 4D Cardiac Micro-CT Data Using Median-Centric Bilateral Filtration. Proc SPIE. 2012:8314–142. doi: 10.1117/12.911478. [DOI] [PMC free article] [PubMed] [Google Scholar]
- 17.Tozer GM, Bhujwalla ZM, Griffiths JR, et al. Phosphorus-31 magnetic resonance spectroscopy and blood perfusion of the RIF-1 tumor following X-irradiation. Int J Radiat Oncol Biol Phys. 1989;16:155–164. doi: 10.1016/0360-3016(89)90023-0. [DOI] [PubMed] [Google Scholar]
- 18.Tozer GM, Myers R, Cunningham VJ. Radiation-induced modification of blood flow distribution in a rat fibrosarcoma. Int J Radiat Biol. 1991;60:327–334. doi: 10.1080/09553009114552081. [DOI] [PubMed] [Google Scholar]
- 19.Spence AM, Graham MM, Abbott GL, et al. Blood flow changes following 137Cs irradiation in a rat glioma model. Radiat Res. 1988;115:586–594. [PubMed] [Google Scholar]
- 20.Badea CT, Johnston SM, Qi Y, et al. Dual-energy micro-CT imaging for differentiation of iodine- and gold-based nanoparticles. Proceedings of the SPIE. 2011;7961:79611X. [Google Scholar]