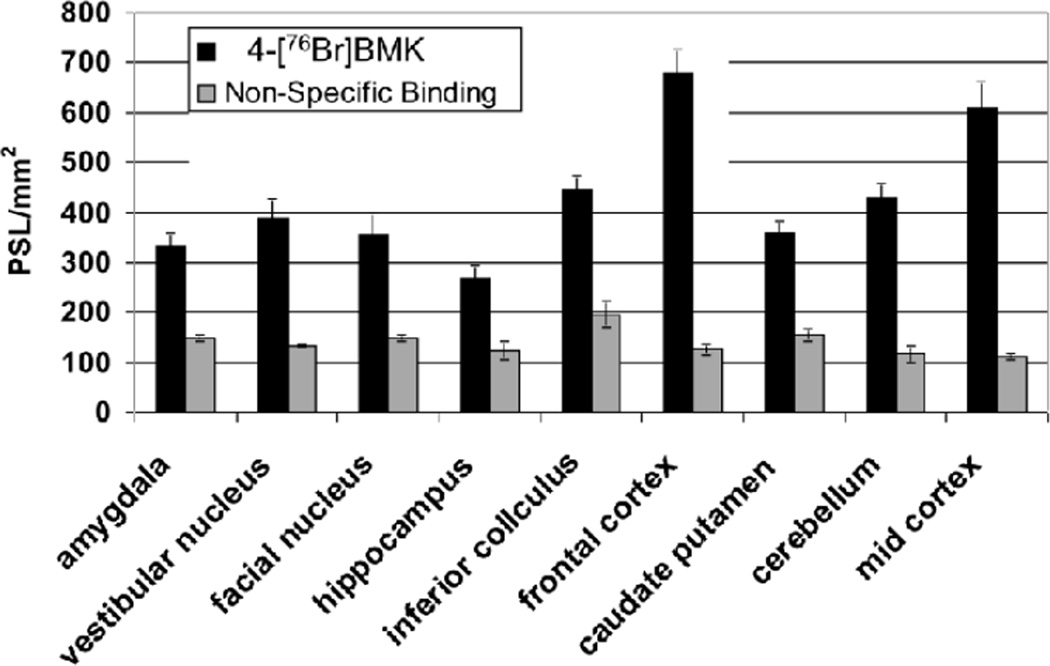
Fig. 4.
Quantitative regional distribution of 4-[76Br]BMK in rat brain determined by in vitro autoradiography which corresponds to CRF1 receptor binding. The quanitative data was obtained by drawing ROI’s expressed as photostimulated luminescence units per mm2 (PSL/mm2). Non-specific binding determined using 4-BMK (10−5M) and quantitated in the same manner (Each bar represents the mean ± SD; n=3).

