

Abstract
BACKGROUND
We examined the association between 799 single-nucleotide polymorphisms in 39 sex hormone genes and blood pressure (BP) responses to a dietary-sodium intervention.
METHODS
A 7-day low-sodium feeding study (51.3 mmol sodium/day) followed by a 7-day high-sodium feeding study (307.8 mmol sodium/day) was conducted among 1,906 Han Chinese participants. Nine BP measurements were obtained at baseline and the end of each intervention period using a random-zero sphygmomanometer.
RESULTS
Among men, absolute BP responses to sodium interventions decreased with the number of minor alleles of estrogen receptor 1 (ESR1) markers rs9340844, rs9397453, rs9371562, rs9397459, and rs9383951. For example, mean diastolic blood pressure (DBP) responses to low-sodium intervention (95% confidence interval) were –2.67 (–3.13, –2.22) mm Hg among those with the rs9397453 C/C genotype, –1.23 (–1.98, –0.48) mm Hg among those with the C/T genotype, and 0.08 (–2.31, 2.47) mm Hg among those with the T/T genotype (P = 1×10⁻⁴; false discovery rate (FDR)-q = 0.04). Mean DBP responses to high sodium according to the rs9397453 genotypes were 1.46 (1.03, 1.89) mm Hg among those with C/C, 0.19 (–0.54, 0.91) mm Hg among those with C/T, and –1.10 (–2.82, 0.61) mm Hg among those with T/T (P = 2×10⁻⁴; FDR-q = 0.04). Similar trends were noted for the association between these ESR1 variants and SBP responses to the dietary intervention. There were no significant associations between sex hormone gene variants and salt sensitivity in women, with genotype-gender interactions noted for the ESR1 markers that achieved significance in men.
CONCLUSIONS
We identified strong, consistent associations between ESR1 gene variants and salt sensitivity in men. Our results support a gender-specific role for ESR1 in the etiology of this complex trait.
Keywords: blood pressure, genetics, polymorphism, dietary sodium, salt sensitivity, gender, hypertension.
Hypertension is a global public health challenge because of its high prevalence and the concomitant increase in risk of cardiovascular disease.1,2 As a complex trait, blood pressure (BP) is influenced by the interaction of multiple environmental and genetic determinants.3 Among environmental determinants, dietary sodium intake is the most important modifiable risk factor for hypertension.4–6 The causal relationship between dietary sodium intake and elevated BP has been documented extensively in clinical trials.7,8 Clinical trials have also shown that BP responses to sodium intervention vary substantially among individuals, a phenomenon known as BP salt sensitivity.9 A risk factor for hypertension, cardiovascular disease, and premature death,10–12 several determinants of salt sensitivity have been clearly established, including elevated BP, African-American race, metabolic syndrome, and older age.13–16 Recently, gender differences in BP responses to low- and high-sodium interventions were identified, with women showing increased salt sensitivity compared with men.15 Although reasons for this gender difference are not well understood, animal and human studies have documented associations between sex hormones and both renal sodium handling and vascular function.17–19 These data suggest that genes encoding sex hormones could have important influences on BP salt sensitivity and may help to explain the observed gender differences in BP response to sodium intake.
The objective of the current study was to examine the association between genes involved in sex hormone biosynthesis, metabolism, and degradation and systolic BP (SBP) and diastolic BP (DBP) responses to a dietary sodium intervention among 1,906 Han Chinese participants of the Genetic Epidemiology Network of Salt Sensitivity (GenSalt) study. In addition, we conducted subgroup analyses to examine the possibility of a gender-specific role of sex hormone genes in the etiology of the salt-sensitivity phenotypes.
METHODS
Study population
The GenSalt study was conducted in a Han Chinese population living in rural areas of northern China where habitual salt intake is high.20 A community-based BP screening was conducted among persons aged 18–60 years in the study villages to identify potential probands and their families. Those with a mean SBP between 130 and 160mm Hg and/or a DBP between 85 and 100mm Hg and no use of antihypertensive medications and their spouses, siblings, and offspring were recruited as volunteers for the dietary intervention study. Detailed eligibility criteria for the probands and siblings/spouses/offspring have been presented elsewhere.21 Individuals who had stage-2 hypertension, secondary hypertension, a history of clinical cardiovascular disease or diabetes, used antihypertensive medications, or were pregnant, heavy alcohol drinkers, or currently on a low-sodium diet were excluded from the study. Among the 1,906 eligible participants, 1,871 (98.2%) and 1,860 (97.6%) completed the low-sodium and high-sodium interventions, respectively, and were included in the current analysis.
Institutional review boards at all of the participating institutions approved the GenSalt study. Written informed consents for the baseline observation and for the intervention program were obtained from each participant.
Dietary intervention
The study participants received a 7-day low-sodium diet (3 grams of sodium chloride or 51.3 mmol of sodium per day) followed by a 7-day high-sodium diet (18 grams of sodium chloride or 307.8 mmol of sodium per day). During the period of sodium intervention, dietary potassium intake remained unchanged. Total energy intake was varied according to each participant’s baseline energy intake. All study foods were cooked without salt, and prepackaged salt was added to the individual study participant’s meal when it was served by the study staff. To ensure study participants’ compliance with the intervention program, they were required to have their breakfast, lunch, and dinner at the study kitchen under supervision of the study staff during the entire study period. The study participants were instructed to avoid consuming any foods that were not provided by study personnel. Three timed urinary specimens (one 24-hour and two overnight) were collected at baseline and at the end of each intervention phase (days 5, 6, and 7) to monitor each participant’s compliance with their dietary sodium intervention. Overnight urinary sodium excretion measures were converted to 24-hour values using formulas developed from a random subsample of 238 subjects who collected overnight and 24-hour urine samples on the same days. The mean (standard deviation) of 24-hour urinary excretions of sodium and potassium were 242.4 (66.7) mmol and 36.9 (9.6) mmol at baseline, 47.5 (16.0) mmol and 31.4 (7.7) mmol during the low-sodium intervention, and 244.3 (37.7) mmol and 35.7 (7.5) mmol during the high-sodium intervention, respectively. Baseline 24-hour urinary sodium excretions were not significantly different from those of the high-sodium intervention phase, showing that sodium intake during the high-sodium diet was similar to the habitual sodium intake of this population.
Phenotype measurement
A standard questionnaire was administered by trained staff at the baseline examination to collect information on family structure, demographic characteristics, personal and family medical history, and lifestyle risk factors including alcohol consumption, cigarette smoking, and physical activity. Three morning BP measurements were obtained according to a standard protocol during each of the 3 days of baseline observation and on days 5, 6, and 7 of each intervention period. All BP readings were measured by trained and certified observers using a random-zero sphygmomanometer.22 BP was measured with the participant in the sitting position after 5 minutes of rest. In addition, participants were advised to avoid alcohol, cigarette smoking, coffee/tea, and exercise for at least 30 minutes prior to their BP measurements. All BP observers were blinded to the participant’s dietary intervention. Body weight and height were measured twice with participants wearing light indoor clothing without shoes during the baseline examination. Body mass index (BMI) was calculated as kilograms per meters squared (kg/m2).
Salt-sensitivity phenotypes were defined continuously as the absolute changes in SBP and DBP when switching from baseline to low-sodium and from low-sodium to high-sodium intervention. Mean BP responses to low sodium were calculated as the mean of 9 measurements on days 5, 6, and 7 during the low-sodium intervention minus the mean of 9 measurements at baseline. Responses to high sodium were calculated as the mean of 9 measurements on days 5, 6, and 7 during the high-sodium intervention minus the mean of 9 measurements on days 5, 6 and 7 during the low-sodium intervention.
Candidate gene and single-nucleotide polymorphism selection and genotyping
We conducted a Medline literature search using Medical Subject Heading (MeSH) terms “gonadal steroid hormones” or keyword “sex hormones” and MeSH terms “genes” or “polymorphism, single nucleotide” and utilized the Kyoto Encyclopedia of Genes and Genomes steroid hormone biosynthesis pathway map to identify genes encoding sex hormones. References of articles used to identify genes can be found at http://www.nature.com/ajh. Table 1 provides the names, chromosomal locations, and functions of the 44 candidate genes that were identified and examined in the current study. Single-nucleotide polymorphism (SNP) data, genotyped as part of the Affymetrix platform (Affymetrix 6.0, Inc., Santa Clara, CA), were available for 948 SNPs in 44 of the selected candidate genes and their 5,000 base pair flanking regions. Quality control, including checks of Mendelian consistency, genotyping call rate, minor allele frequency (MAF), and Hardy-Weinberg equilibrium, was performed using PLINK software. After exclusion of 133 SNPs with low MAF (< 0.01), 5 SNPs with low call rate (< 0.95), and 11 SNPs with low MAF and call rate, 799 SNPs from 39 genes remained for the analysis.
Table 1.
Genes involved in sex steroid hormone biosynthesis, metabolism, and degradation
| Gene symbol | Gene name | Chr | Physical position ± 5,000 bp | SNPs | Function |
|---|---|---|---|---|---|
| GSTM1 | Glutathione S-transferase mu 1 | 1 | (110225436, 110241367) | 1 | Involved in the excretion of catechol estrogen.1 |
| HSD3B2 | Hydroxy-delta-5-steroid dehydrogenase, 3 beta- and steroid delta-isomerase 2 | 1 | (119952554, 119970658) | 6 | Crucial early role in the biosynthesis of hormonal steroids.2 |
| HSD3B1 | Hydroxy-delta-5-steroid dehydrogenase, 3 beta- and steroid delta-isomerase 1 | 1 | (120044821, 120062681) | 10 | Crucial early role in the biosynthesis of sex steroid hormones.3 |
| EPHX1 | Epoxide hydrolase 1, microsomal | 1 | (225992794, 226038260) | 20 | Regulates cholesterol metabolism.4 |
| SRD5A2 | Steroid-5-alpha-reductase, alpha polypeptide 2 | 2 | (31742550, 31811136) | 13 | Metabolizes testosterone.5 |
| CYP1B1 | Cytochrome P450, family 1, subfamily B, polypeptide 1 | 2 | (38289116, 38342044) | 27 | Metabolizes estradiol to hydroxyl/methoxy estrogens.5 |
| LHCGR | Luteinizing hormone/choriogonadotropin receptor | 2 | (48854428, 48987880) | 33 | Mediates function of LH and hCG.6 |
| FSHR | Follicle stimulating hormone receptor | 2 | (49184296, 49386676) | 93 | Mediates function of FSH.7 |
| UGT1 Familya | UGD glucosyltranferase 1 | 2 | (234540100, 234686951) | 55 | Catalyzes the glucuronidation of estrone.8,9 |
| FOXL2 | Forkhead box L2 | 3 | (138658066, 138670982) | 2 | Negatively regulates CYP17, a steroidogenic enzyme involved in the biosynthesis of sex steroid hormones.10 |
| UGT2 Familyb | UDP glucuronosyltransferase 2 family, polypeptide B17 | 4 | (69397902, 70523967) | 70 | Catalyzes the glucuronidation of estrone.8,9 |
| SULT1E1 | Sulfotransferase family 1E, estrogen-preferring, member 1 | 4 | (70671498, 70730870) | 9 | Catalyzes the sulfate conjugation of estrogen.11 |
| SRD5A1 | Steroid-5-alpha-reductase, alpha polypeptide 1 | 5 | (6628456, 6674675) | 16 | Catalyzes the sulfate conjugation of estrogen.11 |
| ESR1 | Estrogen receptor 1 | 6 | (151972826, 152455754) | 130 | Mediates effects of estrogens; interacts with testosterone and estrogens to activate SRD5A2.5,12 |
| CYP3A5 | Cytochrome P450, family 3, subfamily A, polypeptide 5 | 7 | (99240817, 99282621) | 3 | Catalyzes the hydroxylation of testosterone.13 |
| CYP3A4 | Cytochrome P450, family 3, subfamily A, polypeptide 4 | 7 | (99349604, 99386888) | 0 | Metabolizes estradiol to hydroxyl/methoxy estrogens.5 |
| STAR | Steroidogenic acute regulatory protein | 8 | (37996167, 38013783) | 3 | Facilitates the movement of cholesterol into the inner mitochondrial membrane, an early step in steroidogenesis.8 |
| HSD17B3 | Hydroxysteroid (17-beta) dehydrogenase 3 | 9 | (98992588, 99069434) | 31 | Converts androstenedione to testosterone.5 |
| AKR1C3 | Aldo-keto reductase family 1, member C3 | 10 | (5072549, 5154878) | 37 | Involved in the conversion of androstenedione to estrone and testosterone to estradiol.7 |
| CYP17A1 | Cytochrome P450, family 17, subfamily A, polypeptide 1 | 10 | (104585288, 104602290) | 4 | Converts pregnenolone to 17α-hydroxypregnenolone and DHEA. Converts progesterone to 17α-hydroxyprogesterone and androstenedione.3 |
| FSHB | Follicle stimulating hormone, beta polypeptide | 11 | (30247563, 30261808) | 6 | Regulates follicular development and sex steroid production.14 |
| GSTP1 | Glutathione S-transferase pi 1 | 11 | (67346066, 67359131) | 1 | Involved in the excretion of catechol estrogen.1 |
| PGR | Progesterone receptor | 11 | (100895355, 101006255) | 23 | Mediates the function of progesterone.2 |
| ESR2 | Estrogen receptor 2 | 14 | (64545950, 64810268) | 52 | Mediates the effect of estrogens.12 |
| CYP19A1 | Cytochrome P450, family 19, subfamily A, polypeptide 1 | 15 | (51495254, 51635807) | 60 | Rate-limiting step in estrogen production.3 |
| CYP11A1 | Cytochrome P450, family 11, subfamily A, polypeptide 1 | 15 | (74625100, 74665081) | 7 | Involved in the formation of pregnenolone from cholesterol.3 |
| CYP1A1 | Cytochrome P450, family 1, subfamily A, polypeptide 1 | 15 | (75006883, 75022951) | 0 | Metabolizes estradiol to hydroxyl/methoxy estrogens.5 |
| PDE8A | Phosphodiesterase 8A | 15 | (85518671, 85687376) | 40 | Expressed in the ovary and testis; involved in hormone signaling pathway.15 |
| SULT1A1 | Sulfotransferase family, cytosolic, 1A, phenol-preferring, member 1 | 16 | (28611903, 28639907) | 2 | Catalyzes the sulfate conjugation of estrogen.11 |
| HSD17B2 | Hydroxysteroid (17-beta) dehydrogenase 2 | 16 | (82063866, 82137139) | 28 | Responsible for the oxidation of estrogen to a less active form.3 |
| SHBG | Sex hormone-binding globulin | 17 | (7526287, 7541701) | 1 | Binds to sex steroids (testosterone, estradiol) to regulate their bioavailability.7 |
| HSD17B1 | Hydroxysteroid (17-beta) dehydrogenase 1 | 17 | (40698984, 40712857) | 0 | Responsible for the reduction of estrogen to a more active form.3 |
| LHB | Luteinizing hormone beta polypeptide | 19 | (49514237, 49525347) | 1 | Promotes spermatogenesis and ovulation by stimulating the testes and ovaries to synthesize steroids.6 |
| COMT | Catechol-O-methyltransferase | 22 | (19924130, 19962498) | 15 | Involved in the excretion of catechol estrogen.1 |
| GSTT1 | Glutathione-S-transferase theta 1 | 22 | (24371133, 24389680) | 0 | Involved in the excretion of catechol estrogen.1 |
| AR | Androgen receptor | X | (66758874, 66955461) | 0 | Mediates the effect of estrogens.12 |
Abbreviations: Chr, Chromosome; LH, Luteinizing hormone; hCG, human chorionic gonadotropin; FSH, Follicle stimulating hormone; CYP17, Cytochrome P450, family 17; UGD, UDP-glucose-6-dehydrogenase; SRD5A2, steroid-5-alpha-reductase, alpha polypeptide 2; DHEA, Dehydroepiandrosterone.
aUGT1 family includes a cluster of related genes: UGT1A10, UGT1A9, UGT1A7, UGT1A3, and UGT1A1. bUGT2 family includes a cluster of related genes: UGT2B17, UGT2B15, UGT2B7, UGT2B4, and UGT2A1.
Supplementary references 1–15 are available at www://www.nature.com/ajh.
Statistical analysis
Baseline characteristic and BP response variables were calculated for men and women separately and compared in univariable analyses using t tests. Additive associations between single SNPs and BP responses to low- and high-sodium interventions were assessed using a mixed linear regression model to account for the nonindependence of family members. Age, gender, BMI, BP measurement at room temperature, and study site were adjusted in multivariable analyses. Because the expression of genes encoding sex hormones may vary substantially between men and women, a similar but gender-stratified analysis was also conducted. To adjust for multiple comparisons, the false discovery rate (FDR) q value was calculated for all SNPs. For SNPs with a FDR-q < 0.05, we estimated the mean effect size and 95% confidence interval (CI) for each genotype using a mixed linear regression model. For SNPs significant in any of the gender-stratified analyses, a test for gender–genotype interaction was conducted. These analyses were conducted using SAS statistical software (version 9.1; SAS Institute Inc). We used Haploview software (version 4.2; http://www.broadinstitute.org/haploview) to estimate the extent of linkage disequilibrium (LD), defined by the pairwise r 2 value between SNPs.23
RESULTS
The baseline characteristics of GenSalt study participants according to gender are presented in Table 2. Approximately 53% of study participants were male. On average, men were older and leaner than their female counterparts. Although men had higher average baseline SBP and DBP measures compared with women, their BP responses to dietary sodium intake were generally lower in magnitude (Table 2).
Table 2.
Baseline characteristics of 1,906 GenSalt dietary intervention participants
| Men (N = 1,010) | Women (N = 896) | P for gender difference | |
|---|---|---|---|
| Characteristic | Mean ± SD | ||
| Age, y | 39.3±9.6 | 38.1±9.4 | 0.008 |
| BMI, kg/m2 | 23.1±3.1 | 23.5±3.2 | 0.009 |
| Baseline BP, mm Hg | |||
| Systolic | 118.7±12.8 | 114.9±15.4 | < 0.0001 |
| Diastolic | 75.6±9.9 | 71.7±10.5 | < 0.0001 |
| BP response to low salt, mm Hg | |||
| Systolic | –5.3±7.0 | –5.7±7.1 | 0.20 |
| Diastolic | –2.4±5.7 | –3.2±5.3 | 0.001 |
| BP response to high salt, mm Hg | |||
| Systolic | 4.5±5.9 | 5.3±6.1 | 0.004 |
| Diastolic | 1.4±5.4 | 2.6±5.3 | < 0.0001 |
Abbreviations: BMI, body mass index; BP, blood pressure.
Analysis of 799 SNPs in 39 genes encoding sex hormones revealed significant associations between genetic variants in the estrogen receptor 1 (ESR1) gene and BP responses to dietary sodium intake in the overall and gender-stratified analyses (Supplementary Figures a-f at http://www.nature.com/ajh). Among all GenSalt study participants, the minor alleles of 2 common, moderately correlated intronic ESR1 markers, rs9397453 and rs9383951 (pairwise r 2 = 0.68), were strongly associated with decreased DBP responses to low-sodium intervention (Figure 1a and 1b). With MAFs = 0.11, rs9397453 attained a P = 1×10⁻⁴ (FDR-q = 0.04; Figure a) and rs9383951 attained P = 4×10⁻⁵ (FDR-q = 0.04; Figure b). Although not significant after adjustment for multiple comparisons, similar trends were observed for SBP response to low-sodium intervention for these 2 markers.
Figure 1.
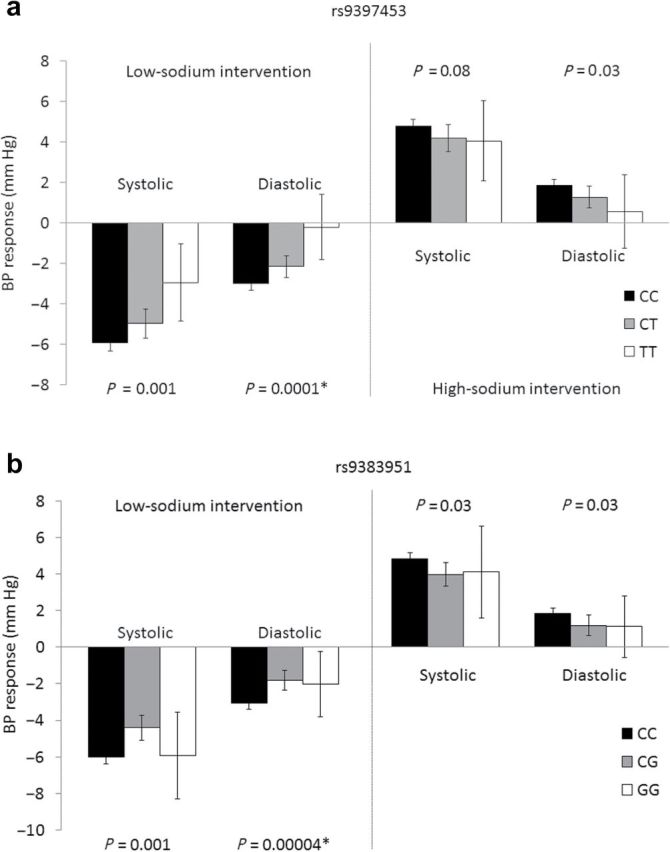
Systolic blood pressure and diastolic blood pressure responses to the low- and high-sodium dietary interventions according to estrogen receptor 1 rs9397453 (a) and rs9383951 (b) genotypes. Asterisk indicates significant after adjustment for multiple comparisons.
Analysis of GenSalt men showed results similar to those of the overall analysis, with 5 ESR1 variants attaining statistical significance for the salt-sensitivity phenotypes (Table 3). The minor alleles of ESR1 markers rs9397453 and rs9383951 were significantly associated with decreased DBP response to the low-sodium intervention (both P = 0.0001; both FDR-q = 0.04). In addition, intronic ESR1 variant rs9340844 (MAF = 0.14), which was in moderate LD with both rs9397453 (pairwise r 2 = 0.62) and rs9383951 (pairwise r 2 = 0.41), also significantly associated with DBP response to low sodium (P = 0.0001; FDR-1 = 0.04). Furthermore, 3 highly correlated ESR1 SNPs (all pairwise r 2 > 0.90), which included rs9397453 plus rs9371562 and rs9397459, were significantly associated with DBP response to the high-sodium intervention (all P = 0.0002; all FDR-q = 0.05). Consistent trends were observed for rs9340844 (P = 0.002; FDR-q = 0.10) and rs9383951 (P = 0.0005; FDR-q = 0.25).
Table 3.
Blood pressure responses to the dietary sodium interventions, according to gender and ESR1 genotypes
| Blood pressure response to low sodium | Blood pressure response to high sodium | |||||||||||
|---|---|---|---|---|---|---|---|---|---|---|---|---|
| Men | Women | Interaction Pb | Men | Women | Interaction Pb | |||||||
| SNP | Genotype | NMen/NWomen | Absolute change, mm Hg, (95% CI) | P | Absolute change, mm Hg, (95% CI) | P | Absolute change, mm Hg, (95% CI) | P | Absolute change, mm Hg, (95% CI) | P | ||
| Systolic blood pressure | ||||||||||||
| rs9340844 | CC | 717/649 | –5.86 (–6.37, –5.34) | 0.0008 | –6.01 (–6.62, –5.41) | 0.14 | 0.01 | 4.63 (4.18, 5.07) | 0.001 | 4.99 (4.51, 5.46) | 0.72 | 0.001 |
| CT | 231/204 | –4.26 (–5.13, –3.38) | –5.64 (–6.48, –4.79) | 3.64 (2.88, 4.41) | 5.18 (4.28, 6.09) | |||||||
| TT | 29/19 | –3.89 (–6.11, –1.67) | –3.63 (–6.17, –1.08) | 2.53 (0.98, 4.08) | 5.04 (2.06, 8.02) | |||||||
| rs9397453 | CC | 768/695 | –5.70 (–6.19, –5.20) | 0.002 | –6.03 (–6.62, –5.45) | 0.15 | 0.14 | 4.56 (4.12, 4.99) | 0.003 | 5.06 (4.60, 5.53) | 0.77 | 0.03 |
| CT | 185/160 | –4.34 (–5.37, –3.31) | –5.58 (–6.55, –4.60) | 3.47 (2.63, 4.30) | 4.97 (3.96, 5.98) | |||||||
| TT | 17/11 | –2.65 (–5.15, –0.16) | –3.42 (–6.06, –0.79) | 1.97 (–0.49, 4.43) | 6.77 (3.09, 10.46) | |||||||
| rs9371562 | TT | 769/707 | –5.77 (–6.28, –5.27) | –6.08 (–6.66, –5.50) | 4.62 (4.18, 5.05) | 5.02 (4.56, 5.48) | ||||||
| TA | 209/170 | –4.33 (–5.30, –3.37) | 0.001 | –4.94 (–5.87, –4.01) | 0.07 | 0.22 | 3.48 (2.65, 4.31) | 0.001 | 4.75 (3.75, 5.75) | 0.53 | 0.007 | |
| AA | 15/11 | –2.70 (–5.48, 0.09) | –6.41 (–9.82, –2.99) | 1.17 (–1.07, 3.41) | 9.21 (6.30, 12.13) | |||||||
| rs9397459 | GG | 769/707 | –5.77 (–6.27, –5.26) | –6.08 (–6.66, –5.50) | 4.62 (4.19, 5.06) | 5.02 (4.56, 5.48) | ||||||
| GA | 210/170 | –4.37 (–5.33, –3.40) | 0.002 | –4.94 (–5.87, –4.01) | 0.07 | 0.24 | 3.48 (2.66, 4.31) | 0.001 | 4.75 (3.75, 5.75) | 0.53 | 0.006 | |
| AA | 15/11 | –2.70 (–5.49, 0.09) | –6.41 (–9.82, –2.99) | 1.16 (–1.08, 3.41) | 9.21 (6.30, 12.13) | |||||||
| rs9383951 | CC | 765/684 | –5.78 (–6.28, –5.28) | 0.005 | –6.14 (–6.73, –5.56) | 0.04 | 0.12 | 4.65 (4.22, 5.08) | 0.0009 | 5.03 (4.56, 5.50) | 0.77 | 0.0005 |
| CG | 196/176 | –4.07 (–5.02, –3.11) | –4.69 (–5.66, –3.71) | 3.21 (2.31, 4.10) | 4.93 (3.95, 5.91) | |||||||
| GG | 16/12 | –5.00 (–8.47, –1.53) | –6.98 (–9.94, –4.02) | 1.94 (–0.64, 4.53) | 6.74 (2.26, 11.21) | |||||||
| Diastolic blood pressure | ||||||||||||
| rs9340844 | CC | 717/649 | –2.78 (–3.25, –2.31) | 0.0001a | –3.11 (–3.59, –2.63) | 0.74 | 3.7×10⁻⁶ | 1.45 (1.02, 1.89) | 0.002 | 2.04 (1.60, 2.48) | 0.21 | 1.8×10⁻⁶ |
| CT | 231/204 | –1.24 (–1.91, –0.56) | –3.25 (–3.97, –2.54) | 0.57 (–0.11, 1.26) | 2.60 (1.89, 3.30) | |||||||
| TT | 29/19 | –0.92 (–2.77, 0.93) | –1.73 (–3.40, –0.05) | –0.66 (–2.10, 0.79) | 2.22 (0.40, 4.04) | |||||||
| rs9397453 | CC | 768/695 | –2.67 (–3.13, –2.22) | 0.0001a | –3.21 (–3.69, –2.73) | 0.18 | 0.03 | 1.46 (1.03, 1.89) | 0.0002a | 2.17 (1.74, 2.60) | 0.70 | 0.005 |
| CT | 185/160 | –1.23 (–1.98, –0.48) | –2.98 (–3.71, –2.24) | 0.19 (–0.54, 0.91) | 2.26 (1.49, 3.03) | |||||||
| TT | 17/11 | 0.08 (–2.31, 2.47) | –0.86 (–2.61, 0.90) | –1.10 (–2.82, 0.61) | 2.78 (–0.18, 5.73) | |||||||
| rs9371562 | TT | 769/707 | –2.68 (–3.15, –2.22) | –3.23 (–3.70, –2.76) | 1.50 (1.07, 1.94) | 2.17 (1.76, 2.58) | ||||||
| TA | 209/170 | –1.33 (–2.07, –0.59) | 0.0004 | –2.63 (–3.39, –1.87) | 0.14 | 0.09 | 0.14 (–0.57, 0.85) | 0.0002a | 2.03 (1.17, 2.88) | 0.69 | 0.005 | |
| AA | 15/11 | –0.32 (–2.93, 2.28) | –2.61 (–5.55, 0.33) | –0.73 (–2.53, 1.07) | 4.40 (1.76, 7.03) | |||||||
| rs9397451 | GG | 769/707 | –2.69 (–3.16, –2.22) | –3.23 (–3.70, –2.76) | 1.51 (1.07, 1.95) | 2.17 (1.76, 2.58) | ||||||
| GA | 210/170 | –1.29 (–2.03, –0.55) | 0.0003 | –2.63 (–3.39, –1.87) | 0.14 | 0.08 | 0.13 (–0.57, 0.84) | 0.0002a | 2.03 (1.17, 2.88) | 0.69 | 0.004 | |
| AA | 15/11 | –0.32 (–2.93, 2.28) | –2.61 (–5.55, 0.33) | –0.73 (–2.53, 1.07) | 4.40 (1.76, 7.03) | |||||||
| rs9383951 | CC | 765/684 | –2.73 (–3.18, –2.28) | 0.0001a | –3.28 (–3.75, –2.81) | 0.08 | 0.003 | 1.49 (1.05, 1.92) | 0.0005 | 2.15 (1.73, 2.57) | 0.74 | 1.3×10⁻⁵ |
| CG | 196/176 | –1.06 (–1.82, –0.30) | –2.42 (–3.20, –1.65) | 0.09 (–0.66, 0.84) | 2.21 (1.37, 3.06) | |||||||
| GG | 16/12 | –1.02 (–3.45, 1.41) | –3.27 (–5.83, –0.72) | –0.22 (–2.05, 1.61) | 2.87 (0.07, 5.67) | |||||||
Abbreviation: CI, confidence interval. aFDR-q < 0.05. b P value for gender-genotype interaction.
In contrast, there was no evidence of association between any of the variants in genes encoding sex hormones, including ESR1, with salt-sensitivity phenotypes among women (Supplementary Figures e and f at http://www.nature.com/ajh). For those ESR1 markers that were highly significant among men but not women (rs9340844, rs9397453, rs9371562, rs9397459, and rs9383951), we tested for gender–genotype interactions, noting highly significant interactions for most BP response phenotypes (Table 3). These data suggest that the results of the overall analysis were strongly driven by the associations observed in men.
DISCUSSION
The current study provides the first evidence of a relationship among variants of the ESR1 gene and salt sensitivity of BP. Although ESR1 markers rs9397453 and rs9383951 were associated with salt-sensitivity phenotypes in overall analyses, gender-stratified findings suggested that these results were primarily driven by the strong associations identified in male GenSalt participants. The minor alleles of ESR1 rs9397453 and rs9383951, plus additional markers rs9340844, rs9371562, and rs9397459, were shown to significantly decrease BP responses to sodium in men but not women, with highly significant gender–genotype interactions noted. These findings may have important public health and clinical implications. Despite previous work that identified increased BP responses to sodium intake in women compared with men,15 the current work provides the first evidence of sexual dimorphism in the genetic etiology of this complex trait. Our research highlights the importance of considering gene–environment interaction in the context of BP salt sensitivity and also suggests novel genetic mechanisms underlying BP response to sodium intake in men.
To date, GenSalt is the first dietary intervention study to examine the association between genetic variants encoding sex hormones and BP response to dietary sodium intervention. Study attributes, including the recruitment of all Han Chinese participants, should make the analysis robust to population stratification. The study participants were also similar with respect to lifestyle risk factors, including diet and physical activity, minimizing environmental variation and increasing statistical power to detect genotype–phenotype associations. The majority of participants completed the dietary intervention (96.8%), and compliance with the study interventions, as assessed by urinary excretion of sodium and potassium during each intervention period, was excellent. Measurement error was reduced and power enhanced by the large number of BP measurements that were collected for each participant. Finally, stringent quality control procedures were used during measurement of BP and the other study covariables, conduct of the dietary interventions, genotyping, and marker data cleaning.
Certain limitations should be addressed. Because our research was conducted in a Han Chinese population, the findings may not be generalizable to populations with distinct LD structure. However, it should be noted that transethnic replications of genomic associations have been increasingly reported as unique populations are examined.3 In addition, although the Affymetrix 6.0 platform generally provides good genomic coverage of common polymorphisms in the Han Chinese population (approximately 75%),24 genotype data were not available for 5 genes encoding sex hormones (see Table 1). Therefore, future research to examine the association between these genes and BP salt sensitivity is needed. Furthermore, with MAFs of significant ESR1 SNPs ranging from 11% to 14%, mean BP responses among participants homozygous for the variant alleles were not very precise, with relatively large CIs. However, we were able to confirm the veracity of the genotype calls through checks of Mendelian consistency among family members in addition to other standard quality control procedures. Further, the MAFs were more than sufficient to identify significant dose-response associations in our data.
The ESR1 gene is a particularly attractive candidate for genetic study of BP-related traits due to its well-established role in vascular function. Studies have long documented the expression of this gene in endothelial and smooth muscle cells of men and women.19 Estrogen binding to ESR1 has been shown to cause rapid vasodilation of blood vessels through the activation of endothelial nitric oxide synthase and also has long-term effects on gene expression in vascular cells.25–27 ESR1 variants have already been linked to SBP, DBP, hypertension, hypertensive pregnancy, left ventricular hypertrophy, and cardiovascular diseases,28–37 with marker rs2234693 (widely known as the PvuII variant) by far the most commonly associated SNP in the ESR1 gene.29–31,33,34,36,37 We examined rs2234693 for its association with salt-sensitivity phenotypes in the current study, observing minimum raw P values of 0.04 and 0.07 for its association with DBP responses to low- and high-sodium interventions, respectively. Although noteworthy, these modest associations did not remain significant after adjustment for multiple testing.
In contrast, we identified significant associations between ESR1 SNPs rs9397453 and rs9383951 and BP salt sensitivity, findings that appeared to be driven by the strong associations observed in male GenSalt participants. Among men, we identified consistent inverse associations between novel ESR1 variants rs9340844, rs9397453, rs9371562, rs9397459, and rs9383951 with DBP responses to the dietary sodium interventions, noting similar trends for SBP responses. These 5 intronic ESR1 variants showed little evidence for conservation across species or regulatory action, making it unlikely that they are causally associated with the salt-sensitivity phenotype.38 It is more plausible that the associations reflect LD of these SNPs with a functional but still undiscovered variant. Although rs9397453, rs9371562, and rs9397459 were in very strong LD, there were only moderate pairwise correlations between this group of variants and rs9340844 and rs9383951. Therefore, it is unclear whether the identified variants reflect the signal of only 1 or more causal ESR1 variants. While we await replication and functional study to elucidate the true nature of the observed relationship in humans, the results provide promising evidence for a gender-specific role of the ESR1 gene in salt sensitivity of BP.
Our finding of a relationship between the ESR1 gene and BP response to sodium in men but not women is of particular interest. Although we are the first to identify such an association with salt sensitivity, past studies have noted gender-specific associations of ESR1 with other BP-related phenotypes. For example, Ellis and colleagues identified significantly increased SBP among male carriers of the minor allele of ESR1 SNP rs2234693 compared with men who were homozygous for the major allele.29 Similarly, Peter and colleagues identified significant associations between ESR1 rs2234693 and moderately correlated SNP rs2077647 with SBP and pulse pressure among male participants of the Framingham Heart Study offspring cohort.30 Neither study identified corresponding associations among their female participants.29,30 Male-specific associations of ESR1 variants have also been reported for cardiovascular diseases,31,37 with Shearman and colleagues reporting a 2.9-fold increased risk of myocardial infarction among male carriers of the rs2234693 minor allele compared with those homozygous for the major allele (P < 0.001).37 Despite the accumulating evidence from genetic studies that suggest gender differences in the association between ESR1 and BP-related phenotypes, there is a paucity of physiologic research to support such relationships. Given gender differences in concentrations of circulating estrogens26 as well as the ESR1 protein,39,40 it is plausible that there may be gender differences in vascular function mediated by estrogen and its alpha receptor (encoded by ESR1). Future research in this area could provide important insights into observed gender differences in BP salt sensitivity and other BP-related traits.
In summary, we provide the first evidence of a role for ESR1 variants in BP salt sensitivity. Gender-stratified analyses showed that these findings were driven by the strong associations observed in men, with no significant associations in women and highly significant gender–genotype interactions noted. Despite these promising results, additional work is needed. Replication efforts will be necessary to confirm our findings. Furthermore, sequencing studies to identify the functional alleles responsible for the reported associations are also warranted. Still, the current report provides an important contribution to the accumulating body of evidence that suggests a gender-specific role of ESR1 in the genetic etiology of BP-related traits.
SUPPLEMENTARY MATERIAL
Supplementary materials are available at the American Journal of Hypertension online (http://www.oxfordjournals.org/our_journals/ajh/). Supplementary materials consist of data provided by the author that are published to benefit the reader. The posted materials are not copyedited. The contents of all supplementary data are the sole responsibility of the authors. Questions or messages regarding errors should be addressed to the author.
DISCLOSURE
We have no conflicts of interest to declare.
ACKNOWLEDGMENTS
The Genetic Epidemiology Network of Salt Sensitivity is supported by research grants (U01HL072507, R01HL087263, and R01HL090682) from the National Heart, Lung, and Blood Institute, National Institutes of Health, Bethesda, MD. Dr Kelly was supported by award number K12HD043451 from the Eunice Kennedy Shriver National Institute of Child Health and Human Development and American Heart Association award number 11SDG5130026.
REFERENCES
- 1. Kearney PM, Whelton M, Reynolds K, Muntner P, Whelton PK, He J. Global burden of hypertension: Analysis of worldwide data. Lancet 2005;365:217–223 [DOI] [PubMed] [Google Scholar]
- 2. Danaei G, Finucane MM, Lin JK, Singh GM, Paciorek CJ, Cowan MJ, Farzadfar F, Stevens GA, Lim SS, Riley LM, Ezzati M, Global Burden of Metabolic Risk Factors of Chronic Diseases Collaborating G National, regional, and global trends in systolic blood pressure since 1980: Systematic analysis of health examination surveys and epidemiological studies with 786 country-years and 5.4 million participants. Lancet 2011;377:568–577 [DOI] [PubMed] [Google Scholar]
- 3. Kato N, Takeuchi F, Tabara Y, Kelly TN, Go MJ, Sim X, Tay W, Chen CH, Zhang Y, Yamamoto K, Katsuya T, Yokota M, Kim YJ, Ong RTH, Nabika T, Gu D, Chang L, Kokkubo Y, Huang W, Ohnaka K, Yoamori Y, Nakashima E, Lee JY, Seielstad M, Isono M, Hisxon JE, Chen YT, Miki T, Zhang X, Sugiyama T, Jeon JP, Liu JJ, Takayanagi R, Kim SS, Aung T, Sung YJ, Jin L, Wong TY, Han BG, Kobayashi S, Ogihara T, Zhu D, Iwai N, Wu JY, Teo YY, Tai ES, Cho YS, He J. Meta-analysis identifies five novel loci associated with blood pressure in East Ssians. Nat Genet 2011;43:531–538 [DOI] [PMC free article] [PubMed] [Google Scholar]
- 4. Whelton PK, He J, Appel LJ, Cutler JA, Havas S, Kotchen TA, Roccella EJ, Stout R, Vallbona C, Winston MC, Karimbakas J. National High Blood Pressure Education Program Coordinating C. Primary prevention of hypertension: Clinical and public health advisory from the National High Blood Pressure Education Program. JAMA 2002;288: 1882–1888 [DOI] [PubMed] [Google Scholar]
- 5. He J, Whelton PK. Salt intake, hypertension and risk of cardiovascular disease: An important public health challenge. Int J Epidemiol 2002;31:327–331 [PubMed] [Google Scholar]
- 6. Chobanian AV, Hill M. National heart, lung, and blood institute workshop on sodium and blood pressure: A critical review of current scientific evidence. Hypertension 2000;35:858–863 [DOI] [PubMed] [Google Scholar]
- 7. Cutler JA, Follmann D, Allender PS. Randomized trials of sodium reduction: An overview. Am J Clin Nutr 1997;65:643S–651S [DOI] [PubMed] [Google Scholar]
- 8. Sacks FM, Svetkey LP, Vollmer WM, Appel LJ, Bray GA, Harsha D, Obarzanek E, Conlin PR, Miller ER, 3rd, Simons-Morton DG, Karanja N, Lin PH, Group DA-SCR. Effects on blood pressure of reduced dietary sodium and the dietary approaches to stop hypertension (dash) diet. Dash-Sodium Collaborative Research Group NEJM 2001;344:3–10 [DOI] [PubMed] [Google Scholar]
- 9. Weinberger MH. Salt sensitivity of blood pressure in humans. Hypertension 1996;27:481–490 [DOI] [PubMed] [Google Scholar]
- 10. Barba G, Galletti F, Cappuccio FP, Siani A, Venezia A, Versiero M, Della Valle E, Sorrentino P, Tarantino G, Farinaro E, Strazzullo P. Incidence of hypertension in individuals with different blood pressure salt-sensitivity: Results of a 15-year follow-up study. J Hypertens 2007;25:1465–1471 [DOI] [PubMed] [Google Scholar]
- 11. Morimoto A, Uzu T, Fujii T, Nishimura M, Kuroda S, Nakamura S, Inenaga T, Kimura G. Sodium sensitivity and cardiovascular events in patients with essential hypertension. Lancet 1997;350:1734–1737 [DOI] [PubMed] [Google Scholar]
- 12. Weinberger MH, Fineberg NS, Fineberg SE, Weinberger M. Salt sensitivity, pulse pressure, and death in normal and hypertensive humans.. Hypertension 2001;37:429–432 [DOI] [PubMed] [Google Scholar]
- 13. Wright JT, Jr., Rahman M, Scarpa A, Fatholahi M, Griffin V, Jean-Baptiste R, Islam M, Eissa M, White S, Douglas JG. Determinants of salt sensitivity in black and white normotensive and hypertensive women. Hypertension 2003;42:1087–1092 [DOI] [PubMed] [Google Scholar]
- 14. Obarzanek E, Proschan MA, Vollmer WM, Moore TJ, Sacks FM, Appel LJ, Svetkey LP, Most-Windhauser MM, Cutler JA. Individual blood pressure responses to changes in salt intake: Results from the dash-sodium trial. Hypertension 2003;42:459–467 [DOI] [PubMed] [Google Scholar]
- 15. He J, Gu D, Chen J, Jaquish CE, Rao DC, Hixson JE, Chen J-c, Duan X, Huang J-f, Chen C-S, Kelly TN, Bazzano LA, Whelton PK, GenSalt Collaborative Research G Gender difference in blood pressure responses to dietary sodium intervention in the gensalt study. J Hypertens 2009;27:48–54 [DOI] [PMC free article] [PubMed] [Google Scholar]
- 16. Chen J, Gu D, Huang J, Rao DC, Jaquish CE, Hixson JE, Chen C-S, Chen J, Lu F, Hu D, Rice T, Kelly TN, Hamm LL, Whelton PK, He J, GenSalt Collaborative Research G Metabolic syndrome and salt sensitivity of blood pressure in non-diabetic people in china: A dietary intervention study. Lancet 2009;373:829–835 [DOI] [PMC free article] [PubMed] [Google Scholar]
- 17. Pechere-Bertschi A, Maillard M, Stalder H, Brunner HR, Burnier M. Renal segmental tubular response to salt during the normal menstrual cycle. Kidney Int 2002;61:425–431 [DOI] [PubMed] [Google Scholar]
- 18. Hinojosa-Laborde C, Lange DL, Haywood JR. Role of female sex hormones in the development and reversal of dahl hypertension. Hypertension 2000;35:484–489 [DOI] [PubMed] [Google Scholar]
- 19. Mendelsohn ME, Karas RH. The protective effects of estrogen on the cardiovascular system. NEJM 1999;340:1801–1811 [DOI] [PubMed] [Google Scholar]
- 20. Zhao L, Stamler J, Yan LL, Zhou B, Wu Y, Liu K, Daviglus ML, Dennis BH, Elliott P, Ueshima H, Yang J, Zhu L, Guo D, Group IR. Blood pressure differences between northern and Southern Chinese: Role of dietary factors: The international study on macronutrients and blood pressure. Hypertension 2004;43:1332–1337 [DOI] [PMC free article] [PubMed] [Google Scholar]
- 21. GenSalt Collaborative Research G Gensalt: Rationale, design, methods and baseline characteristics of study participants.. J Hum Hypertens 2007;21:639–646 [DOI] [PMC free article] [PubMed] [Google Scholar]
- 22. Perloff D, Grim C, Flack J, Frohlich ED, Hill M, McDonald M, Morgenstern BZ. Human blood pressure determination by sphygmomanometry. Circulation 1993;88:2460–2470 [DOI] [PubMed] [Google Scholar]
- 23. Barrett JC, Fry B, Maller J, Daly MJ. Haploview: Analysis and visualization of ld and haplotype maps. Bioinformatics 2005;21:263–265 [DOI] [PubMed] [Google Scholar]
- 24. Nishida N, Koike A, Tajima A, Ogasawara Y, Ishibashi Y, Uehara Y, Inoue I, Tokunaga K. Evaluating the performance of affymetrix snp array 6.0 platform with 400 Japanese individuals. BMC Genomics 2008;9:431 [DOI] [PMC free article] [PubMed] [Google Scholar]
- 25. Chen Z, Yuhanna IS, Galcheva-Gargova Z, Karas RH, Mendelsohn ME, Shaul PW. Estrogen receptor alpha mediates the nongenomic activation of endothelial nitric oxide synthase by estrogen. J Clin Invest 1999;103:401–406 [DOI] [PMC free article] [PubMed] [Google Scholar]
- 26. Mendelsohn ME, Rosano GMC. Hormonal regulation of normal vascular tone in males. Circ Res 2003;93:1142–1145 [DOI] [PubMed] [Google Scholar]
- 27. Pare G, Krust A, Karas RH, Dupont S, Aronovitz M, Chambon P, Mendelsohn ME. Estrogen receptor-alpha mediates the protective effects of estrogen against vascular injury. Circ Res 2002;90:1087–1092 [DOI] [PubMed] [Google Scholar]
- 28. Lehrer S, Rabin J, Kalir T, Schachter BS. Estrogen receptor variant and hypertension in women. Hypertension 1993;21:439–441 [DOI] [PubMed] [Google Scholar]
- 29. Ellis JA, Infantino T, Harrap SB. Sex-dependent association of blood pressure with oestrogen receptor genes eralpha and erbeta. J Hypertens 2004;22:1127–1131 [DOI] [PubMed] [Google Scholar]
- 30. Peter I, Shearman AM, Zucker DR, Schmid CH, Demissie S, Cupples LA, Larson MG, Vasan RS, D’Agostino RB, Karas RH, Mendelsohn ME, Housman DE, Levy D. Variation in estrogen-related genes and cross-sectional and longitudinal blood pressure in the framingham heart study. J Hypertens 2005;23:2193–2200 [DOI] [PubMed] [Google Scholar]
- 31. Xu H, Hou X, Wang N, Hui B, Jin J, Yun S, Wang X, He X, He J, Zhang S, Han Y. Gender-specific effect of estrogen receptor-1 gene polymorphisms in coronary artery disease and its angiographic severity in Chinese population. Clin Chim Acta 2008;395:130–133 [DOI] [PubMed] [Google Scholar]
- 32. Tamura M, Nakayama T, Sato I, Sato N, Izawa N, Hishiki M, Mizutani Y, Furuya K, Yamamoto T. Haplotype-based case-control study of estrogen receptor alpha (esr1) gene and pregnancy-induced hypertension. Hypertens Res 2008;31:221–228 [DOI] [PubMed] [Google Scholar]
- 33. Hayashi K, Maeda S, Iemitsu M, Otsuki T, Sugawara J, Tanabe T, Miyauchi T, Kuno S, Ajisaka R, Matsuda M. Sex differences in the relationship between estrogen receptor alpha gene polymorphisms and arterial stiffness in older humans. Am J Hypertens 2007;20:650–656 [DOI] [PubMed] [Google Scholar]
- 34. Molvarec A, Ver A, Fekete A, Rosta K, Derzbach L, Derzsy Z, Karadi I, Rigo J., Jr Association between estrogen receptor alpha (esr1) gene polymorphisms and severe preeclampsia. Hypertens Res 2007;30:205–211 [DOI] [PubMed] [Google Scholar]
- 35. Figtree GA, Kindmark A, Lind L, Grundberg E, Speller B, Robinson BG, Channon KM, Watkins H. Novel estrogen receptor alpha promoter polymorphism increases ventricular hypertrophic response to hypertension. J Steroid Biochem Mol Biol 2007;103:110–118 [DOI] [PubMed] [Google Scholar]
- 36. Shearman AM, Cooper JA, Kotwinski PJ, Humphries SE, Mendelsohn ME, Housman DE, Miller GJ. Estrogen receptor alpha gene variation and the risk of stroke. Stroke 2005;36:2281–2282 [DOI] [PubMed] [Google Scholar]
- 37. Shearman AM, Cupples LA, Demissie S, Peter I, Schmid CH, Karas RH, Mendelsohn ME, Housman DE, Levy D. Association between estrogen receptor alpha gene variation and cardiovascular disease. JAMA 2003;290:2263–2270 [DOI] [PubMed] [Google Scholar]
- 38. Xu Z, Taylor JA. Snpinfo: Integrating gwas and candidate gene information into functional snp selection for genetic association studies. Nucleic Acids Res 2009;37:W600–W605 [DOI] [PMC free article] [PubMed] [Google Scholar]
- 39. Ma Y, Qiao X, Falone AE, Reslan OM, Sheppard SJ, Khalil RA. Gender-specific reduction in contraction is associated with increased estrogen receptor expression in single vascular smooth muscle cells of female rat. Cell Physiol Biochem 2010;26:457–470 [DOI] [PMC free article] [PubMed] [Google Scholar]
- 40. Hodges YK, Tung L, Yan XD, Graham JD, Horwitz KB, Horwitz LD. Estrogen receptors alpha and beta: Prevalence of estrogen receptor beta mrna in human vascular smooth muscle and transcriptional effects. Circulation 2000;101:1792–1798 [DOI] [PubMed] [Google Scholar]