Abstract
Background
Angiotensinogen (AGT) is synthesized in the liver and proximal tubule. AGT overexpression at either site might increase blood pressure (BP). We used transgenic mice with AGT overexpression in proximal tubule (K), liver (L), or both sites (KL) to determine the relative contributions of hepatic- and proximal tubule–derived AGT in modulating BP.
Methods
Hepatic AGT overexpression was obtained using the albumin enhancer promoter; the kidney androgen protein gene was used for proximal tubule AGT overexpression. BP and renin angiotensin system parameters were examined in male KL, K, L, and wild-type mice on normal and high-sodium diets.
Results
Compared with wild-type mice, K and KL mice had higher BP on normal and high-sodium diets. L mice had similar BP to wild-type mice on a normal-sodium diet, but high sodium intake caused hypertension. There were no differences in plasma AGT, plasma renin concentration, urine volume, or urine sodium excretion between the groups. Urine AGT and angiotensin II (Ang II) excretion were higher in KL and K mice than in L or wild-type mice on a normal-sodium diet and increased with high sodium intake. During high sodium intake, urine AGT and Ang II were higher in all transgenic mice vs wild-type mice.
Conclusions
Mice with liver AGT overexpression manifest salt-sensitive hypertension, whereas mice with renal AGT overexpression are hypertensive regardless of salt intake. Systemic AGT may stimulate endogenous renal AGT synthesis during high sodium intake, leading to hypertension in L mice. This suggests that systemic and renal AGT may interact to modulate BP.
Keywords: angiotensinogen, blood pressure, hypertension, kidney, liver, proximal tubule, transgene.
Synthesis of angiotensinogen (AGT), the principal substrate of the renin angiotensin system (RAS), occurs in the liver and proximal tubule (PT).1 The importance of systemic and PT AGT individually in regulating blood pressure (BP) has been addressed through a series of rodent experiments. Double transgenic mice with systemic human AGT and human renin synthesis show systemic RAS activation and hypertension.2 Further, disruption of hepatic AGT synthesis results in fatal hypotension after birth3 that is rescued by instilling systemic human AGT and human renin synthesis.4 PT-specific overexpression of human AGT and human renin in mice leads to hypertension despite normal levels of circulating angiotensin II (Ang II).5 Similarly, mice with PT-specific rat AGT overexpression show elevated BP, albuminuria, and renal injury.6 However, all of these animal models used nonmouse AGT and/or renin containing transgenes, a potential issue because cross-species renin–AGT catalytic efficiency varies.7,8 Our group developed a model of liver overexpression of mouse AGT using the albumin enhancer promoter; these animals were mildly hypertensive.9 In addition, we recently demonstrated that overexpression of mouse AGT in PT also causes hypertension.10
The above studies helped delineate the potential importance of systemic and renal AGT in controlling BP; however one question that has not been fully addressed is whether these two AGT systems can influence one another—that is, do they operate jointly or independently? To examine this issue, we evaluated BP and the systemic and renal RAS using transgenic models with AGT overexpression in liver, PT, or in both sites simultaneously.
METHODS
Animal care
All animal studies were conducted with the approval of the University of Utah Animal Care and Use Committee in accordance with the National Institutes of Health Guide for the Care and Use of Laboratory Animals.
Generation of targeted mice
Details on generation of mice with liver-specific and PT-specific expression of AGT are described elsewhere.9,10 In brief, a transgene construct consisting of mouse AGT complementary DNA flanked by the albumin enhancer promoter at the 5’ end and the rabbit β globin intron and poly A at the 3’ end was generated using pBluescript II KS (Stratagene, La Jolla, CA) for hepatic overexpression of AGT (AEP2–mAGT). PT-specific overexpression of AGT was accomplished by introducing mouse AGT complementary DNA into the kidney androgen-regulated protein (KAP) genomic sequence (KAP–mAGT). Both transgene constructs were validated by sequencing. Transgenic mice were created by zygote microinjection of AEP2–mAGT sequence and electroporation of mouse embryonic stem cells with the KAP–mAGT sequence. All mice were bred on a C57BL/6J background for at least 6 generations. Mice with overexpression of AGT in liver (L) were crossbred with PT-specific AGT overexpresser mice (K) to generate overexpression of AGT in both liver and PT (KL). All mice were studied between 16 and 20 weeks of age.
Verification of liver and proximal tubule–specific expression
Total RNA was isolated from a variety of tissues in transgenic and wild-type (WT) mice. Reverse-transcription polymerase chain reaction using primers that only amplified the inserted genes was performed to verify that the targeted gene was selectively expressed in the kidney vs. liver of targeted animals. Reverse transcription polymerase chain reaction primer sequences have been listed in our previous papers.9,10
BP monitoring
BP was recorded by telemetry (TA11-PAC10; Data Sciences International, St. Paul, MN) in 8 animals from each targeted group (K, L, and KL) and 6 WT controls. All mice were housed in individual cages and allowed to recover for 5 days after the surgical procedure. Automated BP and heart rate was recorded continuously for 3 weeks, with measurements taken every 10 minutes. Mice were maintained on a normal-sodium diet (0.25% Na) for 4 days and then changed to a high-sodium diet (3.2% Na). Mice were not handled during BP recording period because even small stimuli may markedly affect BP in mice. Mean arterial pressure was calculated as (1/3 × pulse pressure) + diastolic pressure.
Plasma and urine assays
At the conclusion of BP studies, mice were placed in metabolic cages for measurement of weight, food and water intake, and 24-hour urine collection. A small amount of blood (35 µl) was collected from the dorsal pedal vein in chilled polypropylene tubes containing heparin lithium. Plasma was separated and chilled at −80 °C until assay. Urine samples were centrifuged at 15,000rpm for 15 minutes, and supernatant was frozen in aliquots at −80 °C until assay. Total AGT was analyzed in plasma and urine using a commercially available immunoassay kit (IBL America, Minneapolis, MN). Plasma renin concentration was measured as the amount of angiotensin I (Ang I) generated after incubation with excess porcine AGT using the Ang I enzyme immunoassay (EIA) kit (Bachem, San Carlos, CA). Plasma renin concentration was expressed as the amount of Ang I generated per hour per microliter of plasma. Urinary Ang II levels were determined using an EIA kit (Bachem), and urine sodium was determined using the EasyVet Analyzer (Medica, Bedford, MA). Urinary RAS measurements were adjusted for 24-hour urine volume and expressed as nanograms per day.
Statistical analysis
All results are expressed as mean ± SEM. One-way analysis of variance was used to compare results among the 4 groups on each diet. Paired t test was used to compare differences between normal-sodium and high-sodium diets within each group. We initially analyzed BP separately as daytime BP and nighttime BP to reduce the effects caused by the heterogeneity in activity during the 2 periods. BP daytime and nighttime results parallel the BP trends from 24-hour readings, we present all BP values as 24-hour readings. Trends in BP readings were compared among the 4 groups using mixed effects analysis of variance.
RESULTS
Verification of liver and proximal tubule specific expression
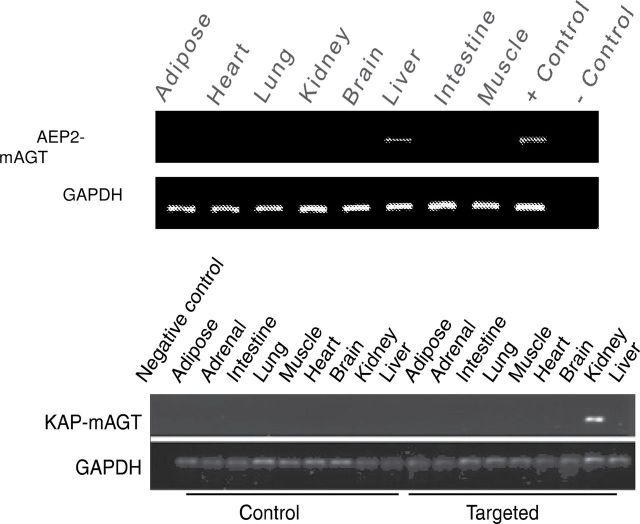
Selective transgene expression of AEP2–mAGT and KAP–mAGT was seen in liver and kidney, respectively, by reverse transcription polymerase chain reaction using primers that selectively amplified the fusion transgenes (Figure 1). Male mice were used for all experiments because the KAP gene is only active in the presence of androgens.
Figure 1.
Verification of organ-specific transgene messenger RNA expression by reverse-transcription polymerase chain reaction in liver (top image) and proximal tubule (bottom panel) angiotensinogen transgenic mice. Representative blots from 4 different mice in each genotype are shown.
Assessment of BP
Mean arterial pressure was higher in KL (106mm Hg) and K mice (105mm Hg) than in L (100mm Hg) and WT mice (96mm Hg) fed normal-sodium diet (Figure 2a). High sodium intake did not alter mean arterial pressure in KL, K, or WT mice but increased mean arterial pressure in L mice (108mm Hg). Similar trends were noted in systolic and diastolic BP in all 4 groups (Figure 2b,c). Systolic BP was higher in K and KL mice (average increase = 12mm Hg) than in WT mice regardless of sodium intake. In contrast, L mice had similar systolic BP as WT mice with normal sodium intake and increased systolic BP with high sodium intake (average increase = 8.5mm Hg). Diastolic BP increased by an average of 9mm Hg in L mice with high sodium intake, whereas it remained unchanged in KL, K, and WT mice (Figure 2c).
Figure 2.
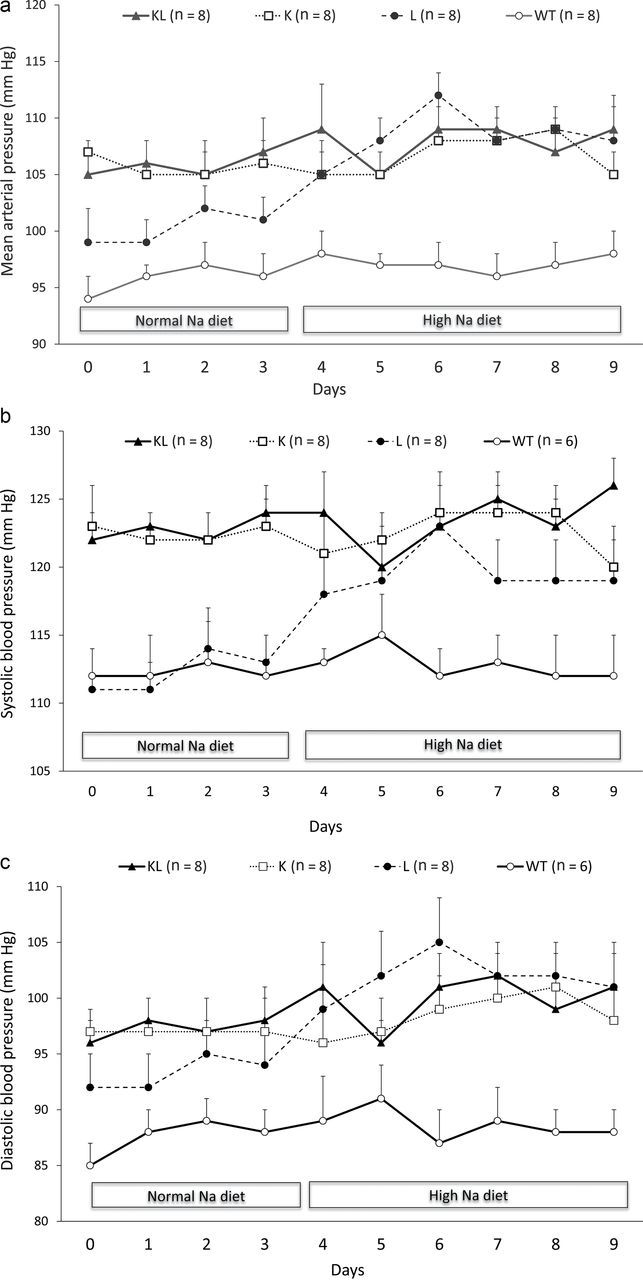
Arterial pressure in angiotensinogen (AGT) transgenic mice. (a) Mean, (b) systolic, and (c) diastolic arterial pressures on normal- (0.25%) and high- (3.2%) sodium (Na) diets in wild-type (WT), proximal tubule AGT (K), liver AGT (L), and both proximal tubule and liver (KL) transgenic mice.
RAS parameters
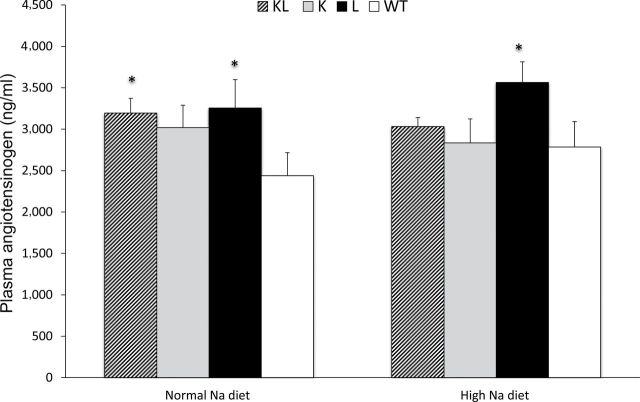
Plasma total AGT levels were increased in L mice, as compared with WT mice, on both a normal- and a high-sodium diet (Figure 3). Plasma AGT was also higher in KL mice than in WT mice on a normal-sodium diet, whereas it was similar to those in WT mice on a high-sodium diet. Plasma AGT levels were not different between WT and K mice. There were no changes in plasma AGT levels within each group with increased sodium intake (comparing normal- with high-sodium diet). On a normal-sodium diet, plasma renin concentration was not significantly different between WT, L, K, and KL mice (Figure 4). Plasma renin concentration decreased similarly in all 4 groups with high sodium intake.
Figure 3.
Plasma angiotensinogen (AGT) levels in transgenic mice on normal- (0.25%) and high- (3.2%) sodium (Na) diets. Abbreviations: K, proximal tubule AGT transgenic mice; KL, both proximal tubule and liver AGT transgenic mice; L, liver AGT transgenic mice; WT, wild-type mice. n = 12–13 all groups. *P < 0.05 vs. WT.
Figure 4.
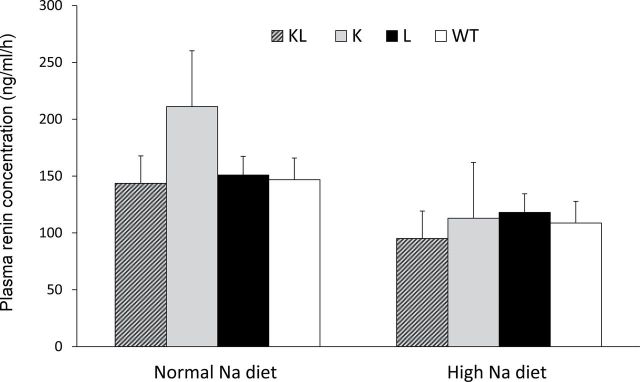
Plasma renin concentration in transgenic mice on normal- (0.25%) and high- (3.2%) sodium (Na) diets. Abbreviations: K, proximal tubule angiotensinogen (AGT) transgenic mice; KL, both proximal tubule and liver AGT transgenic mice; L, liver AGT transgenic mice; WT, wild-type mice. n = 6 (WT) or 8 (all transgenic lines).
Urinary total AGT on a normal sodium intake was significantly elevated in KL (33.9±9.1ng/day) and K (23.2±4.9ng/day) mice as compared with L (3.88±1.3ng/day) or WT (4.85±1.0) mice; urinary AGT excretion was not different between L and WT mice on a normal-sodium diet (Figure 5). Urinary AGT excretion increased in all 4 groups with high sodium intake (407.6±71.5ng/day in KL; 346.8±62.6ng/day in K; 35.6±1.2ng/day in L; 19.5±4ng/day in WT mice). Compared with WT mice, urinary AGT excretion on a high-sodium diet was significantly higher in L, K, and KL mice. Urine Ang II was higher in KL and K mice (0.6±0.2ng/day and 0.72±0.2ng/day, respectively) than in L and WT mice (0.2±0.05ng/day and 0.28±0.03ng/day, respectively) on a normal-sodium diet (Figure 6). High sodium intake increased urine Ang II excretion in KL and L mice (1.60±0.21ng/day and 0.83±0.27ng/day, respectively), although it tended to increase Ang II in all groups (1.07±0.24ng/day in K mice and 0.54±0.19ng/day in WT mice). Compared with WT mice, urinary Ang II excretion on a high-sodium diet was significantly higher in KL, K, and L mice.
Figure 5.
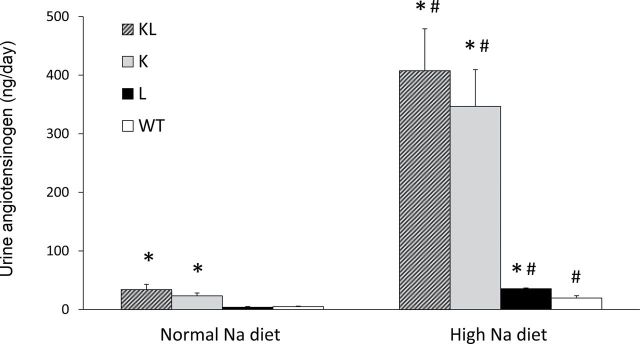
Urinary angiotensinogen (AGT) excretion on normal- (0.25%) and high- (3.2%) sodium (Na) diet in transgenic mice. Abbreviations: K, proximal tubule AGT transgenic mice; KL, both proximal tubule and liver AGT transgenic mice; L, liver AGT transgenic mice; WT, wild-type mice. n = 6 (WT) or 8 (all transgenic lines). *P < 0.05 vs. WT on same diet; #P < 0.05 vs. same genotype on normal Na diet.
Figure 6.
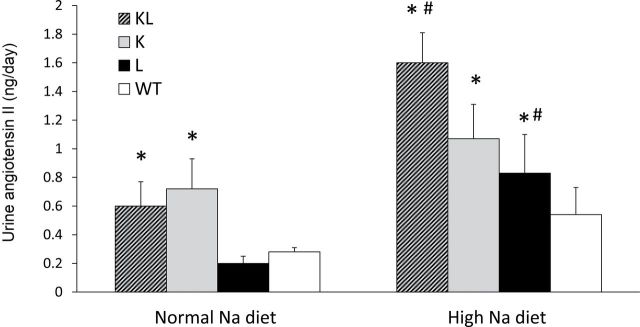
Urinary angiotensin II excretion in transgenic mice on normal- (0.25%) and high- (3.2%) sodium (Na) diets. Abbreviations: K, proximal tubule angiotensinogen (AGT) transgenic mice; KL, both proximal tubule and liver AGT transgenic mice; L, liver AGT transgenic mice; WT, wild-type mice. n = 6 (WT) or 8 (all transgenic lines). *P < 0.05 vs. WT on same diet; #P < 0.05 vs. same genotype on normal Na diet.
Body weight and renal parameters
There were no differences in weight, urine volume, and urine sodium excretion between the 4 groups on normal- or high-sodium diet (Table 1).
Table 1.
Weights, urine volume (UV), and urinary sodium (Na) excretion (UNaV) in mice with no (wild-type (WT)), kidney-specific angiotensinogen (AGT) (K), liver-specific AGT (L), or both transgenes (KL)
| KL | K | L | WT | |
|---|---|---|---|---|
| Normal Na | ||||
| Weight, g | 25.1±0.7 | 23.1±0.4 | 23.8±0.6 | 26.6±0.6 |
| UV, ml/day | 0.7±0.1 | 1.1±0.2 | 0.8±0.1 | 0.8±0.1 |
| UNaV, mmol/day | 79±12 | 115±19 | 98±12 | 95±14 |
| High Na | ||||
| Weight, g | 25.5±0.9 | 24.5±0.4 | 24.7±0.6 | 25.9±0.7 |
| UV, ml/day | 5.1±0.1 | 5.8±0.7 | 5.3±0.7 | 4.4±1.1 |
| UNaV, mmol/day | 2221±429 | 2208±414 | 2791±476 | 1865±681 |
Mice were fed a normal- (0.25%) or high- (3.2%) Na diet. Data are shown on the third day of transitioning to each diet. n = 8 per group.
Discussion
The main purpose of this study was to examine the effect on BP and the RAS of combined vs. individual overexpression of AGT in the liver and/or the PT. The key findings were (i) AGT overexpression in the PT causes similar degrees of hypertension irrespective of coincident AGT overexpression in the liver; (ii) AGT overexpression in the liver alone causes hypertension only during high salt intake; and (iii) hypertension in all mice correlated with urinary AGT levels.
The finding that PT-specific overexpression of AGT causes the same degree of hypertension with or without liver AGT overexpression suggests that renal AGT production, at least under conditions of normal or elevated systemic AGT, has the potential to be a determinant of BP. This finding is in agreement with a previous study by our group examining BP in PT AGT transgenic mice alone.10 It should be noted that Matsusaka and colleagues11 found that mice with liver, but not PT, AGT knockout were hypotensive, suggesting that systemic, but not PT-derived, AGT is of primary importance in maintaining baseline BP. Thus, although clearly speculative, one conclusion from these studies is that systemic AGT and renal AGT may influence BP under different conditions, wherein, at least under normal physiological conditions, systemic AGT is necessary for BP maintenance whereas renal-derived AGT is primarily involved in elevating BP above this baseline level.
In contrast with the PT AGT transgenic mice, liver AGT transgenic mice were not hypertensive on a normal salt diet. One explanation for this is that liver AGT overexpression was relatively modestly increased as compared with PT AGT overexpression. This possibility is supported by the finding that systemic AGT was only mildly, albeit significantly, elevated in liver AGT transgenic mice, whereas PT AGT mice had markedly increased urinary AGT levels. However, liver AGT expression was clearly elevated in that, despite no apparent effect on circulating AGT levels, liver AGT transgenic mice were hypertensive on a high-sodium diet. It is possible that the elevated BP in liver AGT overexpressers was due to a vasoactive response to increased activity of the systemic RAS. An alternative explanation for the salt-sensitive hypertension in liver AGT transgenic mice comes from consideration of the effects of transgene overexpression on urinary AGT levels. As stated above, PT AGT transgenic mice had, as expected, greatly elevated urinary AGT excretion regardless of sodium intake and were hypertensive on both a normal- and high-sodium diet. Indeed, urinary AGT may be so high in PT AGT transgenic mice on a normal-sodium diet that further increases in urinary AGT seen on a high-sodium diet are without effect on BP. In contrast, urinary AGT excretion was not elevated in liver AGT transgenic mice during normal sodium intake but rose significantly above that seen in controls when mice were fed a high-sodium diet. Thus, hypertension was only present in liver AGT transgenic mice when urinary AGT excretion was elevated.
The above observations raise 2 important questions: (i) how does liver AGT overexpression lead to increased urinary AGT excretion; and (ii) what is the biologic significance of urinary AGT. Urinary AGT reflects renal-derived, and not systemic, AGT. Matsusaka and colleagues11 observed no change in urinary AGT excretion in mice with liver-specific knockout of AGT, whereas Kobori et al.12 found no significant human AGT in the urine when rats were infused with human AGT. In addition, Nakano et al. found that systemically infused labeled human AGT was undetectable in mouse or rat urine.13 Nonetheless, the systemic RAS has the potential to modify renal AGT synthesis and urinary AGT excretion. Ang II infusion, through activation of AT1 receptors, increases renal AGT messenger RNA and protein in rats14,15 and mice16,17, whereas Ang II increases AGT messenger RNA levels in cultured rat PT cells.18 Thus, it seems feasible that increased systemic RAS activity, as presumably occurs in liver AGT transgenic mice, could stimulate PT AGT and ultimately urinary AGT levels. It is unclear why no increase in urinary AGT excretion was observed in liver AGT transgenic mice ingesting a normal-sodium diet; however, it is possible that basal renal AGT production on a normal-sodium diet is relatively low, making small changes in AGT levels difficult to detect. In contrast, as has been previously described,19 high sodium intake augments urinary AGT excretion; under these conditions, liver AGT transgenic mice manifested increased urinary AGT excretion, as compared with WT mice fed a similar diet. That high sodium intake appears to increase renal AGT production seems counterintuitive from a BP regulatory standpoint; however, this observation is further supported by the finding that high salt intake increases PT luminal Ang II concentration in the face of reduced systemic Ang II levels.20 Taken together, the above considerations support the notion that the systemic RAS, particularly in conjunction with high sodium intake, can stimulate renal AGT production and increase urinary AGT excretion.
Changes in urinary AGT excretion may affect intrarenal Ang II generation and ultimately influence sodium transport. Both PT and liver AGT transgenic mice (the latter on a high-sodium diet) had increased urinary Ang II excretion associated with elevated urinary AGT levels. Ang II stimulation of nephron sodium reabsorption is well described, including in the PT21 and collecting duct.22 In the PT, luminal AGT may be cleaved by filtered renin, and the resultant Ang II can augment sodium/hyrdogen exchanger activity.23,24 PT-derived AGT may also act downstream due to the effects of proximal tubule luminal Ang II synthesis or to collecting duct-derived renin conversion of AGT;25 luminal Ang II potently increases epithelial sodium channel activity.22
A potential weakness of this study was the necessity of using only male mice. The KAP promoter is activated by androgens; hence we wished to avoid potentially confounding effects of androgen administration to female mice. Another issue is that the magnitude of hypertension was modest in the liver and/or PT AGT transgenic mice. This suggests that, at least under normal physiological conditions, variations in systemic or PT-derived AGT are likely to have a relatively modest, albeit significant, effect on BP. Given the multiplicity of regulatory mechanisms involved in control of the RAS specifically, and BP in general, it is perhaps not surprising that such a scenario exists. In this regard, it is important to note that this study used overexpressed mouse AGT in both transgenic mouse lines, thereby providing the ability for normal mouse compensatory mechanisms to be operative. Finally, this study examined mice with transgenic overexpression of AGT; thus our results must be interpreted as what influence increased AGT production can potentially exert on BP. Further examination of this system could take advantage of the liver- or PT-specific AGT knockout mice; studies with these mice have only been performed on a normal-sodium diet; hence examination of their phenotype under sodium loading, Ang II hypertension, or other conditions will be of substantial interest.
In summary, this study reports that mouse AGT overexpression in the PT causes hypertension regardless of sodium intake, whereas AGT overexpression in the liver caused hypertension only during a high-sodium diet. The presence of hypertension was associated with elevated urinary AGT excretion in both mouse lines. Because urinary AGT likely derives solely from the kidney, these observations suggest that systemic AGT has the potential to regulate renal AGT production. Taken together, our findings provide a novel insight into potential interactions between systemic and renal AGT.
Disclosure
The authors declared no conflict of interest.
Acknowledgment
This research was supported by an NHLBI R01 HL093457 grant (to D.E.K.).
References
- 1. Yang G, Merrill DC, Thompson MW, Robillard JE, Sigmund CD. Functional expression of the human angiotensinogen gene in transgenic mice. J Biol Chem 1994; 269:32497–32502 [PubMed] [Google Scholar]
- 2. Merrill DC, Thompson MW, Carney CL, Granwehr BP, Schlager G, Robillard JE, Sigmund CD. Chronic hypertension and altered baroreflex responses in transgenic mice containing the human renin and human angiotensinogen genes. J Clin Invest 1996; 97:1047–1055 [DOI] [PMC free article] [PubMed] [Google Scholar]
- 3. Smithies O, Kim HS. Targeted gene duplication and disruption for analyzing quantitative genetic traits in mice. Proc Natl Acad Sci USA 1994; 91:3612–3615 [DOI] [PMC free article] [PubMed] [Google Scholar]
- 4. Davisson RL, Kim HS, Krege JH, Lager DJ, Smithies O, Sigmund CD. Complementation of reduced survival, hypotension, and renal abnormalities in angiotensinogen-deficient mice by the human renin and human angiotensinogen genes. J Clin Invest 1997; 99:1258–1264 [DOI] [PMC free article] [PubMed] [Google Scholar]
- 5. Lavoie JL, Lake-Bruse KD, Sigmund CD. Increased blood pressure in transgenic mice expressing both human renin and angiotensinogen in the renal proximal tubule. Am J Physiol Renal Physiol 2004; 286:F965–F971 [DOI] [PubMed] [Google Scholar]
- 6. Sachetelli S, Liu Q, Zhang SL, Liu F, Hsieh TJ, Brezniceanu ML, Guo DF, Filep JG, Ingelfinger JR, Sigmund CD, Hamet P, Chan JS. Ras blockade decreases blood pressure and proteinuria in transgenic mice overexpressing rat angiotensinogen gene in the kidney. Kidney Int 2006; 69:1016–1023 [DOI] [PubMed] [Google Scholar]
- 7. Poulsen K. Kinetics of the renin system. The basis for determination of the different components of the system. Scand J Clin Lab Invest Suppl 1973; 132:3–86 [PubMed] [Google Scholar]
- 8. Poulsen K, Jacobsen J. Is angiotensinogen a renin inhibitor and not the substrate for renin? J Hypertens 1986; 4:65–69 [DOI] [PubMed] [Google Scholar]
- 9. Gociman B, Rohrwasser A, Hillas E, Cheng T, Hunter G, Hunter J, Lott P, Monson S, Ying J, Lalouel JM. Response to genetic manipulations of liver angiotensinogen in the physiological range. J Hum Genet 2008; 53:775–788 [DOI] [PubMed] [Google Scholar]
- 10. Ying J, Stuart D, Hillas E, Gociman BR, Ramkumar N, Lalouel JM, Kohan DE. Overexpression of mouse angiotensinogen in renal proximal tubule causes salt-sensitive hypertension in mice. Am J Hypertens 2012; 25:684–689 [DOI] [PMC free article] [PubMed] [Google Scholar]
- 11. Matsusaka T, Niimura F, Shimizu A, Pastan I, Saito A, Kobori H, Nishiyama A, Ichikawa I. Liver angiotensinogen is the primary source of renal angiotensin II. J Am Soc Nephrol 2012; 23:1181–1189 [DOI] [PMC free article] [PubMed] [Google Scholar]
- 12. Kobori H, Nishiyama A, Harrison-Bernard LM, Navar LG. Urinary angiotensinogen as an indicator of intrarenal angiotensin status in hypertension. Hypertension 2003; 41:42–49 [DOI] [PMC free article] [PubMed] [Google Scholar]
- 13. Nakano D, Kobori H, Burford JL, Gevorgyan H, Seidel S, Hitomi H, Nishiyama A, Peti-Peterdi J. Multiphoton imaging of the glomerular permeability of angiotensinogen. J Am Soc Nephrol 2012; 23:1847–1856 [DOI] [PMC free article] [PubMed] [Google Scholar]
- 14. Kobori H, Harrison-Bernard LM, Navar LG. Enhancement of angiotensinogen expression in angiotensin II-dependent hypertension. Hypertension 2001; 37:1329–1335 [DOI] [PMC free article] [PubMed] [Google Scholar]
- 15. Kobori H, Harrison-Bernard LM, Navar LG. Urinary excretion of angiotensinogen reflects intrarenal angiotensinogen production. Kidney Int 2002; 61:579–585 [DOI] [PMC free article] [PubMed] [Google Scholar]
- 16. Gonzalez-Villalobos RA, Satou R, Ohashi N, Semprun-Prieto LC, Katsurada A, Kim C, Upchurch GM, Prieto MC, Kobori H, Navar LG. Intrarenal mouse renin-angiotensin system during Ang II–induced hypertension and ACE inhibition. Am J Physiol 2010; 298:F150–F157 [DOI] [PMC free article] [PubMed] [Google Scholar]
- 17. Gonzalez-Villalobos RA, Seth DM, Satou R, Horton H, Ohashi N, Miyata K, Katsurada A, Tran DV, Kobori H, Navar LG. Intrarenal angiotensin II and angiotensinogen augmentation in chronic angiotensin II-infused mice. Am J Physiol 2008; 295:F772–F779 [DOI] [PMC free article] [PubMed] [Google Scholar]
- 18. Ingelfinger JR, Jung F, Diamant D, Haveran L, Lee E, Brem A, Tang SS. Rat proximal tubule cell line transformed with origin-defective sv40 DNA: autocrine Ang II feedback. Am J Physiol 1999; 276:F218–F227 [DOI] [PubMed] [Google Scholar]
- 19. Lantelme P, Rohrwasser A, Gociman B, Hillas E, Cheng T, Petty G, Thomas J, Xiao S, Ishigami T, Herrmann T, Terreros DA, Ward K, Lalouel JM. Effects of dietary sodium and genetic background on angiotensinogen and renin in mouse. Hypertension 2002; 39:1007–1014 [DOI] [PubMed] [Google Scholar]
- 20. Thomson SC, Deng A, Wead L, Richter K, Blantz RC, Vallon V. An unexpected role for angiotensin ii in the link between dietary salt and proximal reabsorption. J Clin Invest 2006; 116:1110–1116 [DOI] [PMC free article] [PubMed] [Google Scholar]
- 21. McDonough AA. Mechanisms of proximal tubule sodium transport regulation that link extracellular fluid volume and blood pressure. Am J Physiol 2010; 298:R851–R861 [DOI] [PMC free article] [PubMed] [Google Scholar]
- 22. Peti-Peterdi J, Warnock DG, Bell PD. Angiotensin II directly stimulates enac activity in the cortical collecting duct via AT(1) receptors. J Am Soc Nephrol 2002; 13:1131–1135 [DOI] [PubMed] [Google Scholar]
- 23. Reilly AM, Harris PJ, Williams DA. Biphasic effect of angiotensin II on intracellular sodium concentration in rat proximal tubules. Am J Physiol 1995; 269:F374–F380 [DOI] [PubMed] [Google Scholar]
- 24. Saccomani G, Mitchell KD, Navar LG. Angiotensin II stimulation of Na+–H+ exchange in proximal tubule cells. Am J Physiol 1990; 258: F1188–F1195 [DOI] [PubMed] [Google Scholar]
- 25. Navar LG, Kobori H, Prieto MC, Gonzalez-Villalobos RA. Intratubular renin-angiotensin system in hypertension. Hypertension 2011; 57:355–362 [DOI] [PMC free article] [PubMed] [Google Scholar]


