

Abstract
RNA triphosphatases are attractive and mostly unexplored therapeutic targets for the development of broad spectrum antiprotozoal, antiviral and antifungal agents. The use of malachite green as a readout for phosphatases is well characterized and widely employed. However, the reaction depends on high quantities of inorganic phosphate to be generated, which makes this assay not easily amenable to screening in 1536-well format. The overly long reading times required also prohibit its use to screen large chemical libraries. To overcome these limitations, we sought to develop a fluorescence polarization (FP) -based assay for triphosphatases, compatible with miniaturization and fast readouts. For this purpose, we took advantage of the nucleoside triphosphatase activity of this class of enzyme to successfully adapt the Transcreener™ ADP assay based on the detection of generated ADP by immunocompetition fluorescence polarization to the RNA triphosphatase TbCet1 in 1536-well format. We also tested the performance of this newly developed assay in a pilot screen of 3,000 compounds and we confirmed the activity of the obtained hits. We present and discuss our findings and their importance for the discovery of novel drugs by high-throughput screening.
Keywords: triphosphatase, drug discovery, high-throughput screening, fluorescence polarization
Introduction
RNA triphosphatases constitute an important class of phosphatases involved in the formation of 5′ m7GpppN cap structures (7-methyl guanosine linked by a 5′-5′ triphosphate bridge to the first nucleoside of the transcript) in eukaryotic cellular and viral mRNA1. RNA triphosphatase activity is essential for mRNA stability and translation2. Interestingly, RNA triphosphatases are not conserved among eukarya: fungi, viruses and protozoan parasites have mechanistically and structurally distinct RNA triphosphatase enzymes compared to higher eukaryotes, including mammals1. For example, characterization of the RNA triphosphatase TbCet1 from the protozoan parasite Trypanosoma brucei responsible for the sleeping sickness revealed that TbCet1 and the RNA triphosphatases of fungi and the malaria parasite Plasmodium falciparum belong to the same family, but are unrelated to RNA triphosphatases of plants and metazoans. This distinction makes RNA triphosphatases such as Tbcet1 exciting targets for the development of broad spectrum antiprotozoal and antifungal drugs3, 4. In addition, because the mRNA cap plays a central role in gene expression for eukaryotes, a drug targeting TbCet1 would most likely be effective at all stages of the parasite life cycle. Surprisingly, despite the obvious therapeutic interest of this class of enzyme, to our knowledge no high-throughput screen for RNA triphosphatases has been reported to date, perhaps due to the lack of an assay amenable to HTS.
A number of methods have been developed and are available for measuring phosphatase activities through quantification of released inorganic phosphate5. Although the most sensitive method remains the acid precipitation of a phosphor-protein substrate containing bound radioactive phosphate and determination of the released radioactivity counts in the supernatant, it is severely handicapped by the heterogeneous nature of the assay, the use of radioactive material, its associated cost, and its lack of distinction between phosphatase-mediated release of phosphate versus proteolysis-induced and acid soluble phosphopeptide products5. A variation on this approach consists of using a scintillation proximity assay (SPA). One report describes the development of such an assay for the yeast RNA triphosphatase Cet1p in 96-well format by measuring the release of 33P from radiolabeled GTP using SPA beads6. Despite being compatible with HTS, the SPA technology relies on the use of radioactive material and is not easily amenable to 1536- well format. Other methods described to assay phosphatases rely on using HPLC or TLC, which are not compatible with HTS7,8. Immunoassays developed to measure phosphatase activity, being heterogeneous by nature, are also not well suited for HTS7. By far the most established method to assay phosphatases relies on the use of malachite green to quantify the amount of phosphomolybdate formed at 630 nm in presence of inorganic phosphate released by the enzyme7 (Figure 1A). Despite being adaptable to 96-well format7 and even to 384-well format based on our experience, further miniaturization is prohibited by intrinsic limitations of the malachite green assay due to its reliance on an absorbance readout. The limited sensitivity of the absorbance readout requires a minimum volume that is incompatible with high density 1536-well microplates. Furthermore, even when performed in 384-well format, the overly long reading time per plate limits the throughput attainable when using the malachite green assay. A need therefore exists for a triphosphatase assay compatible with HTS in high density format
Figure 1.

Principle of the phosphatase assays described in this article. (A) Malachite green assay. (B) Transcreener™ ADP fluorescence polarization assay.
The Transcreener™ assay platform developed by BellBrook Labs (Madison, WI) relies on fluorescence polarization detection of the invariant reaction product of a group transfer reaction e.g. a nucleotide through immunocompetition with a labeled tracer bound to an antibody, and has been suggested as a novel screening strategy to search for inhibitors of those enzymes involved in catalyzing phosphorylation, glycosylation, sulfonation, methylation and acetylation9. Huss and coworkers have recently adapted the Transcreener™ ADP assay kit to screen for inhibitors of kinases. They used protein kinase A as part of their primary evaluation and have shown comparable results when compared to data obtained with the classical radioactive filter-binding assay10. They further reported a developmental effort in configuring assays for 14 other kinase targets including exemplars of serine, threonine and tyrosine kinase families; four of the configured assays were successfully screened against chemical libraries ranging in size from 15,000 to 80,000 compounds without any observed compound optical interference with the red-shifted ADP tracer10. In light of the successful adaptation of the Transcreener™ ADP assay in HTS at least for these reported kinases, and based on the observation that RNA triphosphatases belong to a family of metal-dependent phosphohydrolases able to hydrolyze nucleoside triphosphates to nucleoside diphosphates3, we sought to develop a homogeneous and sensitive assay for triphosphatases such as TbCet1 using the Transcreener™ technology. Since TbCet1 can utilize ATP as a substrate and generate ADP as a product, we intended to measure the generated ADP using the Transcreener™ ADP assay, as it is common for both kinases and triphosphatases such as TbCet1 (Figure 1B). If successful, triphosphatases could be added to this novel platform. In this article, we describe the development of an FP assay using the Transcreener™ technology for the screening of TbCet1 inhibitors. We also report the miniaturization of the assay to 1536-well format making it amenable to the screening of large chemical libraries. We present the results of this novel screening technology and report on the performance of the assay in a pilot screen of about 3,000 compounds.
Materials and Methods
Reagents
Tris-HCl, MgCl2, DTT, MnCl2, DMSO, BSA, EDTA, malachite green, ATP and ammonium molybdate were purchased from Sigma-Aldrich Co. Tween 20 was purchased from Pierce Inc. Transcreener™ ADP Assay Plus kits were provided by Bellbrook Labs (Madison, WI). TbCet1 was provided by Dr. Stewart Shuman (Molecular Biology Program, Sloan-Kettering Institute).
Transcreener™ ADP assay enzyme titration protocol
For the optimization of enzyme concentration, the Transcreener™ ADP assay was performed in 384-well format in a final volume of 10 μL as follows. Controls were added to the wells of a 384-well microplate (Low Volume Round Bottom NBS Treated, Corning #3676) at a volume of 0.5 μL and consisted of EDTA to reach a final concentration of 40 mM in 1% DMSO (v/v) (+EDTA, Figure 2A), or DMSO to reach a final concentration of 1% (v/v) in absence of ATP addition (no ATP, Figure 2A). TbCet1 was diluted in the assay buffer (50 mM Tris-Hcl pH 8.0, 20 mM MgCl2, 4 mM MnCl2, 0.02 mg/mL BSA, 2 mM DTT, 0.005% Tween 20) and 2.5 μL were added to the wells. After addition of the enzyme, the microplate was preincubated for one hour at room temperature. Then 2 μL ofATP in solution in assay buffer (or buffer for the no ATP control) were added to the wells to reach a final concentration of 50 μM. After two hours incubation at room temperature, 5 μL of a “Stop & Detect” solution comprising of the ADP antibody (50 μg/mL final) and of the far red tracer were added to the reaction. The fluorescence polarization was read after another hour incubation using the Amersham LEADseeker™ Multimodality Imaging System equipped with Cy5 excitation/emission filters (λex. = 630/30 nm ; λem. = 680/30 nm), Cy5 FP epi-mirror and Cy5 emission dichroic. The system was calibrated as per the manufacturer’s recommendations using two uniformly dispensed well-plates: a buffer background and a solution of the dye in the same buffer. The saved background image was automatically subtracted, calibration correction applied, and the system outputs I||, I⊥, Itotal and mP values of each well according to Polarization (mP) = 1000 × (I|| − G × I⊥) / (I|| + G × I⊥) with I|| = Intensity of fluorescence parallel configuration; I⊥ = Intensity of fluorescence perpendicular configuration; and G = “G-factor” (optical normalization).
Figure 2.

Transcreener™ ADP assay development. (A) Optimization of enzyme concentration. ATP concentration was 50 μM for all conditions. No ATP: 57 nM enzyme and assay buffer replacing ATP; +EDTA: 57 nM enzyme and 40 mM EDTA (final). (B) Optimization of ATP concentration. Enzyme concentration was 0.14 nM for all conditions. No ATP: assay buffer replacing ATP; +EDTA: +40 mM EDTA (final).
Transcreener™ ADP assay ATP titration protocol
For the optimization of ATP concentration, the Transcreener™ ADP assay was performed in 384-well format in a final volume of 10 μL as follows. Controls were added to the wells of a 384-well microplate (Low Volume Round Bottom NBS Treated, Corning #3676) at a volume of 0.5 μL and consisted of EDTA to reach a final concentration of 40 mM in 1% DMSO (v/v) (+EDTA, Figure 2B), or DMSO to reach a final concentration of 1% (v/v) in absence of ATP addition (no ATP, Figure 2B). TbCet1 was diluted in the assay buffer (50 mM Tris-Hcl pH 8.0, 20 mM MgCl2, 4 mM MnCl2, 0.02 mg/mL BSA, 2 mM DTT, 0.005% Tween 20) and 2.5 μL were added to the wells for a final concentration of 0.14 nM. After addition of the enzyme, the microplate was preincubated for one hour at room temperature. Then 2 μL of ATP in solution in assay buffer (or buffer for the no ATP control) were added to the wells. After two hours incubation at room temperature, 5 μL of a “Stop & Detect” solution comprising and of the far red tracer and of the ADP antibody were added to the reaction. To wells with ATP concentrations of 1, 10, 50 or 100 μM were added final concentrations of ADP antibody of respectively 3, 20, 50 and 75 μg/ml as per the manufacturer’s recommendations. The fluorescence polarization was read after another hour incubation using the Amersham LEADseeker™ Multimodality Imaging System, as described above.
Transcreener™ ADP assay dose-response studies
For dose-response studies, the Transcreener™ ADP assay was performed in 384-well format in a final volume of 20 μL as follows. Tested compounds or high/low controls were added to the wells at a volume of 1 μL. Low controls consisted of EDTA at a final concentration of 40 mM in 1% DMSO (v/v). High controls consisted of 1% DMSO (v/v). TbCet1 was diluted in the assay buffer (50 mM Tris-Hcl pH 8.0, 20 mM MgCl2, 4 mM MnCl2, 0.02 mg/mL BSA, 2 mM DTT, 0.005% Tween 20), and 5 μL were added to the 384-well microplates (Low Volume Round Bottom NBS Treated, Corning #3676) to reach a final concentration of 0.14 nM. After addition of the enzyme, the 384-well microplates were preincubated for one hour at room temperature. Then 4 μL of ATP in solution in assay buffer were added to the wells for a final concentration of 50 μM. After three hours incubation at room temperature, 10 μL of a “Stop & Detect” solution prepared according to the manufacturer’s recommendations comprising of the ADP antibody (50 μg/mL final) and of the far red tracer were added to the wells. The fluorescence polarization was read after another hour incubation using the Amersham LEADseeker™ Multimodality Imaging System as described above.
Pilot screen using the Transcreener™ ADP assay assay
For the pilot screen, the Transcreener™ ADP assay was performed in 1536-well format (black polystyrene, Corning #3724) according to the following protocol. Tested compounds or high/low controls were added to the wells at a volume of 0.5 μL using a custom designed 384 head on a TPS-384 Total Pipetting Solution (Apricot Designs, USA). Compounds were tested at a final concentration of 10 μM. Low controls consisted of EDTA at a final concentration of 40 mM in 1% DMSO (v/v). High controls consisted of 1% DMSO (v/v). TbCet1 diluted in the assay buffer was dispensed at a volume of 2.5 μL for a final concentration of 0.14 nM using a FlexDrop IV (Perkin Elmer, USA). After one hour preincubation, 2 μL of ATP in solution in assay buffer were added to the wells for a final concentration of 50 μM. After three hours incubation at room temperature, 5 μL of a “Stop & Detect” solution prepared according to the manufacturer’s recommendations comprising of the ADP antibody (50 μg/mL final) and the far red tracer were added to the wells. The readout was performed one hour later as described above. The percentage inhibition for the tested compounds was calculated as defined as % inhibition = (high control average – read value) / (high control average – low control average) × 100 based on the average of the 64 high and 64 low controls present on the same plate.
Confirmation studies
Quench tests in the Transcreener™ ADP assay were performed in duplicate by measuring the fluorescence intensity of wells containing the probe, pre- and post-addition of the compounds at 10 μM. Compounds inducing a variation of signal greater than 20% were flagged as optically-active compounds.
Dose response studies
In the Transcreener™ ADP assay, the inhibition of probe binding induced by the compounds was expressed as a percentage compared to high and low controls located on the same plate, as defined as % inhibition = (high control average – read value) / (high control average – low control average) × 100. The dose response was assessed in duplicate and using 12 point doubling dilutions with 10 μM compound concentration as the upper limit. The dose response curve for each set of data was fitted seperately, and the two IC50 values obtained were averaged. This allowed us to calculate the IC50 for the tested compounds.
Statistical Analysis
The Z′ factor was used to assess assay performance as previously described11.
Chemical Libraries, Automation System & Screening Data Management
The library used for the pilot screen combines 3,119 chemicals obtained commercially from Prestwick and MicroSource. The MicroSource Library contains 2,000 biologically active and structurally diverse compounds from known drugs, experimental bioactives, and pure natural products. The library includes a reference collection of 160 synthetic and natural toxic substances (inhibitors of DNA/RNA synthesis, protein synthesis, cellular respiration, and membrane integrity), a collection of 80 compounds representing classical and experimental, pesticides, herbicides, and endocrine disruptors, a unique collection of 720 natural products and their derivatives. The collection includes simple and complex oxygen heterocycles, alkaloids, sequiterpenes, diterpenes, pentercyclic triterpenes, sterols, and many other diverse representatives. The Prestwick Chemical Library is a unique collection of 1,119 high purity chemical compounds, all off patent and carefully selected for structural diversity and broad spectrum, covering several therapeutic areas from neuropsychiatry to cardiology, immunology, anti-inflammatory, analgesia and more, with known safety, and bioavailability in humans. The library is constituted of 90% of marketed drugs and 10% bioactive alkaloids or related substances.
The screen was performed on a fully automated linear track robotic platform (CRS F3 Robot System, Thermo Fisher Scientific, USA) using several integrated peripherals for plate handling, liquid dispensing, and fluorescence detection. Screening data files from the LEADseeker™ Multimodality Imaging System or from the SpectraMax Plus 384 were loaded into the HTS Core Screening Data Management System, a custom built suite of modules for compound registration, plating, data management, and powered by ChemAxon Cheminformatic tools (ChemAxon, Hungary).
Results
Assay Development
Previous work in the laboratory had led to optimized malachite green assay conditions for TbCet1 in a minimal final volume of 50 μL in 384-well microplate format, and requiring a final concentration of TbCet1 of 14 nM. Because we wanted to minimize the amount of enzyme required for screening, the first step in our efforts to adapt the Transcreener™ technology to the assay of TbCet1 in 1536-well format consisted in optimizing the enzyme concentration. Assay development was performed in 384-well format in a final volume of 10 μL for future direct transition to 1536-format. For this purpose, we tested the reaction kinetics for different concentrations of enzyme ranging from 0.57 nM to 57 nM in the 5 μL reaction. Using 57 nM enzyme, we observed an assay window of about 100 mPs between the fluorescence polarization for the high (1% DMSO [v/v]) and low controls (40 mM EDTA in 1% DMSO [v/v]) (Figure 2A). We were surprised to find that the same assay window was reached after only 15 minutes of reaction even at the lower enzyme concentration tested of 0.57 nM (Figure 2A). For this reason, we decided to lower the enzyme concentration in reaction to 0.14 nM, compared to 57 nM in the malachite green assay. The next step during assay development consisted in optimizing the ATP concentration. Using 0.14 nM enzyme for all conditions, we tested four ATP concentrations: 1, 10, 50 and 100 μM in conjunction with the following ADP antibody concentrations: 3, 20, 50 and 75 μg/ml respectively, as per the manufacturer’s recommendations. At 1 μM ATP, the probe was fully displaced after only 15 min reaction, as indicated by the low polarization of 50 mP observed at the 15 minutes timepoint, and throughout the 2 hour reaction (Figure 2B). At 10, 50 or 100 μM, we observed a time-dependent displacement of the probe (Figure 2B). Based on this observation we selected the intermediate concentration of ATP of 50 μM for the assay, in conjunction with a concentration of ADP antibody of 50 μg/mL and a reaction time of 3 hours for an optimum signal window. In the malachite green assay, the concentration of ATP required for the assay was much higher (2 mM). The optimized conditions for the Transcreener™ ADP assay are summarized and compared to the malachite green assay in Table 1.
Table 1.
Comparison of the malachite green and Transcreener™ ADP assay characteristics after optimization. The malachite green assay relying on an absorbance readout limits its use to 384-microtiter plates. The Transcreener™ ADP assay was successfully miniaturized in 1536 format.
| Malachite green | Transcreener™ ADP | |
|---|---|---|
| microtiter plate format | 384 | 1536 |
| minimal final volume | 50 μl | 10 μl |
| amount of enzyme required per well | 5 ng | 0.025 ng |
| amount of enzyme required to screen a 300,00 compound library | 1.5 mg | 8 μg |
| ATP concentration in reaction | 2 mM | 50 μM |
| readout | Absorbance at 630 nm | AlexaFluor® 633 FP |
| total assay time | 2h | 5h* |
The assay was optimized to minimize the enzyme concentration; a shorter reaction time could be achieved by using more enzyme.
Evaluation of Assay Robustness
In order to evaluate the robustness of the newly developed Transcreener™ ADP assay in high density format, we performed a control run consisting of 1,536 data points for the high-controls (1% DMSO [v/v]) and 1,536 data points for the low-controls (40 mM EDTA in 1% DMSO [v/v]) in a final volume of 10 μL in 1536-well format (Figure 3A). The assay performance was evaluated by measuring the coefficients of variation (CVs) and the Z′ factor as previously described11. We found that both high-and low-control data points showed acceptable variability, with CVs of 20 and 6% for the high and low controls respectively. Together with an assay window of 140 mP, this result translated into a Z′ value of 0.54, indicative of good assay performance and robustness, compatible with HTS.
Figure 3.

(A) Assessment of the robustness of the Transcreener™ ADP assay in 1536-well format microplates with 1,536 high controls (H) and 1,536 low controls (L). High controls consist of 1% DMSO (v/v) and low controls consist of 50 mM EDTA. (B) Assessment of the reproducibility of the Transcreener™ ADP assay: scatter plot analysis of the percentage inhibition obtained for each compound in the duplicate sets of the pilot screen. 47 positives at an average percentage inhibition of 50% were identified. One compound was not represented in this graph because of obvious interference in the assay.
Pilot screen
In order to evaluate the reproducibility of the newly developed Transcreener™ ADP assay in the conditions of screening, we then performed a pilot screen of 3,119 compounds. The collection includes known drugs and is composed of synthetic as well as natural compounds. The library was pre-plated in three 1536-well plates, with columns 25, 26, 27 and 28 left empty for the addition of high- and low-control wells, allowing monitoring of assay performance during the automated screening run (Figure 4). The pilot screen was carried out on our robotic platform on two separate days against the same set of compounds to assess day-to-day variability. The compound screening concentration was 10 μM in 1% DMSO (v/v). This validation step allowed us to obtain field data on assay performance as well as an estimate of the initial hit rate and an overall assessment of compound optical interference. Most important, we could evaluate the assay reproducibility by comparing the two data sets to identify the outliers that hit on one day but not on the other. The results were plotted as a scatter plot (Figure 3B). We selected the positives on the basis of their reproducible inhibition on both day 1 and 2: at an average inhibition threshold of 50%, an initial positive hit rate of 1.7% yielded 47 positives.
Figure 4.

Example of two duplicate assay plates read during the pilot screen using the adapted Transcreener™ ADP assay. High and low controls, positives and fluorescent compounds are highlighted.
Confirmation of the positives
We chose 45 compounds out of 47 positives for further evaluation. We evaluated the 45 positives in a series of confirmatory tests in order to exclude any false positives as part of our positive to hit confirmation work flow12. Insoluble aggregates can disrupt biological activity through nonspecific interactions. Therefore, assessing the poor solubility of a compound in the assay conditions is important for identifying potentially false positives. We routinely employ laser nephelometry as a reliable and sensitive technique for the measurement of solubility in the 384-well plate format. None of the 45 resupplied compounds had a solubility limit lower than 50 μM, ruling out the possibility of interference due to low solubility. Optically active compounds can potentially interfere with the absorbance- or fluorescence-based technologies used in this study. Therefore, we performed quench tests to ensure that we selected as confirmed hits only those positives that do not interfere optically with the detection. Eight compounds were found to interfere in the Transcreener™ ADP assay (Figure 5). The eight compounds interfering in the Transcreener™ ADP assay were therefore flagged as false positives and not considered for further evaluation. Upon structural analysis of the 37 remaining positives, one compound containing the transition metal cadmium was also flagged as false positive due to the likely interaction of the metal in the assay. The total number of false positives in the Transcreener™ ADP assay therefore was 9, corresponding to 19% of the 47 initial positives. Next, we assessed the dose response for the 36 remaining positives in the Transcreener™ ADP assay using 12-point doubling dilutions with 10-μM compound concentration as the upper limit. Twenty-three compounds out of 36 (64%) were found to exhibit dose-dependent inhibition at concentrations lower than 10 μM, with their apparent IC50 values ranging from 0.010 μM to 8.8 μM (Table 2). Dose-response curves in the Transcreener™ ADP assay are shown for a selection of the hits (Figure 6B). Twenty-three compounds out of the 47 initial positives were therefore deemed confirmed inhibitors of the tested enzyme in the Transcreener™ ADP assay, corresponding to a 49% confirmation rate. The 23 newly identified inhibitors of TbCet1 are currently undergoing further evaluation.
Figure 5.

Structure of the eight positives identified during the Transcreener™ ADP pilot screen found to interfere optically in the assay.
Table 2.
Data summary for 23 confirmed positives in the Transcreener™ ADP assay. The selected 23 confirmed positives are soluble in the assay conditions, do not interfere optically and have a calculated IC50 lower than 10 μM in the assay. O.I.: Optical interference ; Sol.: solubility threshold (μM).
| Structure | SKI ID | Name | IC50 (μM) | O.I. | Sol. |
|---|---|---|---|---|---|

|
209412 | 2′,2′-Bisepigallocatechin monogallate | 0.010 | NO | > 100 uM |

|
209413 | 2′,2′-Bisepigallocatechin digallate | 0.030 | NO | > 100 uM |

|
211511 | Levodopa | 0.030 | NO | > 100 uM |

|
210886 | Ellagic acid | 0.035 | NO | > 100 uM |

|
211325 | Tannic acid | 0.060 | NO | > 100 uM |

|
209392 | Irigenol | 0.065 | NO | > 100 uM |
|
210893 | Hematein | 0.20 | NO | > 100 uM |

|
209458 | Epigallocatechin-3- monogallate | 0.21 | NO | > 100 uM |

|
209468 | Purpurogallin | 0.21 | NO | > 100 uM |

|
209415 | Epigallocatechin-3,5- digallate | 0.24 | NO | > 100 uM |

|
218293 | Epitheaflavin monogallate | 0.30 | NO | > 100 uM |
|
209509 | Theaflavanin | 0.44 | NO | > 100 uM |
|
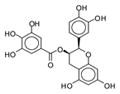
209457 | Epicatechin monogallate | 0.64 | NO | > 100 uM |

|
209487 | Iriginol hexaacetate | 0.71 | NO | > 100 uM |

|
210170 | Norepinephrine | 0.72 | NO | > 100 uM |

|
218248 | 2,3,5,7,3′,4′-Pentahydroxyflavan | 0.91 | NO | > 100 uM |
|
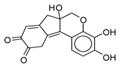
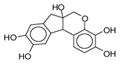
209325 | Haematoxylin | 1.7 | NO | > 100 uM |

|
210887 | Fisetin | 2.1 | NO | > 100 uM |

|
209674 | Rhamnetin | 3.9 | NO | > 100 uM |

|
209444 | Epigallocatechin | 4.4 | NO | > 100 uM |

|
217754 | Anthraquinone, 1,5- diamino | 4.7 | NO | > 100 uM |

|
211290 | Myricetin | 7.2 | NO | > 100 uM |

|
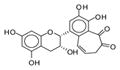
209343 | Theaflavin | 8.8 | NO | > 100 uM |
Figure 6.

(A) Structure of selected positives in the Transcreener™ ADP assay. (B) Dose response curves for selected confirmed positives in the Transcreener™ ADP assay. IC50: SKI 209413, 0.030 μM; SKI 211511, 0.030 μM; SKI 210886, 0.035 μM; SKI 209392, 0.065 μM.
Discussion
We describe in this report the first successful adaptation and optimization of the Transcreener™ technology to the assay of RNA triphosphatases in a final volume of 10 μL in 1536-well format. Optimization of enzyme and ATP concentration, reaction time, assessment of assay robustness and pilot screen were performed in five days, demonstrating the versatility of the Transcreener™ technology. This observation suggests that the newly developed Transcreener™ ADP assay could easily and rapidly be adapted to the assay of other triphosphatases constituting attractive antifungal and antiprotozoal drug targets such as for example Vaccinia NPH-113, Saccharomyces cerevisae Cet1p14, Chlorella virus cvRtp115 or Paramecium bursaria chlorella virus 1 PBCV-116. The major advantage of the Transcreener™ ADP assay over the well-established malachite green assay lies in its compatibility with 1536 format. Due to its reliance on an absorbance readout, the malachite green assay is limited to relatively large volumes because of lack of sensitivity. In contrast, the Transcreener™ ADP assay, because it relies on a fluorescence polarization readout, is amenable to lower volumes and 1536-well format. In this study, we show that the optimized Transcreener™ ADP assay may require as little as 25 pg enzyme per reaction for a given triphosphatase, when 200 fold more (5 ng) were needed in a malachite green assay previously developed in our laboratory for the same enzyme (Table 1). This result confers a great advantage to the Transcreener™ ADP assay for screening, since as little as 8 μg enzyme would be needed for a 300,000 compound screen using this assay, as opposed to 1.5 mg enzyme using the malachite green assay (Table 1). It should be noted that using more enzyme would allow to reduce the assay reaction time, should the investigator’s priority to reduce the length of the screen. Also due to its reliance on an absorbance readout is the necessity for the malachite green assay to be read by Photomultiplier Tube(PMT)-based devices, which can read only one well at a time. The Transcreener™ ADP assay, being compatible with CCD-based devices for readout, allows the entire 1536-well plate to be read at once. This constitutes a significant advantage in HTS conditions compared to the malachite green assay, for which high variability can sometimes be observed within one 384-well plate, because of the time delay between the reading of the first and last well. The simultaneous readout of the entire 1536-well plate also drastically increases the throughput of a screen. The Transcreener™ ADP assay allowed for good robustness in the conditions of screening when performed in 1536-format, as demonstrated by the statistical analysis of the contol run using this assay (Z′=0.54) (Figure 3A). To test the newly developed Transcreener™ ADP assay in HTS conditions, we performed a pilot screen of 3,119 compounds in 1536 format. During the pilot screen performed in duplicate on two separate days, 47 compounds were identified as reproducible positives (Figure 3B). In addition, positive compounds present in duplicate in our combined library due to being provided by both suppliers showed similar percentage inhibition (data not shown). These results provide an indication of the good reproducibility of the Transcreener™ ADP assay. An interesting observation during this pilot screen was the identification of eight optically active compounds interfering with the Transcreener™ technology among 47 positives in our combined library of 3,119 compounds (17% of the positives). This observation suggests that despite taking advantage of a red-shifted Alexa 633 fluorescent probe, the Transcreener™ technology is still prone to optical interference. The results of the pilot screen using the Transcreener™ ADP assay also clearly demonstrate the relevance of the newly developed assay to screening for TbCet1 inhibitors: 49% of the initial positives identified during the pilot screen were later confirmed as inhibitors of the tested enzyme in the Transcreener™ ADP assay. Furthermore, 64% of the confirmed inhibitors were found to be potent inhibitors of the tested enzyme, with a calculated IC50 below 10 μM in the newly developed assay (Table 2).
In conclusion, we present the first adaptation of the Transcreener™ technology to the assay of triphosphatases. The robustness and reproducibility of the newly developed assay performed in 10 μL in 1536-well format is compatible with the requirements of HTS. Confirmation studies on the positives obtained in a pilot screen of about 3,000 compounds using the Transcreener™ ADP assay demonstrate that the newly developed assay can reliably identify potent inhibitors of the RNA triphosphatase TbCet1. These results validate the Transcreener™ ADP assay for the screening of chemical libraries in high density format, thereby adding triphosphatases to the list of targets compatible with the Transcreener™ assay platform. Our study therefore opens the door to the screening of an untapped source of therapeutic agents targeting triphosphatases.
Acknowledgments
The authors are thankful to Dr. Stewart Shuman (Molecular Biology Program, Sloan-Kettering Institute) for providing us with the enzyme used in this study. The authors are also grateful to Anthony Ciro, Gabriela Sanchez, and other members of the HTS lab for their help during the course of this study. The HTS Core Facility is partially supported by the Mr. W.H. Goodwin and Mrs. A. Goodwin and the Commonwealth Foundation for Cancer Research, The William Randolph Hearst Foundation, The Lillian S. Wells Foundation and The Experimental Therapeutics Center of MSKCC.
References
- 1.Gu M, Lima CD. Processing the message: structural insights into capping and decapping mRNA. Curr Opin Struct Biol. 2005;15:99–106. doi: 10.1016/j.sbi.2005.01.009. [DOI] [PubMed] [Google Scholar]
- 2.Furuichi Y, Shatkin AJ. Viral and cellular mRNA capping: past and prospects. Adv Virus Res. 2000;55:135–184. doi: 10.1016/S0065-3527(00)55003-9. [DOI] [PMC free article] [PubMed] [Google Scholar]
- 3.Ho CK, Shuman S. Trypanosoma brucei RNA triphosphatase. Antiprotozoal drug target and guide to eukaryotic phylogeny. J Biol Chem. 2001;276:46182–46186. doi: 10.1074/jbc.M108706200. [DOI] [PubMed] [Google Scholar]
- 4.Lima CD, Wang LK, Shuman S. Structure and mechanism of yeast RNA triphosphatase: an essential component of the mRNA capping apparatus. Cell. 1999;99:533–543. doi: 10.1016/s0092-8674(00)81541-x. [DOI] [PubMed] [Google Scholar]
- 5.Geladopoulos TP, Sotiroudis TG, Evangelopoulos AE. A malachite green colorimetric assay for protein phosphatase activity. Anal Biochem. 1991;192:112–116. doi: 10.1016/0003-2697(91)90194-x. [DOI] [PubMed] [Google Scholar]
- 6.Xu Y, Triantafyllou I, Cable M, Palermo R. High-throughput assays for yeast RNA 5′ triphosphatase (Cet1p) Anal Biochem. 2008;372:89–95. doi: 10.1016/j.ab.2007.07.016. [DOI] [PubMed] [Google Scholar]
- 7.Fisher DK, Higgins TJ. A sensitive, high-volume, colorimetric assay for protein phosphatases. Pharm Res. 1994;11:759–763. doi: 10.1023/a:1018996817529. [DOI] [PubMed] [Google Scholar]
- 8.Bougie I, Bisaillon M. Inhibition of a metal-dependent viral RNA triphosphatase by decavanadate. Biochem J. 2006;398:557–567. doi: 10.1042/BJ20060198. [DOI] [PMC free article] [PubMed] [Google Scholar]
- 9.Lowery RG, Kleman-Leyer K. Transcreener: screening enzymes involved in covalent regulation. Expert Opin Ther Targets. 2006;10:179–190. doi: 10.1517/14728222.10.1.179. [DOI] [PubMed] [Google Scholar]
- 10.Huss KL, Blonigen PE, Campbell RM. Development of a Transcreener kinase assay for protein kinase A and demonstration of concordance of data with a filter-binding assay format. J Biomol Screen. 2007;12:578–584. doi: 10.1177/1087057107300221. [DOI] [PubMed] [Google Scholar]
- 11.Zhang JH, Chung TD, Oldenburg KR. A Simple Statistical Parameter for Use in Evaluation and Validation of High Throughput Screening Assays. J Biomol Screen. 1999;4:67–73. doi: 10.1177/108705719900400206. [DOI] [PubMed] [Google Scholar]
- 12.Antczak C, Shum D, Escobar S, Bassit B, Kim E, Seshan VE, Wu N, Yang G, Ouerfelli O, Li YM, Scheinberg DA, Djaballah H. High-throughput identification of inhibitors of human mitochondrial peptide deformylase. J Biomol Screen. 2007;12:521–535. doi: 10.1177/1087057107300463. [DOI] [PMC free article] [PubMed] [Google Scholar]
- 13.Deng L, Shuman S. Vaccinia NPH-I, a DExH-box ATPase, is the energy coupling factor for mRNA transcription termination. Genes Dev. 1998;12:538–546. doi: 10.1101/gad.12.4.538. [DOI] [PMC free article] [PubMed] [Google Scholar]
- 14.Ho CK, Pei Y, Shuman S. Yeast and viral RNA 5′ triphosphatases comprise a new nucleoside triphosphatase family. J Biol Chem. 1998;273:34151–34156. doi: 10.1074/jbc.273.51.34151. [DOI] [PubMed] [Google Scholar]
- 15.Gong C, Shuman S. Chlorella virus RNA triphosphatase. Mutational analysis and mechanism of inhibition by tripolyphosphate. J Biol Chem. 2002;277:15317–15324. doi: 10.1074/jbc.M200532200. [DOI] [PubMed] [Google Scholar]
- 16.Ho CK, Gong C, Shuman S. RNA triphosphatase component of the mRNA capping apparatus of Paramecium bursaria Chlorella virus 1. J Virol. 2001;75:1744–1750. doi: 10.1128/JVI.75.4.1744-1750.2001. [DOI] [PMC free article] [PubMed] [Google Scholar]