

Abstract
Purpose
To compare the clinical features and gene expression patterns of the physiologic development of retinal vessels and oxygen-induced retinopathy (OIR) in a mouse model, with the aim of identifying differential regulators of physiologic and pathological angiogenesis in the retina.
Methods
C57BL/6J mice were used. Seven-day-old pups were subjected to OIR induction following the standard protocols of entering a hyperoxic chamber on day 7 (P7) and returning to a normoxic condition (relative hypoxia) on day 12 (P12). The retinal vasculatures in the OIR model 24 h (P8-O) or 5 days (P12-O) after switching to the hyperoxic environment and 24 h (P13-O) after returning to normoxic conditions were evaluated with retinal flat mounts and compared with those of age-matched controls (i.e., P8-N, P12-N, P13-N). Gene expression profiling was performed using Phalanx Mouse Whole Genome OneArray microarrays. Normal 9-day-old mice were considered representative of physiologic angiogenesis and compared with 30-day-old mice. A bioinformatics analysis was performed on differentially expressed genes using various comparisons, and real-time reverse-transcription PCR was used to confirm the changes in the genes of interest.
Results
The sequential orders and patterns of vasculature development in normal mice and the OIR models were significantly different. In brief, in the early days (P1 to P7) for normal mice, retinal vessels grew from the optic disc into the non-vascularized retina in a radial fashion. In the hyperoxic stage of the OIR model, the main central retina became devoid of a vascular network, and when the mice returned to the normoxic room, the vessels grew from peripheral perfused areas toward the center of the retina, but the development of intermediate and deep layers of vasculature was significantly delayed. Gene profiling at three critical time points (P8, P12, and P13) showed that 162 probes were upregulated to ≥1.5-fold or downregulated to ≤0.67-fold at one or more time points in the OIR model compared to the controls. In the 45 upregulated genes for the P8-O/P8-N group, enriched genes were mainly related to cytoskeleton formation, whereas the 62 upregulated genes for P13-O/P13-N participated in various pathological processes. In the physiologic conditions on P9, however, 135 genes were upregulated compared with P30; the gap junction and Fc gamma R-mediated phagocytosis were the two main enriched pathways for these genes. Fifty-three probes, including vascular endothelium growth factor A, annexin A2, and endothelin 2, changed at P13-O but not at P9-N, and these changed genes might reflect the modulation of pathological neovascularization.
Conclusions
Angiogenesis in physiologic and pathological conditions is characterized by the differential presentation of vasculature and gene expression patterns. Investigation of those genes unique to the OIR model may help develop new strategies and therapies for intervening in retinal neovascularization.
Introduction
Retinal neovascularization (RNV) is a common pathological process that occurs in the later stages of several blinding retinal disorders, including retinopathy of prematurity, diabetic retinopathy, and retinal vein occlusion. RNV comprises a complex cascade of molecular and cellular events, among which the oxygen supply-related pathway plays an important role, regardless of the original etiological factors. Specifically, retinal ischemia induced by disturbances in vascular function acts as an angiogenesis mediator. Unlike the knowledge of choroidal neovascularization, which has come mainly from studies using human subjects and, to a lesser extent, laser-induced choroidal neovascularization in rodents, the main body of knowledge of RNV is from rodent models of oxygen-induced retinopathy (OIR). This model faithfully mimics two phases of retinopathy of prematurity—the initial vasoobliteration and subsequent neovascularization. Using this model, the role of many angiogenic factors such as vascular endothelial growth factor (Vegf) [1], angiopoietin-2 [2], hypoxia-inducible factor-1 (Hif1) [3], tumor necrosis factor [4], nuclear factor-κB [5], and insulin-like growth factor-1 [6] has been shown in RNV pathogenesis. Among these, Vegf has attracted the most attention, and strategies targeting this molecule have been successfully used in managing neovascularization in and out of ocular environments [7-9]. Other potential players in various RNVs remain to be defined. In the project described here, we started by comparing the vessels’ growth patterns in normal-developing retinas and in the murine OIR model, followed by profiling the gene expression patterns at various stages of these physiologic and pathological conditions. While this study was in progress, three similar studies, all using a microarray strategy and OIR models, were published [10-12]. Even though similar protocols were used for the OIR models, there were major differences in the results described below and those of the three previous reports, and the current report emphasizes the difference in pathological and physiologic angiogenesis at the histological and molecular levels.
Methods
Animal model
Wild-type C57BL/6J mice were used in this study. Normal controls were raised in normal air from birth. The OIR model that was used [13,14] involves transferring newborn pups at postnatal day 7 (P7) and their mothers to chambers supplied with 75±2% oxygen under continual monitoring with an LBCY-12C oximeter (Lubo WeiYe Environmental Protection Technology Co., Ltd, Qingdao, China). After 5 days, the animals returned to and remained in normal air until they were euthanized. At different time points, mice were anaesthetized using intraperitoneal injection of a mixture of 50 mg/kg ketamine (Gutian Pharmaceutical, Fujian, China) and 10 mg/kg chlorpromazine hydrochloride (Harvest Pharmaceutical, Shanghai, China). The retinas were harvested for individual assay as described below. The use of the animals was approved by the institution and adhered to the Association for Research in Vision and Ophthalmology Statement for the Use of Animals in Ophthalmic and Vision Research.
Retinal flat mounts with fluorescein isothiocyanate-dextran perfusion
Anesthetized mice were perfused through the precava with fluorescein isothiocyanated dextran of a molecular weight of 2,000 kDa (Sigma Aldrich, St. Louis, MO). The eyes were enucleated and fixed in 4% paraformaldehyde for 10 to 30 min, depending on the age of the mice. Retinal flat mounts were prepared following routine protocols in this laboratory and examined with a C1-plus confocal fluorescence microscope (Nikon, Tokyo, Japan). Fine adjustment was carefully used to capture the signals produced by vessels in different levels of the retina, and as much of the area of the retina was observed as possible. At least three retinas were included in each group at each time point.
Microarray analysis
At 24 h or 5 days after entering the hyperoxic chamber (P8 and P12, respectively) and 24 h after returning to a normoxic atmosphere (P13), the animals were euthanized via cervical dislocation under anesthesia, and their eyeballs removed. Ten neural retinas from five mice were harvested and pooled into one sample. Control samples of age-matched normal mice were similarly prepared. To evaluate the gene expression patterns in the physiologically developing retinal vasculature system, we also compared the gene expressions of normal retinas at day 9 (P9) and P30. These two time points were selected because the physiologic retinal vasculature develops quickly at P9, whereas at P30 the retinal vasculature is mature and stable. Due to the limited number of pups in most litters, the five animals in the same experimental sample were originally from the same litter, but the mice for different samples in all groups were from different litters. For all samples, total RNA was isolated using NucleoSpin RNA clean-up columns (Macherey-Nagel, Düren, Germany). All remaining processes after RNA extraction, up to the preliminary analysis of microarray data, were performed via custom service at Phalanx Biotech Group, Inc. (Hsinchu, Taiwan). Measurements taken using the Agilent 2100 Bioanalyzer (Agilent Technologies, Santa Clara, CA), and gel electrophoresis was used to ensure the quality of all RNA samples. The RNA integrity numbers were greater than 8.0 and the A260/A280 greater than 1.91 for all samples, indicating that they were high-quality samples suitable for microarray assay. The total RNA of all 24 samples averaged at 70.3±43.0 μg. A dual labeling and microarray strategy was exploited, with two samples for comparison labeled with Cy5 or Cy3 fluorescence, respectively, but hybridized onto the same microarray. For this purpose, 2.5 μg of RNA from paired samples were subjected to cRNA amplification and complementary RNA labeling with Cy5 or Cy3 fluorescence using an Ambion MessageAmp aRNA kit (Life Technologies, Carlsbad, CA). To eliminate potential bias caused by fluorescence labeling, a fluorescence switch was applied to all pairs. After spectrophotometric quantification (above), an equal amount of labeled sample pairs (10 μg each) was mixed and hybridized onto Phalanx Mouse Whole Genome OneArray Microarrays (Phalanx Biotech Group, Inc.). These arrays had 31,798 probes in total, including 1,876 internal controls and 29,922 for transcripts covering the whole genome, based on the Mouse Exonic Evidence Based Oligonucleotide [15]. Among the transcripts, 21,973 (73.4%) are defined with a gene symbol, whereas the other 7,949 (26.6%) have not yet been formally defined. All probes were engineered using specific lengths (an average of 70 mer) to match the isothermal melting temperatures for superior hybridization performance. Three replicates and three switched replicates were included for each comparison, specifically P8-O/P8-N, P12-O/P12-N, P13-O/P13-N, and P9-N/P30-N. Preliminary statistical analysis was performed with the Significance Analysis of Microarray software (SAM 3.11, Stanford University, Stanford, CA), and the resulting significant genes were subjected to a cutoff with an arbitrary 1.5-fold threshold. The differentially expressed genes identified in specific conditions were compared and annotated using the Database for Annotation, Visualization and Integrated Discovery (DAVID, v6.7), with the whole murine genome as the background, and gene ontology (GO) categorization was performed using a modified Fisher exact test [16]. The p value for each GO category or Kyoto Encyclopedia of Genes and Genomes (KEGG) pathway was calculated as an Expression Analysis Systematic Explorer score [17]. Hierarchical clustering was performed for genes of interest using the Cluster 3.0 program, and the results were transferred onto heat maps using Java Treeview [18]. The complete sets of normalized microarray data were deposited in the NCBI Gene Expression Omnibus, with the accession number GSE38762.
Reverse transcription and real-time polymerase chain reaction
The expression changes in the genes of interest were confirmed using reverse transcription and quantitative real-time PCR. In brief, total retinal RNA of the OIR models was extracted as described above and reverse transcribed into cDNA using oligo(dT) primers and PrimeScript RT Enzyme (TaKaRa, Dalian, China). Quantitative real-time PCR was performed using the TaqMan method and Probe Real Master Mix (Tiangen Biotech Co., Ltd., Beijing, China) in a 7500 Real-Time PCR System (Applied Biosystems Inc., Foster, CA). Primers and probes (Table 1) were synthesized by GenScript (Nanjing, China), with ribosomal protein L5 (Rpl5) as the reference gene. The thermal cycling conditions for all genes were as follows: 95 °C for 10 s followed by 40 cycles at 95 °C for 15 s and 60 °C for 1 min. After analysis with the endorsed software, the fractional cycle number for threshold fluorescence (threshold cycle, Ct) for each reaction was obtained. The average of three duplicates was used to calculate the relative Ct versus Rpl5 (ΔCt=average Ctgene minus average CtRpl5) for each sample. The average ΔCt for the three samples in the experimental and control groups was then used to calculate the ΔΔCt of the OIR samples (ΔΔCt=ΔCtOIR–ΔCtcontrol). The relative expression folds of the OIR samples were calculated as 1/2ΔΔCt [19].
Table 1. Primers and probes used for RT-qPCR.
| Gene symbol (Accession number) | Primer and probe sequence (5′—3′) | Amplicon size (bp) |
|---|---|---|
| Ankrd11 | F: CTGAAGGAGCTGTTCAAGCA | 96 |
| NM_001081379 | R: TTGCTCACAGGACACAATCA | |
| P: TGCTGCAGGCGCAGCTTACC | ||
| Ankrd37 | F: TGATGTCCAGATTGGCGTAT | 120 |
| NM_001039562 | R: CTTGCCGTCTGCATACATTT | |
| P: CCTGGCACATTCTGGAAAGCCA | ||
| Anxa2 | F: GTGAAGAGGAAAGGAACCGA | 129 |
| NM_007585 | R: CTTGATGCTCTCCAGCATGT | |
| P: CGCAGTGTGTGCCACCTCCA | ||
| Mt2 | F: CTGCAAATGCAAACAATGC | 116 |
| NM_008630 | R: ACTTGTCGGAAGCCTCTTTG | |
| P: CCCTGGGAGCACTTCGCACA | ||
| Tpi1 | F: GAAGAAGTGCCTGGGAGAAC | 109 |
| NM_009415 | R: CTGTCTGGCAAAGTCGATGT | |
| P: AAACCACCTCGGTGCCTGCC | ||
| Vegfa | F: CACAGCAGATGTGAATGCAG | 111 |
| NM_001025250 | R: TTTAAACCGGGATTTCTTGC | |
| P: TGACCCTTTCCCTTTCCTCGAACTG | ||
| Rpl5 | F: GGAAGCACATCATGGGTCAGA | 70 |
| NM_016980 | R: TACGCATCTTCATCTTCCTCCATT | |
| P: TGTGGCAGACTACATGCGCTACC |
Results
Comparison of physiologic retinal vasculogenesis and oxygen-induced retinal neovascularization in newborn C57BL/6J mice
We started by monitoring the development of the retinal vasculature in normal C57BL/6J mice from birth (Figure 1). Unlike human beings, mice are completely devoid of blood vessels in the retina at birth (P0-N). Eventually, however, superficial retinal vessels grow radially from the optic disc into the retina, reaching the retinal periphery at P7-N. By P7-N, deep and intermediate vessels are still absent. The deep layer of the retina is formed by P10-N, and the intermediate vessel network is shaped by P12-N. From this point on, the retinal vessels comprise superficial, intermediate, and deep networks over the retina. Certain adjustments or remodeling may occur, as reflected by the slight differences and changes of the vessels, but no more obvious changes were observed in retinal vessels after P25-N.
Figure 1.

Normal development of the vascular plexuses of C57BL/6J mouse retinas. Following FD-2000S perfusion, retinal whole mounts were examined to assess the distribution of vessels along the width and depth. Great caution was needed to differentiate the vessels at different levels; this differentiation was achieved by continuous slow adjustments of the microscope focus knob. The specified vasculatures (superficial, intermediate, and deep) in the pictures were highlighted by tracing the vessels in red using Adobe Photoshop software. A: Observation of retinal vessels as wholemount. From P0 to P7, only superficial retinal vessels were seen to originate from the optic disc, extending rapidly from the inner retina to the peripheral retina during the first week of postnatal development. B: Observation of vessels focusing on different layers of the retinal vasculature. From P8, a deep, intermediate vascular plexus started to develop. The deep vascular plexus began forming from vertical vessels diving down from the superficial vascular plexus, expanding from the inner retina into the peripheral retina. In addition, between P8 and P10 the intermediate vascular plexus had not begun to form. At P12, the intermediate vascular plexus was observed, and between P15 and P17, the superficial, intermediate, and deep vascular plexuses were seen all over the retina. After P21, the retinal vessel network was obviously remodeled, especially the intermediate vessel layer, and no obvious changes in the retinal vessels were observed after P25.
The sequential order and pattern of vasculature development are disturbed in the OIR model mice. In general, a large non-perfused area with central vessel constriction was observed 24 h after transfer to the hyperoxic chamber (P8-O). The formation of the non-perfused area may have been caused by the closure and degradation of previous vessels upon hyperoxic challenge. The central retinal vasoobliteration was consistent from P8-O to P12-O, while the peripheral vasoconstriction became aggravated over time. During the entire hyperoxia period, only four to six radial branches of the retinal artery were present in the central area at the superficial level (Figure 2), while intermediate- and deep-layer networks were completely absent over the entire retina (data not shown). While the flat mounts were being prepared, the retinal tissues under hyperoxic conditions were more friable than normal ones, implying that the overall structure of the retina was altered by the hyperoxic treatment. We propose that changes to the retinal vascular system contribute to the overall structural changes of retinas under such conditions. At 24 h after the switch to normoxia, superficial retinal vascularization started along the front line of the perfused area toward the central retina. Aside from the centripetal pattern, the vessels also grew from the superficial layer to the deep layer of the retina. By P15-O, the retina still showed a large area of central vasoobliteration, and the retinal arteries and veins had a dilated and tortuous appearance; furthermore, numerous vascular tufts were present in the transition zone between the non-perfused central retina and the perfused peripheral retina. At P21-O, almost the entire retina was revascularized. From this point on, retinal neovascular tufts regressed gradually and disappeared before P26-O. By P30-O, the OIR retinal vascular network often showed dilated tortuous vessels, abnormal vessel traffic, and uneven vascular distributions (Figure 3), which were absent in the age-matched normal mice. The current study showed that the intermediate networks were absent at P13 and P15, contradicting earlier reports that deep and intermediate vascular networks were observed at P15 [20]. However, no effort was made to pursue this direction, and we have no explanation for these discrepancies.
Figure 2.

Central non-perfusion area and vasoconstriction under hyperoxic conditions in C57BL/6J mouse retinas. After the mice spent 24 h in a hyperoxic condition, a central area of vasoobliteration (VO) developed rapidly and increased in size until P11, extending further into the peripheral retina, while the size of the central vasoobliteration area decreased slightly from P12. From P8 to P12, only the superficial retinal vascular network was observed, but initiated vascular sprouts were sometimes observed at P12. The development and differentiation of the deep and intermediate vascular plexuses were obviously suppressed. The clear, sharp appearance of all vessels at the single superficial level in all panels also implied the lack of the two other layers of vasculature observed in Figure 1.
Figure 3.

Neovascularization under relative hypoxic conditions in C57BL/6J mouse retinas. After the mice were relocated to room air for 24 h, the size of the vasoobliteration (VO) area decreased slightly, but the deep vascular plexus was observed in the peripheral area, in which area superficial vessels were preserved during hyperoxia. At P15, the size of the VO area continued to decrease, and the deep—but not the intermediate—vascular plexus was observed in the area where superficial vessels were preserved during hyperoxia. The retinal arteries and veins had a dilated and tortuous appearance, and vascular branch sprouts emerged from existing vessels. From P17 to P19, retinal neovascularization progressed rapidly, and numerous vascular sprouts appeared in the transition zone between the vascular and avascular retina. The deep and intermediate plexuses can be observed in almost the same area as the superficial plexus. From P21 to P23, the size of the VO area was small, and neovascularization began to regress. At P25, the VO area was fully revascularized in three layers, neovascularization had completely resolved, and the retinal vessels began to remodel.
Gene expression changes during the early phases of oxygen-induced retinopathy
To monitor the changes in transcriptomes during the induction and onset of OIR, we compared the gene expression patterns at three critical time points, namely, P8, P12, and P13 (Figure 4). To minimize the potential interference of the expression of genes relating to ocular development in normal mice, the expression patterns of OIR retinas at each time point were compared to those of age-matched animals remaining in normal air from birth, thus making three pairs of samples (P8-O/P8-N, P12-O/P12-N, and P13-O/P13-N). Of an estimated 30,000 probes, 162 changed more than 1.5-fold at one or more time points (Figure 5, Appendix 1). Compared with the genes that showed similar changes at all three time points (like Cluster C1 and C5 in Figure 5), especially at P8-O and P13-O, the genes that manifested contradictory changes at P8-O and P13-O (Clusters C2 and C4 in Figure 5, Table 2) might have done so relative to oxygen pressure changes and may thus provide more information about the development of OIR. When these changed genes were subjected to DAVID analysis, no pathways or GOs were significantly enriched for downregulated genes at any time point or upregulated genes at P12-O. In the 45 upregulated genes with formal nomenclatures for the P8-O/P8-N group, enriched GO was mainly observed at cytoskeleton formation, with Mtap2, Mtap1b, and Rasa1 as representative genes. This implies that the cellular response to hyperoxic challenge is mainly related to cytoskeleton remodeling. However, the 62 upregulated genes for P13-O/P13-N have roles in diverse pathological processes (Table 3), indicating that more complex responses are initiated by the hypoxic stimulus. Furthermore, the only enriched KEGG pathway (p value=1.6×10⁻⁴, enrichment fold=16.9) was glycolysis/gluconeogenesis, which covers glucose phosphate isomerase 1 (Gpi1), hexokinase 2 (Hk2), phosphoglycerate kinase 1 (Pgk1), phosphoglycerate mutase 1 (Pgam1), and triosephosphate isomerase 1 (Tpi1). Unlike Vegfa (Table 2 and Table 3), however, another best-known hypoxic responsive gene, Hif1α, did not show significant changes in our study. The P8-O/P8-N and P13-O/P13-N ratios for Hif1α were 1.0491±0.1454 and 1.0493±0.0977, respectively.
Figure 4.

Statistical analysis of microarray (SAM) plots of four comparison pairs. Three arrays were included in each group. The two parallel dashed lines are the cutoff threshold specified by the actual false discovery rate, and the total number of upregulated (red dots) and downregulated (green dots) genes were given for each plot.
Figure 5.
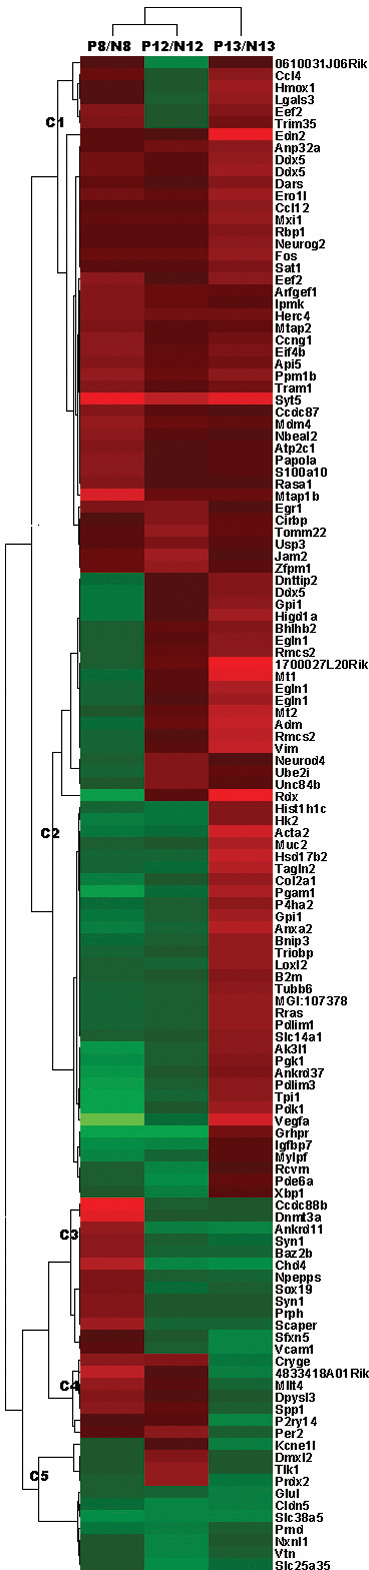
Clustering of the regulated genes that were changed at P8-O/P8-N, P12-O/P12-N, or P13-O/P13-N during the oxygen-induced retinopathy model induction process. Three arrays were included in each group, and the average folds-over-age controls were used. The color bar stands for the log2 values of the probe change folds, with red for upregulation and green for downregulation.
Table 2. Genes showing opposite changes at P8 and P13 as compared with age controls.
| Gene symbol | P8-O/P8-N ratio | P13-O/P13-N ratio |
|---|---|---|
| Chd4 | 2.1374 | 0.5983 |
| Ankrd11 | 1.7291 | 0.6465 |
| Anxa2 | 0.6669 | 2.1625 |
| Pgk1 | 0.6066 | 1.5450 |
| Ankrd37 | 0.5776 | 1.5206 |
| Ak3l1 | 0.5606 | 1.7040 |
| Pgam1 | 0.5438 | 2.0699 |
| Rdx | 0.5414 | 10.3585 |
| Pdlim3 | 0.5330 | 1.6370 |
| Pdk1 | 0.5242 | 1.8361 |
| Tpi1 | 0.5030 | 1.6187 |
| Vegfa | 0.2877 | 2.4823 |
Table 3. Enriched gene ontology terms in upregulated genes in P8-O/P8-N and P13-O/P13-N.
| GO Term | P Value | Genes | Fold Enrichment |
|---|---|---|---|
| P8-O/P8-N | |||
| regulation of cytoskeleton organization |
0.012034 |
Mtap2, Mtap1b, Rasa1 |
17.157 |
| P13-O/P13-N | |||
| glycolysis |
1.41E-05 |
Tpi1, Pgam1, Hk2, Pgk1, Gpi1 |
32.853 |
| glucose metabolic process |
1.05E-04 |
Pdk1, Tpi1, Pgam1, Hk2, Pgk1, Gpi1 |
12.390 |
| generation of precursor metabolites and energy |
0.001813 |
Tpi1, Pgam1, Hk2, Ero1l, Pgk1, Gpi1 |
6.646 |
| circulatory system process |
0.00624 |
Acta2, Edn2, Hmox1, Vegfa |
10.418 |
| nitric oxide mediated signal transduction |
0.006759 |
Mt2, Mt1 |
289.106 |
| angiogenesis |
0.01024 |
Hmox1, Vegfa, Gpi1, Anxa2 |
8.695 |
| vascular process in circulatory system |
0.012388 |
Acta2, Edn2, Vegfa |
17.347 |
| response to oxygen levels |
0.020371 |
Hmox1, Vegfa, Bnip3 |
13.344 |
| immune response |
0.020881 |
Ccl12, Rmcs2, Vegfa, Bnip3, Ccl4, B2m |
3.683 |
| vasoconstriction |
0.043145 |
Acta2, Edn2 |
44.478 |
| negative regulation of multicellular organismal process |
0.045008 |
Hmox1, Vegfa, Anxa2 |
8.673 |
| extracellular matrix organization | 0.045821 | Lgals3, Col2a1, Anxa2 | 8.587 |
Genes involved in the physiologic development of normal retinal vasculature
Due to the obvious difference between normal retinal vasculature and oxygen-induced RNV, we also monitored the genes that might be involved in normal retinal development by comparing the gene patterns at P9-N against those of P30-N. Among all probes corresponding to defined transcripts with formal nomenclature, 135 were upregulated and 231 were downregulated 1.5-fold in P9-N/P30-N (Appendix 2). Among the upregulated genes, the gap junction and Fc gamma R-mediated phagocytosis were the two main enriched KEGG pathways, while for the downregulated genes, the main pathways were starch and sucrose metabolism and purine metabolism (Table 4). Taking P13-O/P13-N into account, among all 419 defined probes that changed in at least one condition (P13-O/P13-N, P9-N/P30-N), nine showed consistent changes, and eight showed opposite changes, while the other 402 changed in only one condition (Table 5). The 17 genes that showed opposite or concert changes are listed in Table 6, and the representatives of the 53 probes that changed only at P13-O/P13-N but not at P9-N/P30-N and their corresponding genes are listed in Table 7 (and Appendix 3 for all probes). Again, Vegfa, the most extensively studied proangiogenic factor, was upregulated in the P13-O/P13-N group but remained unchanged in the P9-N/P30-N group, indicating that this gene might be more relevant with pathological neovascularization but not with physiologic angiogenesis. The changes in several genes of interest were further confirmed with real-time PCR, and good agreement between the microarray and PCR measurements was observed (Table 8).
Table 4. Enriched pathways in P9-N/P30-N.
| Term | P Value | Genes | Fold Enrichment |
|---|---|---|---|
|
Downregulated pathways | |||
| Starch and sucrose metabolism |
0.008 |
Pygm, Gaa, Hk2, Hk1 |
9.516 |
| Purine metabolism |
0.034 |
Pde6a, Pde6b, Adssl1, Pde8a, Pde6h, Pde6g |
3.273 |
|
Upregulated pathways | |||
| Gap junction |
0.028 |
Tubb2b, Tubb2a, Tubb5, Tuba1a |
5.931 |
| Fc gamma R-mediated phagocytosis | 0.039 | Marcksl1, Marcks, Arpc5, Pik3r1 | 5.205 |
Table 5. Matching of genes that changed in physiologic (P9-N/P30-N) or pathological (P13-O/P13-N) angiogenesis.
| P9-N/P30-N | |||
|---|---|---|---|
|
P13-O/P13-N |
Up-regulated |
Down-regulated |
Unchanged |
| Up-regulated |
6 |
5 |
51 |
| Down-regulated |
3 |
3 |
2 |
| Unchanged | 126 | 223 | 21554 |
Table 6. Genes that manifested concert or opposite changes at P9-N/P30-N and P13-O/P13-N.
| Gene symbol | Definition | P13-O/P13-N ratio | P9-N/P30-N ratio |
|---|---|---|---|
| Kcne1 | potassium voltage-gated channel, Isk-related subfamily, member 1 | 0.6592 | 2.3086 |
| Vcam1 | vascular cell adhesion molecule 1 | 0.6341 | 1.9022 |
| Slc38a5 | solute carrier family 38, member 5 | 0.6191 | 1.7993 |
| Rdx | radixin | 10.3585 | 1.6608 |
| Tagln2 | transgelin 2 | 2.1198 | 1.6158 |
| Col2a1 | collagen, type II, alpha 1 | 1.7254 | 1.9554 |
| Neurog2 | neurogenin 2 | 1.7086 | 1.6937 |
| Rbp1 | retinol binding protein 1, cellular | 1.6143 | 1.7148 |
| Sat1 | spermidine/spermine N1-acetyl transferase 1 | 1.5006 | 2.1131 |
| Glul | glutamate-ammonia ligase 1 | 0.6594 | 0.2625 |
| P2ry14 | purinergic receptor P2Y, G-protein coupled, 14 | 0.6286 | 0.6476 |
| Sfxn5 | sideroflexin 5 | 0.6238 | 0.5462 |
| Mt1 | metallothionein 1 | 2.6682 | 0.3433 |
| Mt2 | metallothionein 2 | 2.2200 | 0.6344 |
| Fos | FBJ osteosarcoma oncogene | 1.7431 | 0.4556 |
| Bhlhb2 | Class B basic helix–loop–helix protein 2 | 1.5353 | 0.4539 |
| Hk2 | hexokinase 2 | 1.5251 | 0.1495 |
Table 7. Genes that changed at P13-O/P13-N only but remained stable at P9-N/P30-N.
| Gene symbol | Gene name | P13-O/P13-N ratio | P9-N/P30-N ratio |
|---|---|---|---|
| Adm | adrenomedullin | 2.2952 | 1.2184 |
| Anxa2 | annexin A2 | 2.1625 | 1.2005 |
| Ccl12 | chemokine (C-C motif) ligand 12 | 1.6336 | 1.0920 |
| Ccl4 | chemokine (C-C motif) ligand 4 | 1.6343 | 1.0484 |
| Chd4 | chromodomain helicase DNA binding protein 4 | 0.5983 | 1.4473 |
| Ddx5* | DEAD (Asp-Glu-Ala-Asp) box polypeptide 5 | 1.8907, 1.7185, 1.5464 | 1.1269, 1.0889, 0.8610 |
| Edn2 | endothelin 2 | 2.8626 | 0.8801 |
| Egln1* | EGL nine homolog 1 (C. elegans) | 1.8848, 2.0157, 1.6188 | 0.9181, 0.9040, 0.9575 |
| Ero1l* | ERO1-like (S. cerevisiae) | 1.8372, 1.9127 | 0.8408, 0.7613 |
| Gpi1 | glucose phosphate isomerase 1 | 1.6661 | 0.8129 |
| Hmox1 | heme oxygenase (decycling) 1 | 1.8236 | 1.1132 |
| Muc2 | mucin 2 | 2.0306 | 0.9220 |
| Pgam1 | phosphoglycerate mutase 1 | 2.0699 | 0.8084 |
| Syt5 | synaptotagmin V | 2.7145 | 0.7828 |
| Tpi1 | triosephosphate isomerase 1 | 1.6187 | 0.6997 |
| Vegfa | vascular endothelial growth factor A | 2.4823 | 1.2186 |
| Vim | vimentin | 2.3312 | 1.4946 |
Note *: These genes have two or three probes in this array setting, thus have more than one ratio in each condition.
Table 8. Confirmation of changes of six genes by RT-qPCR.
| Gene symbol | P8-O/P8-N PCR ratio | P8-O/P8-N Chip ratio | P13-O/P13-N PCR ratio | P13-O/P13-N Chip ratio | P9-N/P30-N PCR ratio | P9-N/P30-N Chip ratio |
|---|---|---|---|---|---|---|
| Ankrd11 | 2.2830 | 1.7291 | 1.5625 | 0.6465 | 0.5672 | 1.2766 |
| Ankrd37 | 0.3149 | 0.5776 | 1.8058 | 1.5206 | 0.5643 | 1.0405 |
| Anxa2 | 0.4648 | 0.6669 | 3.5604 | 2.1625 | 3.2840 | 1.2005 |
| Mt2 | 5.3914 | 1.0532 | 2.1010 | 2.2200 | 0.4132 | 0.6344 |
| Tpi1 | 0.5288 | 0.5030 | 2.6888 | 1.6187 | 0.7075 | 0.6997 |
| Vegfa | 0.7057 | 0.2877 | 4.8914 | 2.4823 | 0.9922 | 1.2186 |
Discussion
Three previous studies [10-12] employed microarray technology to study gene expressions in OIR models. Although similar OIR models were used, huge differences exist among the previous reports and our own. Ishikawa [11] noted that eight genes were upregulated and 75 downregulated by greater than 1.5-fold in hyperoxic retinas over normoxic retinas (P12-O/P12-N), while we recorded 22 upregulated and 15 downregulated probes in the same setting. These two sets of microarray data share only four downregulated genes (Cldn5, Igfbp7, Slc38a5, and Vtn) and no upregulated genes for P12-O/P12-N. Unable to address all such discrepancies among all studies, this discussion focused on limited examples, such as Hif1.
Hif1 is a factor most often proposed as responsible for hypoxic stress, including in angiogenesis. To form bioactive Hif1, Hif1α must dimerize with Hif1β, and modulation of Hif1 activity is mainly achieved with modification (e.g., hydrocxylation or ubiquination) of Hif1α subunits and the dimerization process of Hif1α with Hif1β, though alterations of Hif1α gene transcriptions also contribute to modulating overall Hif1α activity in certain conditions. Both mechanisms are responsive to oxygen tension-related stimuli (refer to [21,22] for an extensive review). In the OIR models discussed here, Hif1α was upregulated by 47,162-fold at P13 in Sato’s study [10] and 2.22-fold at P12.5 (e.g., 12 h after returning to normoxic conditions) in Ishikawa’s study [11], but showed no significant changes in either our P13-O/P13-N array or in Recchia’s study [12]. Not knowing the exact cause of such a discrepancy with any gene in these parallel independent studies, we believe that several variations among the experiments might contribute. First, Sato and Ishikawa used C57BL/6N mice, Recchia used C57BJ/6L mice, and we used C57BL/6J mice. Although OIR strain dependence is already recognized [23], the genetic differences among various sub-strains had also been partially defined [24,25]. Second, all four studies used different array platforms, and significant inconsistencies among different microarray platforms are sometimes expected [24,26]. Moreover, the variations in the in-house experiment protocols in different laboratories (e.g., the time used for animal bedding changes, the time from mice euthanasia to RNA extraction, the pooling of samples from animals, etc.) may all contribute to the different results from these studies.
Similarly, the time courses of oxygen tension changes, as well as the detection time points, need to be considered when interpreting the results with strictly controlled genes like Hif1. For example, in a study using epidermal keratinocytes, Weir et al. [27] reported that prolonged (chronic) hypoxia (1% O2 for 18 h) leads to the downregulation of Hif1α but the upregulation of classical Hif1 targets such as Vegfa. This may, in part, explain the Vegf upregulation (Table 2 and Table 8) in the absence of Hif1 changes in the current study. Similarly, several other genes, such as Ctgf, bFgf, Pdgf, and Ang1, are also known to be involved in modulating Vegf expression in other situations; however, in the current study, none showed significant changes in the hyperoxia (P8-O/P8-N group) or hypoxia (P13-O/P13-N) challenges (data not shown). Collectively, the roles of Hif1α, Vegf, or other genes in OIR deserve more extensive investigation.
Because few changes in classic pro- or antiangiogenic factors were observed in our study, clustering of the regulated genes in OIR (P13-O/P13-N) did not reveal any angiogenic pathways. However, the enrichment of some angiogenesis- or glycolysis-related gene ontology terms in the clustering assay (Table 3) was suggestive. For example, Hmox1 was grouped with ontology terms of the circulatory system process, angiogenesis, response to oxygen levels, and the negative regulation of the multicellular organismal process (Table 3); its upregulation in P13-O/P13-N thus supports a potential role in OIR. Pursuing these genes or gene ontology terms may lead to a comprehensive understanding of neovascularization in the OIR context. Similarly, the enrichment of glucose metabolism-related genes in P13-O/P13-N (Table 3) suggested that the interactions among hypoxia, glucose, and Hif1 also exist to some extent in the OIR model, as in the case of tumors [28,29]. Although the ultimate results of Hif1 action may partially depend on glycolysis [30], glucose levels in return affect the responses of Hif1 expression to hypoxia [31,32]. Again, the absence of changes in Hif1a expression and significant changes to glycolysis-related genes (Table 3) in our study reflect the complexity of the interactions between Hif1 and glycolysis in this experimental condition.
Another issue that deserves discussion is the differential behaviors of genes in the P9-N/P30-N and P13-O/P13-N settings, which were assumed to represent physiologic and pathological vessel formation, respectively. The genes that relate to angiogenesis but show differential changes in P13-O/P13-N and P9-N/P30-N (Table 6 and Table 7) might imply that hypoxia-induced RNV and physiologic angiogenesis are under the control of different regulating networks. This hypothesis is in line with the findings in a recent study, where Chabot showed that some molecules (e.g., CD160) were selectively expressed in newly formed blood vessels in tumors but not in healthy tissues, and that antibodies against these molecules reduced neovascularization in several animal models, including the murine OIR model [33]. Similarly, we propose that the genes upregulated in the P13-O/P13-N setting, regardless of changes in the P9-N/P30-N setting, may pose potential targets for managing neovascularization. Examples of such genes include Hk2, metallothionein 1 (Mt1), and Mt2 (Table 6). Hk2 has long been known as a glycolytic enzyme, and has recently been proven to be involved in tumor or metabolic disorders [34-36] or hypoxia-induced angiogenesis in these conditions [37]. Mt is a family of cysteine-rich, low molecular weight proteins, the gene expression of which is induced by various stimuli, such as metal exposure, oxidative stress, and cytokines. Mts are thus involved in various injury- or stress-related pathological processes such as ischemia [38], ischemia-reperfusion injury [39], wound healing [40], and inflammation or immune responses [41,42]. Recent studies using Mt knockout mice have shown that Mt1 and Mt2 are involved in angiogenesis by functioning in endothelial cells, smooth muscle cells, and macrophages [43,44]. Our observation that Hk2, Mt1, and Mt2 were upregulated 24 h after switching to relative hypoxic conditions provided further evidence for the roles of Mt in pathological angiogenesis; hence, Mt is potentially useful in managing neovascularization-related disease. For similar reasons, several other genes, including annexin A2 and endothelin 2 (Table 7), are being studied in this laboratory for their potential usefulness in managing RNV (data not shown).
In summary, the data described here bring insights into hypoxia-induced retinopathy, and contribute to our understanding of the clinical situation of OIR. By monitoring the development of retinal vasculature in a dynamic pattern under physiologic and OIR conditions, we showed that hyperoxic tension not only led to the degeneration of superficial retinal vessels but also delayed the development of the deep and intermediate layers of vasculature (Figure 2 and Figure 3). However, thus far, few studies have been conducted on the contributions of individual layers to the overall physiologic function of the retina, as well as abnormalities of which layers do the most damage to retinal organization and function. Microarray assays of retinas revealed the complexity of molecular networks underlying the development of OIR. Investigating dynamic changes in specific genes such as Hk2, Mt1, or Mts2 might help to answer these questions, and more new stage- or site-specific protocols or therapeutics can thus be developed to intervene in neovascularization development, providing novel therapies for related diseases.
Acknowledgments
This work was supported by Qingdao Applied Basic Research Projects (10-3-4-13-3-JCH) and Natural Science Foundation of Shandong Province (ZR2011HM012, JQ200908). We thank Dr. Richard B. Mailman of Penn State University for critical reading of this manuscript.
Appendix 1.
Summary of the differentially expressed genes in the three comparison groups. To access the data, click or select the words “Appendix 1.”
Appendix 2.
Summary of the differentially expressed genes in the P9-N/P30-N comparison. To access the data, click or select the words “Appendix 2.”
Appendix 3.
All probes that changed only at P13-O/P13-N but remained stable at P9-N/P30-N. To access the data, click or select the words “Appendix 3.”
References
- 1.Pierce EA, Avery RL, Foley ED, Aiello LP, Smith LE. Vascular endothelial growth factor/vascular permeability factor expression in a mouse model of retinal neovascularization. Proc Natl Acad Sci USA. 1995;92:905–9. doi: 10.1073/pnas.92.3.905. [DOI] [PMC free article] [PubMed] [Google Scholar]
- 2.Takagi H, Koyama S, Seike H, Oh H, Otani A, Matsumura M, Honda Y. Potential role of the angiopoietin/tie2 system in ischemia-induced retinal neovascularization. Invest Ophthalmol Vis Sci. 2003;44:393–402. doi: 10.1167/iovs.02-0276. [DOI] [PubMed] [Google Scholar]
- 3.Ozaki H, Yu AY, Della N, Ozaki K, Luna JD, Yamada H, Hackett SF, Okamoto N, Zack DJ, Semenza GL, Campochiaro PA. Hypoxia inducible factor-1alpha is increased in ischemic retina: temporal and spatial correlation with VEGF expression. Invest Ophthalmol Vis Sci. 1999;40:182–9. [PubMed] [Google Scholar]
- 4.Gardiner TA, Gibson DS, de Gooyer TE, de la Cruz VF, McDonald DM, Stitt AW. Inhibition of tumor necrosis factor-alpha improves physiological angiogenesis and reduces pathological neovascularization in ischemic retinopathy. Am J Pathol. 2005;166:637–44. doi: 10.1016/s0002-9440(10)62284-5. [DOI] [PMC free article] [PubMed] [Google Scholar]
- 5.Yoshida A, Yoshida S, Ishibashi T, Kuwano M, Inomata H. Suppression of retinal neovascularization by the NF-kappaB inhibitor pyrrolidine dithiocarbamate in mice. Invest Ophthalmol Vis Sci. 1999;40:1624–9. [PubMed] [Google Scholar]
- 6.Chen J, Smith LE. Retinopathy of prematurity. Angiogenesis. 2007;10:133–40. doi: 10.1007/s10456-007-9066-0. [DOI] [PubMed] [Google Scholar]
- 7.Dadgostar H, Waheed N. The evolving role of vascular endothelial growth factor inhibitors in the treatment of neovascular age-related macular degeneration. Eye (Lond) 2008;22:761–7. doi: 10.1038/eye.2008.86. [DOI] [PubMed] [Google Scholar]
- 8.Tatar O, Shinoda K, Kaiserling E, Claes C, Eckardt C, Eckert T, Pertile G, Boeyden V, Scharioth GB, Yoeruek E, Szurman P, Bartz-Schmidt KU, Grisanti S. Implications of bevacizumab on vascular endothelial growth factor and endostatin in human choroidal neovascularisation. Br J Ophthalmol. 2009;93:159–65. doi: 10.1136/bjo.2008.138594. [DOI] [PubMed] [Google Scholar]
- 9.Ehlers JP, Spirn MJ, Shah CP, Fenton GL, Baker PS, Regillo CD, Ho AC. Ranibizumab for exudative age-related macular degeneration in eyes previously treated with alternative vascular endothelial growth factor inhibitors. Ophthalmic Surg Lasers Imaging. 2010;41:182–9. doi: 10.3928/15428877-20100303-05. [DOI] [PubMed] [Google Scholar]
- 10.Sato T, Kusaka S, Hashida N, Saishin Y, Fujikado T, Tano Y. Comprehensive gene-expression profile in murine oxygen-induced retinopathy. Br J Ophthalmol. 2009;93:96–103. doi: 10.1136/bjo.2008.142646. [DOI] [PubMed] [Google Scholar]
- 11.Ishikawa K, Yoshida S, Kadota K, Nakamura T, Niiro H, Arakawa S, Yoshida A, Akashi K, Ishibashi T. Gene expression profile of hyperoxic and hypoxic retinas in a mouse model of oxygen-induced retinopathy. Invest Ophthalmol Vis Sci. 2010;51:4307–19. doi: 10.1167/iovs.09-4605. [DOI] [PubMed] [Google Scholar]
- 12.Recchia FM, Xu L, Penn JS, Boone B, Dexheimer PJ. Identification of genes and pathways involved in retinal neovascularization by microarray analysis of two animal models of retinal angiogenesis. Invest Ophthalmol Vis Sci. 2010;51:1098–105. doi: 10.1167/iovs.09-4006. [DOI] [PMC free article] [PubMed] [Google Scholar]
- 13.Connor KM, Krah NM, Dennison RJ, Aderman CM, Chen J, Guerin KI, Sapieha P, Stahl A, Willett KL, Smith LE. Quantification of oxygen-induced retinopathy in the mouse: a model of vessel loss, vessel regrowth and pathological angiogenesis. Nat Protoc. 2009;4:1565–73. doi: 10.1038/nprot.2009.187. [DOI] [PMC free article] [PubMed] [Google Scholar]
- 14.Smith LE, Wesolowski E, McLellan A, Kostyk SK, D'Amato R, Sullivan R, D'Amore PA. Oxygen-induced retinopathy in the mouse. Invest Ophthalmol Vis Sci. 1994;35:101–11. [PubMed] [Google Scholar]
- 15.Verdugo RA, Medrano JF. Comparison of gene coverage of mouse oligonucleotide microarray platforms. BMC Genomics. 2006;7:58. doi: 10.1186/1471-2164-7-58. [DOI] [PMC free article] [PubMed] [Google Scholar]
- 16.Huang W, Sherman BT, Lempicki RA. Systematic and integrative analysis of large gene lists using DAVID bioinformatics resources. Nat Protoc. 2009;4:44–57. doi: 10.1038/nprot.2008.211. [DOI] [PubMed] [Google Scholar]
- 17.Hosack DA, Dennis G, Jr, Sherman BT, Lane HC, Lempicki RA. Identifying biological themes within lists of genes with EASE. Genome Biol. 2003;4:R70. doi: 10.1186/gb-2003-4-10-r70. [DOI] [PMC free article] [PubMed] [Google Scholar]
- 18.Saldanha AJ. Java Treeview–extensible visualization of microarray data. Bioinformatics. 2004;20:3246–8. doi: 10.1093/bioinformatics/bth349. [DOI] [PubMed] [Google Scholar]
- 19.Livak KJ, Schmittgen TD. Analysis of relative gene expression data using real-time quantitative PCR and the 2(-Delta Delta C(T)) Method. Methods. 2001;25:402–8. doi: 10.1006/meth.2001.1262. [DOI] [PubMed] [Google Scholar]
- 20.Stahl A, Connor KM, Sapieha P, Chen J, Dennison RJ, Krah NM, Seaward MR, Willett KL, Aderman CM, Guerin KI, Hua J, Lofqvist C, Hellstrom A, Smith LE. The mouse retina as an angiogenesis model. Invest Ophthalmol Vis Sci. 2010;51:2813–26. doi: 10.1167/iovs.10-5176. [DOI] [PMC free article] [PubMed] [Google Scholar]
- 21.Pagès G, Pouyssegur J. Transcriptional regulation of the Vascular Endothelial Growth Factor gene–a concert of activating factors. Cardiovasc Res. 2005;65:564–73. doi: 10.1016/j.cardiores.2004.09.032. [DOI] [PubMed] [Google Scholar]
- 22.Semenza GL. HIF-1: using two hands to flip the angiogenic switch. Cancer Metastasis Rev. 2000;19:59–65. doi: 10.1023/a:1026544214667. [DOI] [PubMed] [Google Scholar]
- 23.Chan CK, Pham LN, Zhou J, Spee C, Ryan SJ, Hinton DR. Differential expression of pro- and antiangiogenic factors in mouse strain-dependent hypoxia-induced retinal neovascularization. Lab Invest. 2005;85:721–33. doi: 10.1038/labinvest.3700277. [DOI] [PubMed] [Google Scholar]
- 24.Mekada K, Abe K, Murakami A, Nakamura S, Nakata H, Moriwaki K, Obata Y, Yoshiki A. Genetic differences among C57BL/6 substrains. Exp Anim. 2009;58:141–9. doi: 10.1538/expanim.58.141. [DOI] [PubMed] [Google Scholar]
- 25.Zurita E, Chagoyen M, Cantero M, Alonso R, Gonzalez-Neira A, Lopez-Jimenez A, Lopez-Moreno JA, Landel CP, Benitez J, Pazos F, Montoliu L. Genetic polymorphisms among C57BL/6 mouse inbred strains. Transgenic Res. 2011;20:481–9. doi: 10.1007/s11248-010-9403-8. [DOI] [PubMed] [Google Scholar]
- 26.Larkin JE, Frank BC, Gavras H, Sultana R, Quackenbush J. Independence and reproducibility across microarray platforms. Nat Methods. 2005;2:337–44. doi: 10.1038/nmeth757. [DOI] [PubMed] [Google Scholar]
- 27.Weir L, Robertson D, Leigh IM, Vass JK, Panteleyev AA. Hypoxia-mediated control of HIF/ARNT machinery in epidermal keratinocytes. Biochim Biophys Acta. 2011;1813:60–72. doi: 10.1016/j.bbamcr.2010.11.014. [DOI] [PubMed] [Google Scholar]
- 28.Denko NC. Hypoxia, HIF1 and glucose metabolism in the solid tumour. Nat Rev Cancer. 2008;8:705–13. doi: 10.1038/nrc2468. [DOI] [PubMed] [Google Scholar]
- 29.Vordermark D, Kraft P, Katzer A, Bolling T, Willner J, Flentje M. Glucose requirement for hypoxic accumulation of hypoxia-inducible factor-1alpha (HIF-1alpha). Cancer Lett. 2005;230:122–33. doi: 10.1016/j.canlet.2004.12.040. [DOI] [PubMed] [Google Scholar]
- 30.Fulda S, Debatin KM. HIF-1-regulated glucose metabolism: a key to apoptosis resistance? Cell Cycle. 2007;6:790–2. doi: 10.4161/cc.6.7.4084. [DOI] [PubMed] [Google Scholar]
- 31.Zhou J, Hara K, Inoue M, Hamada S, Yasuda H, Moriyama H, Endo H, Hirota K, Yonezawa K, Nagata M, Yokono K. Regulation of hypoxia-inducible factor 1 by glucose availability under hypoxic conditions. Kobe J Med Sci. 2007;53:283–96. [PubMed] [Google Scholar]
- 32.Bensellam M, Duvillie B, Rybachuk G, Laybutt DR, Magnan C, Guiot Y, Pouyssegur J, Jonas JC. Glucose-induced O(2) consumption activates hypoxia inducible factors 1 and 2 in rat insulin-secreting pancreatic beta-cells. PLoS ONE. 2012;7:e29807. doi: 10.1371/journal.pone.0029807. [DOI] [PMC free article] [PubMed] [Google Scholar]
- 33.Chabot S, Jabrane-Ferrat N, Bigot K, Tabiasco J, Provost A, Golzio M, Noman MZ, Giustiniani J, Bellard E, Brayer S, Aguerre-Girr M, Meggetto F, Giuriato S, Malecaze F, Galiacy S, Jais JP, Chose O, Kadouche J, Chouaib S, Teissie J, Abitbol M, Bensussan A, Le Bouteiller P. A novel antiangiogenic and vascular normalization therapy targeted against human CD160 receptor. J Exp Med. 2011;208:973–86. doi: 10.1084/jem.20100810. [DOI] [PMC free article] [PubMed] [Google Scholar]
- 34.Sluimer JC, Gasc JM, van Wanroij JL, Kisters N, Groeneweg M, Sollewijn Gelpke MD, Cleutjens JP, van den Akker LH, Corvol P, Wouters BG, Daemen MJ, Bijnens AP. Hypoxia, hypoxia-inducible transcription factor, and macrophages in human atherosclerotic plaques are correlated with intraplaque angiogenesis. J Am Coll Cardiol. 2008;51:1258–65. doi: 10.1016/j.jacc.2007.12.025. [DOI] [PubMed] [Google Scholar]
- 35.Yuan S, Fu Y, Wang X, Shi H, Huang Y, Song X, Li L, Song N, Luo Y. Voltage-dependent anion channel 1 is involved in endostatin-induced endothelial cell apoptosis. FASEB J. 2008;22:2809–20. doi: 10.1096/fj.08-107417. [DOI] [PubMed] [Google Scholar]
- 36.Wolf A, Agnihotri S, Micallef J, Mukherjee J, Sabha N, Cairns R, Hawkins C, Guha A. Hexokinase 2 is a key mediator of aerobic glycolysis and promotes tumor growth in human glioblastoma multiforme. J Exp Med. 2011;208:313–26. doi: 10.1084/jem.20101470. [DOI] [PMC free article] [PubMed] [Google Scholar]
- 37.Yasuda S, Arii S, Mori A, Isobe N, Yang W, Oe H, Fujimoto A, Yonenaga Y, Sakashita H, Imamura M. Hexokinase II and VEGF expression in liver tumors: correlation with hypoxia-inducible factor 1 alpha and its significance. J Hepatol. 2004;40:117–23. doi: 10.1016/s0168-8278(03)00503-8. [DOI] [PubMed] [Google Scholar]
- 38.van Lookeren Campagne M, Thibodeaux H, van Bruggen N, Cairns B, Gerlai R, Palmer JT, Williams SP, Lowe DG. Evidence for a protective role of metallothionein-1 in focal cerebral ischemia. Proc Natl Acad Sci USA. 1999;96:12870–5. doi: 10.1073/pnas.96.22.12870. [DOI] [PMC free article] [PubMed] [Google Scholar]
- 39.Oshima Y, Fujio Y, Nakanishi T, Itoh N, Yamamoto Y, Negoro S, Tanaka K, Kishimoto T, Kawase I, Azuma J. STAT3 mediates cardioprotection against ischemia/reperfusion injury through metallothionein induction in the heart. Cardiovasc Res. 2005;65:428–35. doi: 10.1016/j.cardiores.2004.10.021. [DOI] [PubMed] [Google Scholar]
- 40.Penkowa M, Carrasco J, Giralt M, Moos T, Hidalgo J. CNS wound healing is severely depressed in metallothionein I- and II-deficient mice. J Neurosci. 1999;19:2535–45. doi: 10.1523/JNEUROSCI.19-07-02535.1999. [DOI] [PMC free article] [PubMed] [Google Scholar]
- 41.Youn J, Hwang SH, Ryoo ZY, Lynes MA, Paik DJ, Chung HS, Kim HY. Metallothionein suppresses collagen-induced arthritis via induction of TGF-beta and down-regulation of proinflammatory mediators. Clin Exp Immunol. 2002;129:232–9. doi: 10.1046/j.1365-2249.2002.01922.x. [DOI] [PMC free article] [PubMed] [Google Scholar]
- 42.Crowthers KC, Kline V, Giardina C, Lynes MA. Augmented humoral immune function in metallothionein-null mice. Toxicol Appl Pharmacol. 2000;166:161–72. doi: 10.1006/taap.2000.8961. [DOI] [PubMed] [Google Scholar]
- 43.Zbinden S, Wang J, Adenika R, Schmidt M, Tilan JU, Najafi AH, Peng X, Lassance-Soares RM, Iantorno M, Morsli H, Gercenshtein L, Jang GJ, Epstein SE, Burnett MS. Metallothionein enhances angiogenesis and arteriogenesis by modulating smooth muscle cell and macrophage function. Arterioscler Thromb Vasc Biol. 2010;30:477–82. doi: 10.1161/ATVBAHA.109.200949. [DOI] [PubMed] [Google Scholar]
- 44.Miyashita H, Sato Y. Metallothionein 1 is a downstream target of vascular endothelial zinc finger 1 (VEZF1) in endothelial cells and participates in the regulation of angiogenesis. Endothelium. 2005;12:163–70. doi: 10.1080/10623320500227101. [DOI] [PubMed] [Google Scholar]