

Abstract
Objective
To estimate the effect of breastfeeding duration on childhood obesity.
Data Source
The Child Development Supplement (CDS) of the Panel Study of Income Dynamics (PSID). The PSID provides extensive data on the income and well-being of a representative sample of U.S. families from 1968 to the present. The CDS collects information on the children in PSID families ranging from cognitive, behavioral, and health status to their family and neighborhood environment. The first two waves of the CDS were conducted in 1997 and 2002, respectively. The data provide information on 3,271 children and their mothers.
Study Design
We use the generalized propensity score to adjust for confounding based on continuous treatment, and the general additive model to analyze the adjusted association between treatment and the outcome conditional on the propensity score. The main outcome is the body mass index (BMI) directly assessed during the in-person interview in 2002. Covariates include family, maternal, and child characteristics, many of which were measured in the year the child was born.
Principal Findings
After using propensity scores to adjust for confounding, the relationship between breastfeeding duration and childhood BMI is trivially small across a range of model specifications, and none of them is statistically significant except the unadjusted model.
Conclusions
The causal link between duration of breastfeeding and childhood obesity has not been established. Any recommendation of promoting breastfeeding to reduce childhood obesity is premature.
Keywords: Breastfeeding duration, childhood obesity, generalized propensity score (GPS), generalized additive model (GAM), confounding
In recent decades, childhood obesity has increased rapidly (Wang and Lobstein 2006) and may jeopardize later health, imposing high costs of illness on society (Daniels 2006). In February 2010, First Lady Michelle Obama launched a national campaign, Let's Move!, to end the epidemic of childhood obesity within one generation. As part of this effort, President Obama established the Task Force on Childhood Obesity (Task Force). On May 10, 2010, the Task Force published 70 specific recommendations for reducing childhood obesity to the rate in the 1970s (5 percent) by 2030 (White House Task Force on Childhood Obesity 2010).
Reducing childhood obesity depends on an understanding of its etiology. Researchers have identified various causes, including reduced physical activity (Stettler, Signer, and Suter 2004). Other causes may occur early in life, such as formula feeding. As a result, the Task Force recommends breast-feeding promotion as one of the five strategies in early childhood (White House Task Force on Childhood Obesity 2010). Their recommendation reflects three systematic reviews and meta-analyses that included 54 qualified studies published from 1966 to 2003 (Arenz et al. 2004; Harder et al. 2005; Owen et al. 2005b).
Although the Task Force obviously interprets the evidence as strong enough to promote breastfeeding, others interpret the findings as less supportive. Three respected organizations—the Agency for Healthcare Research and Quality (AHRQ), the Centers for Disease Control and Prevention (CDC), and the World Health Organization (WHO)—conducted the meta-analyses as part of separate assessments of the effects of breastfeeding. ARHQ labeled the evidence as “tentative,” whereas the WHO reported a small protective effect of breastfeeding (Division of Nutrition and Physical Activity 2007; Horta et al. 2007; Ip et al. 2007).1 However, a review of the WHO report argues that no strong, clear, and consistent body of evidence supports the benefits of breastfeeding. The review's authors criticize the WHO report as selective in its inclusion of studies among other problems (2008).
At this point, one can only conclude that great inconsistency surrounds the research literature. The meta-analyses do not entirely agree with each other, and the reports that review the meta-analyses disagree as well. Underlying these inconsistencies is the challenge of establishing causality in observational settings.
Using the latest methodological development in the field, this study explores the usefulness of generalized propensity score (GPS) in examining the effects of breastfeeding duration on childhood obesity. An added strength of our analyses is the use of the generalized additive model (GAM) to estimate the mean for the outcome conditional on both actual and predicted breast-feeding duration (i.e., GPS) (Hastie and Tibshirani 1990; Fox 2000; Wood 2006). Doing so allows us to flexibly capture nonlinearities between the outcome and the treatment and identify the level of breastfeeding above which the benefits of breastfeeding are realized (the dose-response relationship).
Our analyses rely on a nationally representative sample from the Child Development Supplement (CDS) of the Panel Study of Income Dynamics (PSID). The sample provides a rich array of maternal, family, and child characteristics, and this richness will help us account for observed confounding.
Prior Research
The Challenge of Making Causal Inference for Breastfeeding
Breastfeeding reflects a wide range of child and family characteristics that also influence child outcomes, such as genetic, environment, behavioral, and certain socio-demographic factors. For example, Jiang, Foster, and Gibson-Davis (2011) report that breastfeeding mothers are better educated and have higher IQs; breastfed babies were half as likely to have been born small for gestational age. A key challenge, therefore, is to establish causality in observational studies.
Some studies only report associations of breastfeeding and childhood obesity. For example, Harder et al. (2005) reports crude odds ratios (OR) from primary studies. Cope and Allison (2008) also point out that the World Health Organization (WHO) report misuses the term “effect” for “association.” It seems clear, however, that endorsing breastfeeding for obesity reduction assumes a causal effect.
Other studies report adjusted relationship, but they differ in the number and nature of covariates included. In general, the more covariates, the smaller the effect of breast feeding. This tendency is confirmed by the meta-analyses. Arenz et al. (2004) found the adjusted OR was greater for studies including less than seven confounders than those adjusting for seven or more (adjusted OR 0.69 vs 0.78, respectively).2 In another meta-analysis, Owen and colleagues reported a 13 percent reduction in obesity associated with breast-feeding initiation (OR = 0.87; 95 percent CI: 0.85–0.89). However, after adjusting for confounding, the extent of reduction was greatly decreased (OR = 0.93; 95 percent CI: 0.88–0.99; Owen et al. 2005b).
Even with the right covariates, researchers need to adjust for potential confounders properly. Conventional methods such as ordinary least-squares regression have their own limitations. For example, regression typically assumes linear relationships between the covariates and the outcome as well as between the exposure and the covariates, which may not be the case.
In recent years, researchers also have been exploring alternative study designs to account for the limitations of observational studies. In a randomized breastfeeding promotion intervention, researchers found that the intervention substantially increased the duration and exclusivity of breastfeeding yet did not reduce adiposity at age 6.5 years (Kramer et al. 2007, 2009). Outside developed country settings where there is strong social patterning among SES and both breastfeeding and child health, studies also have reported similar findings. For example, Brion (2010) pointed out that in a study from Hong Kong, where the association of SES and breastfeeding may be weaker, the researchers found no association between breastfeeding and child adiposity after adjusting for confounding (Kwok et al. 2009).
Propensity Score-Based Methods for Selection Bias in Observational Studies
Recently, propensity score-based methods have been increasingly used in social science research. The propensity score is the predicted probability of assignment to treatment given a set of covariates. Rosenbaum and Rubin (1983) demonstrate that if treatment assignment is ignorable given the observed covariates, it is also ignorable given the balancing propensity score. This property, however, holds only as sample sizes approach infinity and so is only approximate in any finite sample. As a result, good practice involves comparing the distribution of covariates between groups.
The advantage of propensity score matching, therefore, lies in its convenience. It summarizes all the background information related to treatment assigned into a single scalar and relaxes the linearity assumption. In addition, propensity score provides a means of identifying participants or non-participants whose characteristics make them unique to one group or the other (e.g., where there is a “support” problem). These mismatched observations can be excluded from the analysis. Like regression, however, propensity score-based methods assume ignorability—that within strata defined by the covariates, breastfeeding is effectively randomized without any further, unobserved confounding. The absence of unobserved confounding is a key assumption that cannot be checked empirically (Lee 2005; Heckman and Vytlacil 2007).
Propensity score methods have been initially limited to binary treatments (Rosenbaum and Rubin 1983). Imbens, however, extends the method to the multi-group situation where treatment can have several levels (ordered or not) (Imbens 2000). His work involves calculating an average treatment effect by weighting observations by the inverse of the probability of treatment level actually observed. Jiang and colleagues have used both binary and multi-group approaches to study the effects of breastfeeding initiation and duration on child cognitive outcomes (Jiang, Foster, and Gibson-Davis 2010).
More recently, propensity score methods have been extended to continuous exposures (Hirano and Imbens 2004). Hirano and Imbens demonstrate that—conditioning on the generalized propensity score—differences in the distribution of covariates across levels of exposure are as if randomly assigned and do not induce (further) confounding. Kluve et al. (2007) have applied GPS to estimate a continuous dose-response relationship linking employment outcomes to job training.
The General Additive Model
When assessing the association between treatment and the outcome conditional on the GPS, the key task is to express  , where Y is the outcome for person I; X is treatment or exposure; and
  , the predicted level of treatment (the GPS). One could use ordinary regression with actual and predicted treatment as covariates. In that case, in the absence of unobserved confounding, the association between actual treatment and the outcome reflects a causal relationship. But as noted, that approach would assume linearity between treatment and outcome and between treatment dose and predicted dose.
Neither might be true, and capturing nonlinearities is important both to reduce confounding (X and  ) and for substantive reasons (Y and X). For this purpose, we used a GAM model to estimate the mean for the outcome conditional on both actual and predicted breastfeeding duration (Hastie and Tibshirani 1990; Wood 2006). The GAM fits a series of connected, smooth curves (or polynomials) capturing the relationship between a predictor and the outcome. The smooth curves are implemented as penalized regression splines; the degree of the polynomial is determined by a measure of model fit that includes a penalty for overfitting the data. This penalty is essential because such a flexible model would otherwise capture chance features of the data. In essence, the penalty ensures that the model captures the relationship between the covariate and the outcome most likely to recur in a new sample of observations.
This approach has several advantages over ordinary regression. For example, a linear fit may be especially sensitive to outliers representing extreme values of the covariate of interest. The resulting curve represents the expected value of the outcome at each level of breastfeeding but not conditional on the values of the covariates for the women who actually selected that level of breastfeeding. As noted, the principal disadvantages of the GAM involve the possibility of overfitting the data. In addition, because the model uses less data to estimate the conditional mean at each combination of covariate values, power is reduced. We consider this possibility in our analyses below. Finally, the model does not produce a single parameter that one can use to represent the relationship between the outcome and a covariate.
Methods
Data Sources
The Panel Study of Income Dynamics (PSID) has included extensive data on the income and well-being of a representative sample of U.S. families for nearly four decades. Data were collected annually from 1968 to 1997 and biennially after 1997 (McGonagle and Schoeni 2006). These data are an important source of much of what is known about poverty, income instability, and family well-being in the U.S. population (Duncan and Brooks-Gunn 1997).
The Child Development Supplement (CDS) is a special component of the PSID. In 1997, the PSID randomly selected 3,563 children born to study families between 1984 and 1997 and collected detailed assessment on their health and development. In 2002–2003, these families were re-interviewed, and data were successfully collected on 2,907 of these same children (PSID Data Center). These data have been used to analyze a range of topics involving children and their development (Chaudhuri and Marron 1999; Foster, Jiang, and Gibson-Davis 2010).
Study Sample
Of the original 3,563 children, 292 children were excluded from our analyses. These children met at least one of the following criteria: (1) they did not live with their biological mother at the time of the 1997 interview and thus any question related to the birth mother (such as breastfeeding) was not answered (n = 271); and they were missing information on (2) breastfeeding status (n = 11); (3) race and ethnicity (n = 5); and (4) date of birth (n = 5).
Variables
Outcome
Body mass index (BMI) is calculated for all children with height and weight data that were obtained during the in-person interview in 2002. At the time, the children are between 5 and 18 years old. Direct measurement represents 99 percent of the sample; for the other 1 percent, height and weight were reported as recorded at the child's last doctor's visit. For detailed data collection, see PSID-CDS User Report (Mainieri 2006). Following CDC guidelines, “overweight” and “obese” were defined as being at or above the 85th and 95th percentile of BMI for children of the same age and gender, respectively (Centers for Disease Control and Prevention).
Breastfeeding Duration
Duration of breastfeeding was reported up to 13 years retrospectively by the child's mother in the 1997 CDS interview. This duration ranges from 0 to 12 months and beyond. We truncated the distribution of breast feeding at 12 months for those who have longer duration (n = 268).
Covariates
On the basis of prior literature and data availability, our analyses included the following covariates. We include the child's age at the 1997 survey (between 4 months and 13 years old) (which may capture patterns across cohorts in breastfeeding), their race and ethnicity (white, non-Hispanic; black, non-Hispanic; and other), the child's gender, the number of siblings, whether the child was first born to the mother, whether the child was born preterm (e.g., gestational age is less than 37 weeks), whether the child was born small for gestational age (SGA) (e.g., weighing less than a specified percentile of birth weight for a given gestational age, we used a gender-specific SGA measure from Alexander and colleagues [1996]), the mother-rated child's health at birth as compared to other babies (1: worse; 2: same; 3: better), and the Home Observation for Measurement of the Environment (HOME) scale (a measure of cognitive stimulation and emotional support that parents provide to their children).
Maternal characteristics include IQ (taken from the passage completion test of Woodcock Johnson Test-Revised [Woodcock 1989; Woodcock and Johnson 1989] administered to mothers in 1997 CDS interview), education (high school dropout [omitted category]; completed high school; attended college), her age at the time of the child's birth, her self-rated health status (from 1 to 5: poor, fair, good, very good, and excellent), whether she was enrolled in WIC program or Medicaid during pregnancy, and whether she was working, married, or was the head of the household (e.g., the only adult) the year of the child's birth. Family-level characteristics include the household's income from the year of the child's birth.
Statistical Analysis
GPS Calculation
Like the propensity score for binary treatments, the GPS is calculated as the level of treatment predicted based on the covariates. We estimated the GPS using the zero-inflated Poisson (ZIP) model. The Poisson model is appropriate for modeling variables that can be represented as counts, such as months of breastfeeding. However, it assumes that all units have a positive probability of having a positive value (that is breastfeeding at least 1 month). This assumption may be false, and if so, the data have more units at zero than expected. The ZIP model, on the other hand, assumes that there are two latent groups of individuals in the data. One group indeed has a positive probability of having a positive outcome; the other is certain to have a zero count (Long and Freese 2006). Therefore, the ZIP model fits our data more flexibly. We estimated this model using Stata (StataCorp 2007).
Duration of Breastfeeding and Childhood Overweight/Obesity through GAM
We start with the unadjusted relationship between duration of breastfeeding and the BMI, followed by a linear regression model of breastfeeding duration and BMI adjusted for the covariates. Then, we examined a model that includes both GPS and the covariates using linear regression to adjust for the outcome and treatment. Finally, we present the result from GPS adjusted model using GAM. We estimated the GAM using the MGCV package in R (Wood 2006) except for Figure 1, which we prepared using Statistica (StatSoft 2010).
Figure 1.
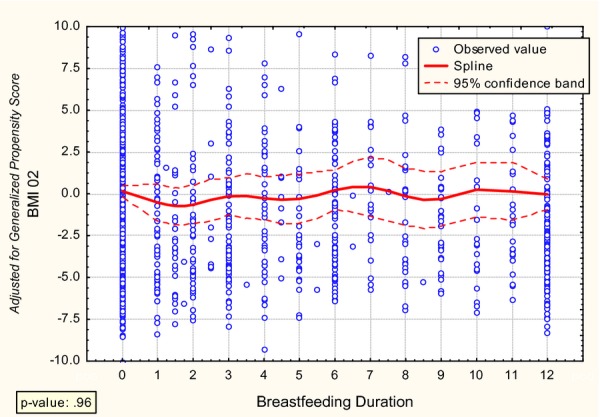
Relationship between Breastfeeding Duration and Subsequent Childhood Obesity
We start with the unadjusted relationship between duration of breastfeeding and the BMI, followed by a linear regression model of breastfeeding duration and BMI adjusted for the covariates. Then, we examined a model that includes both GPS and the covariates using linear regression to adjust for the outcome and treatment. Finally, we present the result from GPS adjusted model using GAM. We estimated the GAM using the MGCV package in R (Wood 2006) except for Figure 1, which we prepared using Statistica (StatSoft 2010).
Handling of Missing Data
The rate of missing data was relatively high for some covariates. Our core analyses rely on listwise-deleted data, and as a result, the descriptive statistics assume that the data are missing completely at random (MCAR). However, note that the analyses of outcomes assume only that the data are missing at random (MAR) (Allison 2002; Little and Rubin 2002). That is, within strata defined by the covariates, MAR assumes that the likelihood of missing data does not depend on the values of the missing data. (This statement depends on how the covariates are actually included in the model, and the flexibility provided by the GAM means that the findings are robust in terms of a broader array of forms of missingness.) As a check of our findings, we also generated imputations using a MAR-based imputation procedure (ICE [Royston 2005] embedded in Stata [StataCorp 2007]) and replicate the key analyses using the imputed data set (these results are available from the first author).
Results
Descriptive Statistics
Table 1 provides the unweighted listwise-deleted descriptive statistics for the study sample in several breastfeeding categories: never breast-fed, breastfeeding 1–6 months, 6–12 months, and more than 12 months. The table provides an overall sample size for each breastfeeding category, but the number of observations varies across the rows of the table, indicating some variables were missing much more often than others.
Table 1.
Descriptive Statistics
| Overall | Never Breastfed | 1–6 Months | 7–12 Months | 12+ Months | |||||||||||
|---|---|---|---|---|---|---|---|---|---|---|---|---|---|---|---|
| Obs* | Mean† | SD | Obs | Mean | SD | Obs | Mean | SD | Obs | Mean | SD | Obs | Mean | SD | |
| Sample size | 3,271 | 1,759 | 895 | 349 | 268 | ||||||||||
| Ever breastfeeding | 3,271 | 0.46 | 0.50 | 1,759 | 0.00 | 0.00 | 895 | 1.00 | 0.00 | 349 | 1.00 | 0.00 | 268 | 1.00 | 0.00 |
| Months of breast-feeding | 1,512 | 7.9 | 7.07 | 1,759 | 0.0 | 0.00 | 895 | 3.3 | 1.76 | 349 | 9.6 | 1.82 | 268 | 21.1 | 4.15 |
| Outcomes | |||||||||||||||
| BMI (measured in 2002) | 3,271 | 21.34 | 6.10 | 1,294 | 21.88 | 6.42 | 659 | 20.68 | 5.70 | 276 | 20.68 | 5.48 | 188 | 20.33 | 5.65 |
| Covariates | |||||||||||||||
| Child (at 1997 survey) | |||||||||||||||
| Female | 3,271 | 0.49 | 0.50 | 1,759 | 0.49 | 0.50 | 895 | 0.49 | 0.50 | 349 | 0.52 | 0.50 | 268 | 0.50 | 0.50 |
| Age (months) | 3,271 | 89.3 | 46.0 | 1,759 | 91.8 | 45.5 | 895 | 87.2 | 45.9 | 349 | 91.3 | 45.3 | 268 | 78.1 | 48.2 |
| No. of siblings | 3,271 | 1.4 | 1.2 | 1,726 | 1.4 | 1.2 | 889 | 1.4 | 1.3 | 348 | 1.4 | 1.1 | 262 | 1.3 | 1.1 |
| First born | 3,271 | 0.41 | 0.49 | 1,721 | 0.39 | 0.49 | 874 | 0.43 | 0.50 | 340 | 0.39 | 0.49 | 263 | 0.42 | 0.49 |
| Black | 3,271 | 0.40 | 0.49 | 1,759 | 0.57 | 0.50 | 895 | 0.21 | 0.41 | 349 | 0.14 | 0.34 | 268 | 0.21 | 0.40 |
| White | 3,271 | 0.47 | 0.50 | 1,759 | 0.34 | 0.47 | 895 | 0.60 | 0.49 | 349 | 0.68 | 0.47 | 268 | 0.64 | 0.48 |
| Other | 3,271 | 0.13 | 0.34 | 1,759 | 0.09 | 0.28 | 895 | 0.19 | 0.39 | 349 | 0.18 | 0.39 | 268 | 0.16 | 0.36 |
| HOME measure‡ | 3,271 | 17.8 | 3.1 | 1,759 | 17.4 | 3.0 | 895 | 18.2 | 3.0 | 349 | 18.8 | 3.0 | 268 | 17.6 | 3.3 |
| Born preterm | 3,271 | 0.08 | 0.28 | 1,759 | 0.10 | 0.30 | 894 | 0.07 | 0.25 | 349 | 0.03 | 0.18 | 268 | 0.06 | 0.24 |
| Born small for gestational age | 3,271 | 0.15 | 0.36 | 1,759 | 0.20 | 0.40 | 895 | 0.10 | 0.30 | 349 | 0.12 | 0.32 | 268 | 0.07 | 0.26 |
| Child's health status at birth§ | 3,271 | 2.21 | 0.57 | 1,752 | 2.13 | 0.55 | 893 | 2.27 | 0.59 | 349 | 2.35 | 0.58 | 266 | 2.28 | 0.60 |
| Mother (at 1997 survey) | |||||||||||||||
| WIC participation | 3,271 | 0.43 | 0.50 | 1,738 | 0.55 | 0.50 | 864 | 0.32 | 0.47 | 325 | 0.23 | 0.42 | 253 | 0.26 | 0.44 |
| Mom's age giving birth (years) − 20 | 3,271 | 7.3 | 5.8 | 1,758 | 6.4 | 5.8 | 895 | 8.0 | 5.4 | 349 | 9.5 | 5.4 | 268 | 8.7 | 6.2 |
| IQ | 3,271 | 30.6 | 5.4 | 1,328 | 29.0 | 5.3 | 703 | 32.2 | 4.7 | 283 | 32.8 | 5.8 | 209 | 33.0 | 4.9 |
| Mother (at 1997 survey) | |||||||||||||||
| Education | |||||||||||||||
| High school dropout | 3,271 | 0.14 | 0.35 | 1,759 | 0.20 | 0.40 | 895 | 0.08 | 0.27 | 349 | 0.06 | 0.24 | 268 | 0.08 | 0.28 |
| High school graduate | 3,271 | 0.35 | 0.48 | 1,759 | 0.42 | 0.49 | 895 | 0.30 | 0.46 | 349 | 0.20 | 0.40 | 268 | 0.24 | 0.43 |
| College or more | 3,271 | 0.38 | 0.49 | 1,759 | 0.28 | 0.45 | 895 | 0.46 | 0.50 | 349 | 0.56 | 0.50 | 268 | 0.51 | 0.50 |
| Mother (year of child birth) | |||||||||||||||
| Annual family income ($) | 3,271 | 35,029 | 31,757 | 1,528 | 28,357 | 26,014 | 721 | 43,016 | 32,256 | 274 | 45,544 | 47,455 | 228 | 43,622 | 29,681 |
| Married | 3,271 | 0.63 | 0.48 | 1,759 | 0.50 | 0.50 | 895 | 0.75 | 0.43 | 349 | 0.83 | 0.38 | 268 | 0.76 | 0.43 |
| Employed | 3,271 | 0.45 | 0.50 | 1,377 | 0.43 | 0.50 | 681 | 0.55 | 0.50 | 262 | 0.47 | 0.50 | 207 | 0.48 | 0.50 |
| Head of household¶ | 3,271 | 0.16 | 0.36 | 1,424 | 0.21 | 0.41 | 695 | 0.09 | 0.29 | 267 | 0.04 | 0.21 | 217 | 0.07 | 0.26 |
| Self-rated health status‖ | 3,271 | 4.1 | 1.0 | 1,358 | 4.0 | 1.0 | 689 | 4.14 | 0.87 | 264 | 4.13 | 0.91 | 211 | 4.23 | 0.84 |
| Received Medicaid during pregnancy | 3,271 | 0.35 | 0.48 | 1,736 | 0.44 | 0.50 | 862 | 0.25 | 0.43 | 325 | 0.19 | 0.39 | 252 | 0.25 | 0.44 |
Number of observations.
Mean or proportion.
Home observation for measurement of the environment.
1: Worse; 2: Same; 3: Better (as compared with other babies born at birth).
Indicates that mother was the only adult in the household.
1: Poor; 2: Fair; 3: Good; 4: Very good; 5: Excellent.
In our sample, 46 percent of the mothers reported having ever breastfed their babies. The average length of breastfeeding is 7.9 months for breastfeeding mothers. Eight percent of all children were born prematurely, and 15 percent were born small for gestational age. One in seven mothers did not complete high school, and one third were unmarried when the child was born. Mothers were on average 27 years old at the time of the birth, and 40 percent were African American. Their average annual family income is $35,000 and more than half were not employed at the child's birth.
However, we find a huge difference in many key characteristics across breastfeeding levels. For example, for those who never breastfed, they are more likely to be black women, to have premature or SGA babies, to have lower educational achievement and IQ, to be unmarried and the only adult in the household, to be poor, and to be participating WIC or Medicaid program during pregnancy. This is consistent with previous findings that socioeconomic factors are confounded with breastfeeding status.
Generalized Propensity Score
As noted in the Method section, we used a ZIP model to generate the GPS. Parameter estimates are presented in Table 2. The table presents three sets of estimates—“factor change” estimates for the equation predicting the amount of breast feeding (panel A); odds ratios for the model predicting membership in the latent class, “never breastfeeding” (panel B); and “marginal effects” (panel C).
Table 2.
The Zero-Inflated Poisson Model for Generalized Propensity Score
| A. Poisson Model for Months Breast-feeding Duration | B. Logit Model for Latent Class, “No Breastfeeding” | Marginal Effects | |||||||
|---|---|---|---|---|---|---|---|---|---|
| Covariates | Factor Change† | 95% CI | Odds Ratio | 95% CI | ME | 95% CI | |||
| Child (at 1997 survey) | |||||||||
| Female | 1.060* | 1.004 | 1.118 | 1.015 | 0.819 | 1.257 | 0.139 | −0.206 | 0.480 |
| Age (years) | 1.003 | 0.994 | 1.012 | 1.004** | 1.001 | 1.007 | −0.006* | −0.010 | 0.000 |
| No. of siblings | 0.966* | 0.940 | 0.992 | 0.849** | 0.761 | 0.948 | 0.142 | −0.034 | 0.320 |
| First born | 0.983 | 0.922 | 1.048 | 0.684** | 0.524 | 0.892 | 0.505* | 0.081 | 0.930 |
| Black | 0.950 | 0.873 | 1.035 | 2.882*** | 2.179 | 3.810 | −1.620*** | −2.039 | −1.200 |
| HOME measure‡ | 0.996 | 0.985 | 1.007 | 0.976 | 0.932 | 1.021 | 0.025 | −0.047 | 0.100 |
| Born preterm | 0.878 | 0.769 | 1.002 | 1.282 | 0.839 | 1.959 | −0.662* | −1.271 | −0.050 |
| Born small for gestational age | 1.046 | 0.946 | 1.157 | 1.380 | 0.984 | 1.937 | −0.353 | −0.906 | 0.200 |
| Child's health status at birth§ | 1.042 | 0.994 | 1.092 | 0.688*** | 0.567 | 0.833 | 0.660*** | 0.352 | 0.970 |
| Mother (at 1997 survey) | |||||||||
| WIC participation | 0.998 | 0.908 | 1.097 | 1.387* | 1.020 | 1.886 | −0.480 | −0.984 | 0.020 |
| Mom's age giving birth (years) − 20 | 1.015*** | 1.009 | 1.022 | 0.967* | 0.943 | 0.993 | 0.090*** | 0.048 | 0.130 |
| IQ | 1.014*** | 1.006 | 1.021 | 0.922*** | 0.897 | 0.947 | 0.157*** | 0.113 | 0.200 |
| Education | |||||||||
| High school graduate | 0.780*** | 0.691 | 0.879 | 0.964 | 0.660 | 1.407 | −0.617* | −1.228 | −0.010 |
| College or more | 0.874* | 0.769 | 0.994 | 0.599* | 0.393 | 0.911 | 0.372 | −0.323 | 1.070 |
| Mother (year of child birth) | |||||||||
| Annual family income ($) | 0.951* | 0.907 | 0.997 | 1.014 | 0.847 | 1.215 | −0.160 | −0.452 | 0.130 |
| Married | 0.940 | 0.837 | 1.056 | 0.787 | 0.544 | 1.140 | 0.183 | −0.443 | 0.810 |
| Employed | 0.835*** | 0.788 | 0.885 | 1.115 | 0.882 | 1.411 | −0.655*** | −1.033 | −0.280 |
| Head of household¶ | 0.813** | 0.702 | 0.941 | 1.093 | 0.706 | 1.693 | −0.646* | −1.291 | 0.000 |
| Self-rated health status‖ | 1.026 | 0.992 | 1.060 | 0.965 | 0.852 | 1.093 | 0.122 | −0.081 | 0.320 |
| Received Medicaid during pregnancy | 0.922 | 0.832 | 1.022 | 0.821 | 0.580 | 1.162 | 0.059 | −0.506 | 0.620 |
| Constant | 5.134*** | 3.543 | 7.439 | 60.076*** | 14.627 | 246.738 | |||
*Significant at .05 level; **significant at .01 level; ***significant at .001 level.
Change in the expected months of breast-feeding resulted from one unit of change in the covariate, holding other covariates constant.
Home observation for measurement of the environment scale.
1: Worse; 2: Same; 3: Better (as compared with other babies born at birth).
Indicates that mother was the only adult in the household.
1: Poor; 2: Fair; 3: Good; 4: Very good; 5: Excellent.
The estimates in panel A represent the effect of the covariate on the Poisson rate of breastfeeding in the latent class with a positive probability of any breast feeding. The expected number of months breastfeeding for women with a female infant is 6 percent higher than for other mothers. One can see that a range of the other covariates is significant, such as mother's IQ: higher IQ mothers breastfeed for longer when they do breastfeed. To the extent that these covariates predict children's outcomes as well, they potentially confound the relationship between those outcomes and breast feeding.
Panel B identifies predictors of membership in the latent class “no breastfeeding.” These are women with a zero probability of breastfeeding and are a subset of all women observed with no breastfeeding. A range of covariates predicts no breastfeeding. For example, the odds ratio for race is nearly 3 (2.88). Women with higher IQ are also significantly less likely (OR < 1) to not breastfeed. One can see that the two effects of breastfeeding work in opposite directions, and this complexity would not be apparent in a linear model.
Panel C combines the two estimates to produce an overall estimate of the effect of the covariate on the expected number of months breastfeeding. One can see that some are quite large. Black women, for example, are expected to breastfeed 1.62 fewer months than their white counterparts. IQ also has a substantial net positive impact—for each IQ point, a woman is expected to breastfeed 16 months more. This effect captures the effect of IQ on the likelihood of any breastfeeding as well as on the level of breastfeeding. These results are consistent with prior research.
Covariate Balance Checking
A key step in propensity score analysis is to examine how the covariates are balanced after conditioning on the propensity score is accomplished. Table 3 provides the p values for key covariates in both unadjusted GAM and GPS adjusted GAM model. These p values are generated through the same process where we examine the outcomes. Essentially, we run separate GAM model with each covariate as the outcome and a smoothed breastfeeding duration variable as the only independent variable. We can see that for unadjusted GAM model, consistent with our descriptive table and GPS table, the majority of the covariates are imbalanced. However, after adjusting for the GPS, all differences in the means of the covariates across levels of breastfeeding are no longer significant at the p = .05 level.
Table 3.
Covariate Balance Checking under GPS GAM Model
| Covariate | p Value | |
|---|---|---|
| Unadjusted GAM | GPS Adjusted GAM | |
| Child (at 1997 survey) | ||
| Female | .455 | .97 |
| Age (months) | <.001*** | .09 |
| No. of siblings | .78 | .29 |
| First born | .589 | .40 |
| Black | <.001*** | .51 |
| HOME measure | <.001*** | .18 |
| Born preterm | <.001*** | .93 |
| Born small for gestational age | <.001*** | .78 |
| Child's health status at birth | <.001*** | .77 |
| Mother (at 1997 survey) | ||
| WIC participation | <.001*** | .69 |
| Mom's age giving birth (years) − 20 | <.001*** | .87 |
| IQ | <.001*** | .92 |
| High school graduate | <.001*** | .79 |
| College or more | <.001*** | .94 |
| Mother (year of child birth) | ||
| Annual family income ($) | <.001*** | .82 |
| Married | <.001*** | .62 |
| Employed | <.001*** | .07 |
| Head of household | <.001*** | .62 |
| Self-rated health status | <.001*** | .91 |
| Received Medicaid during pregnancy | <.001*** | .70 |
*Significant at .05 level; **significant at .01 level; ***significant at .001 level.
GAM, generalized additive model; GPS, generalized propensity score; HOME, home observation for measurement of the environment.
Outcome Comparison
Table 4 provides the p value for estimating the effect of breastfeeding duration on BMI for four models: unadjusted, linear regression adjusted, GPS adjusted linear regression, and GPS adjusted GAM model. We can see that except for the unadjusted model, all other three models have found a nonsignificant relationship between breastfeeding duration and childhood BMI.
Table 4.
Effect of Breastfeeding Duration on BMI-Alternative Models
| Model | Effect | SE | p Value |
|---|---|---|---|
| Unadjusted | −0.120 | 0.030 | <.0001 |
| Linear regression adjusted | 0.004 | 0.036 | .92 |
| GPS adjusted linear regression | −0.0004 | 0.041 | .99 |
| GPS adjusted GAM | .99 |
BMI, body mass index; GAM, generalized additive model; GPS, generalized propensity score.
To further visualize the relationship over a continuous level of breastfeeding, Figure 1 describes the estimated, adjusted relationship between months of breastfeeding and BMI. The figure reveals no relationship of any practical or statistical significance (p = .96). We find no evidence of any effect of breastfeeding on childhood obesity. Although our methodology allowed for threshold effects or other nonlinearities, the line in Figure 1 is quite flat. The results of the GAM confirm this conclusion. The best fitting model has an effective degrees of freedom equal to one—a straight line.
The insignificant results are not the result of inadequate statistical power. Figure 1 presents the confidence bands for the fitted effects, and one can see that these are relatively narrow. Because of the large sample size, statistical power was adequate even for the flexible model. The estimated effects are precise and very small in practical terms as well. Even the top of the 95 percent confidence band is still only 2 BMI points.
Sensitivity Analyses
We conducted two sensitivity analyses relaxing key assumptions that shaped our main analyses. In particular, we considered the role of measurement error in the breastfeeding measure. That measure is up to 13 years retrospective, therefore, reporting error may have diluted the relationships of interest. For that reason, we performed the analyses using only the children in the sample ages 7 or younger. The presumption is that these mothers are more accurate when the breastfeeding occurred more recently. We find that limiting the sample in this way does not influence the results. In addition, we considered the relationship between breastfeeding and a dichotomous measure of obesity consistent with past research. We find no relationship.
Discussion
The protective effects of breastfeeding on later obesity have been debated for 30 years. The major challenge is to establish causality in observational studies, as breastfeeding and child health are intertwined with social, environmental, maternal, and family characteristics. Analytical techniques play an important role in addressing confounding in observational studies. As we have described in the Prior Research section, prior studies have various issues with covariate inclusion and adjustment, among others. Traditional methods such as ordinary regression have key limitations in the underlying and model specification.
Using generalized propensity score and general additive model, this study has examined the relationship between duration of breastfeeding and the risk of childhood obesity. In general, we find no significant relationship between months of breastfeeding and the child's BMI. Our finding seems robust when we considered children ages 7 or younger, or a dichotomous measure of obesity. We could find no readily identifiable subgroup for which breastfeeding reduces future childhood obesity. Our findings are consistent with the emerging trend in research on breastfeeding and childhood obesity—studies with large sample sizes, sound study design, and adequate covariates adjustment generally find no significant relationship.
Although our analysis plan involved a fairly elaborate effort to deal with non-linearities, the relationship between breastfeeding and BMI appears linear. In that light, we interpret our efforts as another form of sensitivity analyses. In response to an article that assumed a linear relationship between breast-feeding duration and outcomes, breastfeeding advocates might very well argue for threshold effects: “If only women breastfed longer, effects would emerge”. Our analyses anticipate this response and demonstrate that no such nonlinearity exists.
We hope our article illustrates good empirical practice in that we selected our methodology (before we examined the data) based on what is none or suspected about the empirical phenomenon of interest. In this case, the payoff to doing so was somewhat limited. In terms of analyses of other phenomena, other researchers would do well to consider similar nonlinearities before moving quickly to use a linear model.
Our study does suffer from limitations. In particular, we use a retrospective cohort, which is subject to recall bias. As Adair (2009) pointed out, mothers tended to report a longer duration of breastfeeding and the recall was more accurate for firstborn than for later-born. However, when we examined those who reported breastfeeding at both 1997 and 2002 waves, we found a correlation of 0.90 for breastfeeding initiation, and 0.83 for breastfeeding duration. In addition, when we limit our sample to children ages 7 or younger, reducing the likelihood of large recall bias, our results do not change. Furthermore, we compared our unadjusted relationship between breastfeeding duration and BMI with a prospective cohort study of breastfeeding duration on Dutch children's BMI at age 7 (Scholtens et al. 2007). The level of BMI is higher at all levels of breastfeeding in the US data, but the BMI-breastfeeding relationship is very similar and very small. Although not shown in Table 1, we also compare the prevalence and duration of breastfeeding in this sample to what was reported in the National Health and Nutrition Examination Survey during the same period (NHANES 1988–1994) (Li et al. 2002). For example, the overall breastfeeding prevalence, that for non-Hispanic white, and for non-Hispanic black was 53.6, 60.2, and 26.3 percent for NHANES sample (Li et al. 2002). The same prevalence was 46.0, 61.0, and 22.7 percent for PSID sample. The amount of breastfeeding was also reasonably close between the two samples. Overall, 22.4 and 8.9 percent of the NHANES III sample were still breastfeeding at 6 and 12 months (Li et al. 2002). Those for the PSID sample were 23.9 and 10.9 percent, respectively. The consistency across studies is reassuring.
In addition, GPS only controls for observed confounding. Other factors, such as maternal BMI and weight gain during pregnancy, may play a confounding role. However, this possibility is unlikely: these factors would have to have strong effects on both breastfeeding and childhood obesity beyond the variables included here to overturn our conclusion. And that relationship would have to be such that unobserved factors that harm children's health would have to be positively related to breastfeeding. That certainly does not appear to be the case with observed factors. Many of the factors linked to children's health are also positively associated with breastfeeding.
Nonetheless, future research might implement methods that do not depend on ignorability. One option would be instrumental variables estimation; this approach requires identifying a determinant of key outcomes, the effect of which is fully mediated by breastfeeding. Another approach would be to condition on unobserved factors, such as sibling models. These models have been used to better understand the effect of various exposures, including teenage childbearing (Geronimus and Korenman 1992; Hoffman, Foster, and Furstenberg 1993) and teenage employment (Foster 1995). Using CDS data, Metzger and McDade (2010) apply fixed-effects estimation to consider the effect of breastfeeding. Although the authors suggest that these analyses reveal a new larger effect of breastfeeding, their analyses do not support this claim. First, they do not conduct the statistical test (the Hausman–Wu test) that is a standard part of fixed-effects estimation. This test reveals that the difference between the fixed effects and ordinary regression estimates is not statistically significant—the difference in the estimates, in other words, cannot be attributed to anything other than chance. Second, and more fundamentally, it is not clear that the fixed-effect estimate is less biased. Sibling analysis involves within-family variation only. It may very well be that a mother's breastfeeding choices are tuned to the baby's health or other characteristics. In other words, the sorting of breastfeeding behavior within families may represent greater confounding than the sorting across families.3
In summary, the recommendation made by the Task Force to promote breastfeeding as a measure of preventing childhood obesity should be reconsidered. After all, basic time series evidence would seem to suggest a limited role for breastfeeding in reducing obesity: recent decades have seen a dramatic increase in both the rate of breastfeeding initiation and exclusivity (Ryan, Wenjun, and Acosta 2002), and childhood overweight/obesity (Wang and Lobstein 2006). Breastfeeding may indeed have many health benefits for infants and mothers, but it is not a magic cure for childhood obesity. We should invest more efforts on addressing the direct causes of childhood obesity, such as increasing physical activity and improving the child's dietary intake.
Acknowledgments
Joint Acknowledgment/Disclosure Statement: This study was not funded by any governmental or nongovernmental agency.
Disclosures: None.
Disclaimers: None.
Notes
A fourth meta-analysis examined the link between breastfeeding and body mass index (BMI) (Owen et al. 2005a).
Another issue involves problems common to meta-analyses more generally, such as publication bias.
Note that we replicated the methodology used in Metzger and McDade. While those authors report the effect of breastfeeding as statistically significant, in our analyses these effects were of comparable size but not statistically significant. We also estimated the relationship between months breastfeeding and children's BMI and obesity. Neither relationship was statistically significant, and we saw no evidence of a dose-response relationship.
SUPPORTING INFORMATION
Additional supporting information may be found in the online version of this article:
Appendix SA1: Author Matrix.
Please note: Wiley-Blackwell is not responsible for the content or functionality of any supporting materials supplied by the authors. Any queries (other than missing material) should be directed to the corresponding author for the article.
References
- Adair LS. “Methods Appropriate for Studying the Relationship of Breast-Feeding to Obesity”. Journal of Nutrition. 2009;139(2):408S–411S. doi: 10.3945/jn.108.097808. [DOI] [PubMed] [Google Scholar]
- Alexander GR, Himes JH, Kaufman RB, Mor J, Kogan M. “A United States National Reference for Fetal Growth”. Obstetrics and Gynecology. 1996;87(2):163–8. doi: 10.1016/0029-7844(95)00386-X. [DOI] [PubMed] [Google Scholar]
- Allison PD. Missing Data. Thousand Oaks, CA: Sage Publications, Inc; 2002. [Google Scholar]
- Arenz S, Ruckerl R, Koletzko B, Von Kries R. “Breast-Feeding and Childhood Obesity–A Systematic Review”. International Journal of Obesity. 2004;28(10):1247–56. doi: 10.1038/sj.ijo.0802758. [DOI] [PubMed] [Google Scholar]
- Brion MJ. “Commentary: Assessing the Impact of Breastfeeding on Child Health: Where Conventional Methods Alone Fall Short for Reliably Establishing Causal Inference”. International Journal of Epidemiology. 2010;39(1):306–307. doi: 10.1093/ije/dyp318. [DOI] [PubMed] [Google Scholar]
- Centers for Disease Control and Prevention. “Defining Childhood Overweight and Obesity”. [accessed on April 21, 2010]. Available at http://www.cdc.gov/obesity/childhood/defining.html.
- Chaudhuri P, Marron JS. “SiZer for Exploration of Structures in Curves”. Journal of the American Statistical Association. 1999;94(447):807–8. [Google Scholar]
- Cope MB, Allison DB. “Critical Review of the World Health Organization's (WHO) 2007 Report on'Evidence of the Long-Term Effects of Breastfeeding: Systematic Reviews and Meta-Analysis' with Respect to Obesity”. Obesity Reviews. 2008;9(6):594–605. doi: 10.1111/j.1467-789X.2008.00504.x. [DOI] [PubMed] [Google Scholar]
- Daniels SR. “The Consequences of Childhood Overweight and Obesity”. The Future of Children. 2006;16(1):47–67. doi: 10.1353/foc.2006.0004. [DOI] [PubMed] [Google Scholar]
- Division of Nutrition and Physical Activity. “Does Breastfeeding Reduce the Risk of Pediatric Overweight?”. Atlanta: Centers for Disease Control and Prevention; 2007. Research to Practice Series No. 4. [Google Scholar]
- Duncan GJ, Brooks-Gunn J. Consequences of Growing Up Poor. New York: Russell Sage Foundation; 1997. [Google Scholar]
- Foster EM. “Why Teens Do Not Benefit from Work Experience Programs”. Journal of Policy Analysis and Management. 1995;14(3):393–414. [Google Scholar]
- Foster EM, Jiang M, Gibson Davis CM. “The Effect of the WIC Program on the Health of Newborns”. Health Services Research. 2010;45(4):1083–104. doi: 10.1111/j.1475-6773.2010.01115.x. [DOI] [PMC free article] [PubMed] [Google Scholar]
- Fox J. Multiple and Generalized Nonparametric Regression. Thousand Oaks, CA: Sage Publications; 2000. [Google Scholar]
- Geronimus AT, Korenman S. “The Socioeconomic Consequences of Teen Childbearing Reconsidered”. The Quarterly Journal of Economics. 1992;107(4):1187–214. [Google Scholar]
- Harder T, Bergmann R, Kallischnigg G, Plagemann A. “Duration of Breastfeeding and Risk of Overweight: A Meta-Analysis”. American Journal of Epidemiology. 2005;162(5):397–403. doi: 10.1093/aje/kwi222. [DOI] [PubMed] [Google Scholar]
- Hastie TJ, Tibshirani RJ. Generalized Additive Models. New York, NY: Chapman & Hall/CRC; 1990. [Google Scholar]
- Heckman JJ, Vytlacil EJ. “Econometric Evaluation of Social Programs, Part I: Causal Models, Structural Models and Econometric Policy Evaluation”. Handbook of Econometrics. 2007;6:4779–874. [Google Scholar]
- Hirano K, Imbens GW. “The Propensity Score with Continuous Treatments”. In: Gelman A, Ming XL, editors. Applied Bayesian Modeling and Causal Inference from Incomplete-Data Perspectives: An Essential Journey with Donald Rubin's Statistical Family. New York: John Wiley & Sons, Ltd; 2004. pp. 73–84. [Google Scholar]
- Hoffman SD, Foster EM, Furstenberg FF., Jr “Re-Evaluating the Costs of Teenage Childbearing”. Demography. 1993;30(1):1–13. [PubMed] [Google Scholar]
- Horta BL, Bahl R, Martines JC, Victora CG. Evidence on the Long-Term Effects of Breastfeeding. Geneva: World Health Organization; 2007. [Google Scholar]
- Imbens GW. “The Role of the Propensity Score in Estimating Dose-Response Functions”. Biometrika. 2000;87(3):706–10. [Google Scholar]
- Ip S, Chung M, Raman G, Chew P, Magula N, DeVine D, Trikalinos T, Lau J. “Breastfeeding and Maternal and Infant Health Outcomes in Developed Countries”. Rockville, MD: Agency for Healthcare Research and Quality; 2007. AHRQ Publication No. 07-E007. [PMC free article] [PubMed] [Google Scholar]
- Jiang M, Foster EM, Gibson-Davis CM. “Breastfeeding and the Child Cognitive Outcomes: A Propensity Score Matching Approach”. Maternal and Child Health Journal. 2011;15(8):1296–1307. doi: 10.1007/s10995-010-0677-5. [DOI] [PubMed] [Google Scholar]
- Kluve J, Schneider H, Uhlendorff A, Zhao Z. Evaluating Continuous Training Programs Using the Generalized Propensity Score. Berlin, Germany: Institute for Economic Research; 2007. Discussion Paper 752. [Google Scholar]
- Kramer MS, Matush L, Vanilovich I, Platt RW, Bogdanovich N, Sevkovskaya Z, Dzikovich I, Shishko G, Collet JP, Martin RM. “Effects of Prolonged and Exclusive Breastfeeding on Child Height, Weight, Adiposity, and Blood Pressure at Age 6.5 y: Evidence from a Large Randomized Trial”. American Journal of Clinical Nutrition. 2007;86(6):1717–1721. doi: 10.1093/ajcn/86.5.1717. [DOI] [PubMed] [Google Scholar]
- Kramer MS, Matush L, Vanilovich I, Platt RW, Bogdanovich N, Sevkovskaya Z, Dzikovich I, Shishko G, Collet JP, Martin RM. “A Randomized Breast-Feeding Promotion Intervention Did Not Reduce Child Obesity in Belarus”. Journal of Nutrition. 2009;139(2):417S–421S. doi: 10.3945/jn.108.097675. [DOI] [PubMed] [Google Scholar]
- Kwok MK, Schooling CM, Lam TH, Leung GM. “Does Breastfeeding Protect against Childhood Overweight? Hong Kong's' Children of 1997' Birth Cohort”. International Journal of Epidemiology. 2009;39(1):297–305. doi: 10.1093/ije/dyp274. [DOI] [PubMed] [Google Scholar]
- Lee M. Micro-Econometrics for Policy, Program, and Treatment Effects. New York: Oxford University Press; 2005. [Google Scholar]
- Li R, Ogden C, Ballew C, Gillespie C, Grummer-Strawn L. “Prevalence of Exclusive Breastfeeding among US Infants: The Third National Health and Nutrition Examination Survey (phase II, 1991–1994)”. American Journal of Public Health. 2002;92(7):1107–1110. doi: 10.2105/ajph.92.7.1107. [DOI] [PMC free article] [PubMed] [Google Scholar]
- Little RJA, Rubin DB. Statistical Analysis with Missing Data. Hoboken, NJ: John Wiley and Sons, Inc; 2002. [Google Scholar]
- Long JS, Freese J. Regression Models for Categorical Dependent Variables Using Stata. College Station, TX: Stata Press; 2006. [Google Scholar]
- Mainieri T. 2006. “The Panel Study of Income Dynamics Child Development Supplement: User Guide for CDS-II”. [accessed on December 5, 2006]. Available at http://psidonline.isr.umich.edu/CDS/cdsii_userGd.pdf. [Google Scholar]
- McGonagle KA, Schoeni RF. “The Panel Study of Income Dynamics: Overview & Summary of Scientific Contributions after Nearly 40 Years”. 2006 [accessed on May 21, 2007, 2006]. Available at http://www.psidonline.isr.umich.edu/Publications/Papers/montreal.pdf. [Google Scholar]
- Metzger MW, McDade TW. “Breastfeeding as Obesity Prevention in the United States: A Sibling Difference Model”. American Journal of Human Biology. 2010;22(3):291–6. doi: 10.1002/ajhb.20982. [DOI] [PubMed] [Google Scholar]
- Owen CG, Martin RM, Whincup PH, Davey-Smith G, Gillman MW, Cook DG. “The Effect of Breastfeeding on Mean Body Mass Index throughout Life: A Quantitative Review of Published and Unpublished Observational Evidence”. American Journal of Clinical Nutrition. 2005a;82(6):1298–1307. doi: 10.1093/ajcn/82.6.1298. [DOI] [PubMed] [Google Scholar]
- Owen CG, Martin RM, Whincup PH, Smith GD, Cook DG. “Effect of Infant Feeding on the Risk of Obesity across the Life Course: A Quantitative Review of Published Evidence”. Pediatrics. 2005b;115(5):1367–1377. doi: 10.1542/peds.2004-1176. [DOI] [PubMed] [Google Scholar]
- PSID Data Center. “CDS Frequently Asked Questions”. [accessed on May 21, 2007]. Available at http://psidonline.isr.umich.edu/CDS/faq.aspx.
- Rosenbaum PR, Rubin DB. “The Central Role of the Propensity Score in Observational Studies for Causal Effects”. Biometrika. 1983;70(1):41–55. [Google Scholar]
- Royston P. “Multiple Imputation of Missing Values: Update of ICE”. Stata Journal. 2005;5(4):527–36. [Google Scholar]
- Ryan AS, Wenjun Z, Acosta A. “Breastfeeding Continues to Increase into the New Millennium”. Pediatrics. 2002;110(6):1103–9. doi: 10.1542/peds.110.6.1103. [DOI] [PubMed] [Google Scholar]
- Scholtens S, Gehring U, Brunekreef B, Smit HA, de Jongste JC, Kerkhof M, Gerritsen J, Wijga AH. “Breastfeeding, Weight Gain in Infancy, and Overweight at Seven Years of Age”. American Journal of Epidemiology. 2007;165(8):919–26. doi: 10.1093/aje/kwk083. [DOI] [PubMed] [Google Scholar]
- StataCorp. Stata Statistical Software: Release 10. College Station, TX: 2007. (release) [Google Scholar]
- StatSoft. Tulsa, OK: 2010. Statistica for Windows [Version 10] (release) [Google Scholar]
- Stettler N, Signer TM, Suter PM. “Electronic Games and Environmental Factors Associated with Childhood Obesity in Switzerland”. Obesity Research. 2004;12(6):896–903. doi: 10.1038/oby.2004.109. [DOI] [PubMed] [Google Scholar]
- Wang Y, Lobstein T. “Worldwide Trends in Childhood Overweight and Obesity”. International Journal of Pediatric Obesity. 2006;1(1):11–25. doi: 10.1080/17477160600586747. [DOI] [PubMed] [Google Scholar]
- White House Task Force on Childhood Obesity. “Solving the Challenge of Childhood Obesity within a Generation”. Washington, DC: Executive Office of the President of the United States; 2010. [Google Scholar]
- Wood S. Generalized Additive Models: An Introduction with R. New York: Chapman & Hall/CRC; 2006. [Google Scholar]
- Woodcock RW. Woodcock–Johnson Tests of Achievement–Revised. Allen, TX: DLM Teaching Resources; 1989. [Google Scholar]
- Woodcock RW, Johnson MB. Tests of Achievement, Standard Battery. Chicago, IL: Riverside Publishing; 1989. [Google Scholar]
Associated Data
This section collects any data citations, data availability statements, or supplementary materials included in this article.