

INTRODUCTION
Recent technological and scientific advances have provided the tools needed to rapidly scan the genome for genetic variants affecting osteoporosis. In the last 2 yr, genome‐wide association studies (GWASs) have identified several associations contributing to risk of fracture and related traits. These discoveries promise to illuminate important new pathways in bone metabolism, contribute to the development of novel therapeutics, and possibly harbor prognostic value. The initial GWAS results, however, suggest that alternative strategies may be necessary to comprehensively identify and characterize genetic risk factors. In this perspective, we review the status of GWASs for osteoporosis and discuss systems level approaches that have the potential to provide a much deeper understanding of bone biology.
GENOME‐WIDE ASSOCIATION STUDIES OF OSTEOPOROSIS
Candidate gene association and family‐based linkage studies in humans and controlled experimental crosses in the mouse have been the methods traditionally used to map osteoporosis genes. (1) Unfortunately, these efforts have been met with limited success. In just the last few years, however, this paradigm has dramatically shifted. Large‐scale single nucleotide polymorphism (SNP) discovery efforts, such as the International HapMap Project, (2) in conjunction with the development of massively parallel genotyping platforms, have enabled genetic association studies to be performed on a genome‐wide scale. (3) GWASs are performed by genotyping thousands of well‐phenotyped individuals for hundreds of thousands (between 100 and 1000 K) of SNPs. (4) The end result is the identification of associated regions that, dependent on patterns of linkage disequilibrium between markers, typically span several kilobase pairs and harbor none, one, or a small number of candidate genes.
Since May 2008, 10 GWASs have identified nearly 30 independent loci affecting BMD and/or fracture. 5 , 6 , 7 , 8 , 9 , 10 , 11 , 12 , 13 , 14 Four studies have identified >20 loci affecting various aspects of stature and bone size. 15 , 16 , 17 , 18 Strong associations for BMD have been confirmed in or near many previously suspected candidate genes, such as the estrogen receptor (ESR1), 9 , 11 TNF receptor superfamily, member 11a (TNFRSF11A; RANK), 10 , 11 TNF (ligand) superfamily, member 11 (TNFSF11; RANKL), 9 , 11 SP7 transcription factor (SP7), 10 , 11 , 12 and low‐density lipoprotein receptor‐related protein 5 (LRP5). 8 , 11 However, most of the associations exceeding stringent genome‐wide significance thresholds have been with novel genes, such as family with sequence similarity 3, member C (FAM3C) (5) and MAP/microtubule affinity‐regulating kinase 3 (MARK3), (10) among many others. These novel genes have no known connection to bone and, once validated, their discovery should highlight important new biological mechanisms impacting bone metabolism.
Although GWASs are clearly a major advance for gene discovery, the results to date explain only a small fraction of the genetic component for traits such as BMD. For example, a large‐scale meta‐analysis of 19,195 individuals identified a total of 15 SNPs associated with lumbar spine BMD. However, in aggregate, these SNPs only explained 2.9% of the variance in spine BMD. (11) The undiscovered genetic component likely consists of a combination of many more common variants with increasingly smaller effects and the contributions of rare variants 19 , 20 ; both of which will be much more difficult to identify. It is also likely that inherited epigenetic modifications and gene by gene and gene by environmental interactions are significant sources of variation.
The key limitation of GWASs, however, is one common to all methods that strictly correlate genotype with phenotype‐they are one dimensional. GWAS can identify common variants with relatively strong effects in a straightforward manner; however, it is not capable of providing information on the context in which those genes function, their relationships with other genes, or how these relationships change over time, in different environments or during disease. “Systems genetics,” which integrates the analysis of molecular phenotypes along with clinical traits, provides a powerful strategy for more fully understanding the complex interactions contributing to osteoporotic fracture.
SYSTEMS GENETICS
Traditional genetic analysis attempts to directly relate DNA variation to clinical traits using linkage or association (Fig. 1). This strategy has been effective for “simple” Mendelian diseases; however, it has been much less successful for common forms of osteoporosis. The main difference is that in addition to clinical traits systems genetics examines molecular phenotypes, such as transcript levels assessed by DNA microarrays (Fig. 1). (21) This allows genetic mapping of molecular intermediates and more importantly the identification of correlations between molecular and clinical phenotypes. It should be noted, however, that the simultaneous evaluation of the effects of thousands of genetic variants and thousands of intermediate phenotypes presents many challenges. The most prominent being the problem of multiple comparisons, which requires sophisticated statistical analyses, such as data reduction techniques, (22) to control the false discovery rate.
Figure Figure 1.
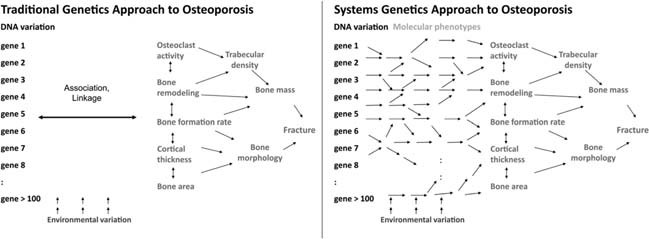
Comparing the use of systems genetics vs. traditional genetics for the dissection of complex osteoporosis‐related traits. Fracture risk is determined by a myriad of factors‐all of which are regulated by a complex network of genetic and environmental factors. In this illustration, we present only a small number of the bone‐specific characteristics that affect risk of fracture such as bone cell activities, microstructure, mass, and morphology. Traditional genetics attempts to link genetic variants to such traits using linkage or association without considering the involvement of networks of molecular phenotypes. In contrast, systems genetics leverages this information to better understand how genes and the environment perturb gene networks, which in turn alter fracture risk.
As yet, the only molecular phenotype that can be examined globally using high‐throughput technology is transcript levels, (23) although proteomic (24) and metabolomic (25) technologies are becoming increasingly broad and quantitative. This represents another important limitation for systems genetics, because some variants will predispose to disease, not through transcript levels, but by altering protein structure or activity. It is also becoming increasingly clear that microRNAs are important in the global modulation of gene expression and should be included in systems genetics analyses. A recent study with diabetic mice identified loci regulating microRNAs and showed that these were associated with altered levels of predicted target transcripts. (26)
ELUCIDATING THE GENETICS OF GENE EXPRESSION
As with any quantitative trait, the genetic determinants of a single gene's expression can be mapped. With DNA microarrays this can be extended to the ∼20,000 genes in the mouse or human genomes. Loci that control a gene's expression are referred to as expression QTLs (eQTLs) or expression SNPs (eSNPs), depending on if they were identified using linkage or GWASs (the distinction between eQTLs and eSNPs is important, but for clarity, we refer to all loci regulating expression as eQTLs). In either case, there are two types: local and distant. (27) Local eQTL are located in close proximity to the gene they regulate. Many local eQTL function in cis, (28) although they can be caused by the effects of neighboring genes acting in trans. In contrast, distant eQTLs act exclusively in trans and are typically located on a different chromosome relative to the gene(s) they regulate.
How can eQTL information be used to gain insight into the genetic regulation of osteoporosis‐related traits? To begin, genes with eQTL are candidates for mediating genetic effects. If a SNP is associated with both BMD and the expression of a nearby gene, the alteration in gene expression may be the basis of the SNP‐BMD association. Thus, for GWASs, the incorporation of expression data can provide a direct link between an association and a single gene and suggest a potential mechanism of action. (29) Currently, studies that incorporate microarray data in the context of an osteoporosis GWAS are lacking; however, expression data has been recently used to investigate the molecular basis of significant BMD associations. In a recent GWAS, a SNP near the 3′ end of the TNF receptor superfamily, member 11b (TNFRSF11B; OPG) was strongly associated with BMD. (8) The authors go on to measure the allele specific expression of TNFRSF11B in lymphoblast cell lines from HapMap individuals. This analysis showed that SNPs in the same region of the gene were associated with the expression of TNFRSF11B, suggesting that the difference in expression may lead to alterations in BMD.
CAUSALITY MODELING
Suppose that a transcript is highly correlated with a clinical trait across a set of individuals and there is evidence that one or more of the same genetic loci control both the transcript and the trait. This raises the possibility that either the transcript levels perturb the trait (a “causal” relationship) or that the transcript is perturbed by the clinical trait (a “reactive” relationship). Alternatively, these associations could be unrelated. As an example of the latter, a locus controlling the expression of a gene that perturbs BMD may be strongly correlated, as a result of linkage disequilibrium, with other genes residing at that locus. These other genes would also be correlated with BMD, yet they would not be functionally related to BMD. In such a case, the relationship would be described as “independent.”
The relationships between correlated elements of a system can be explored using mathematical modeling, and this type of modeling has been applied to many different areas of research, such as ecology and social sciences. (30) Similar analyses, involving partial correlation, or “conditioning,” can be applied to systems genetics data. A key concept in causality modeling, in a systems genetic context, is that DNA variation can serve as a “causal anchor,” because information flows from DNA to molecular and clinical phenotypes but not vice versa. For example, if a single locus regulates both a gene's expression and BMD, and the gene is causal for BMD, conditioning on the levels of the transcript would be expected to eliminate the relationship between the locus and BMD. In essence, conditioning removes the variation in BMD that can be explained by correlation with a gene's expression. If the transcript levels fully explain the effect of the locus on BMD, this would be consistent with a causal relationship where the locus perturbs transcript levels, which in turn, perturb BMD. Recently, algorithms for the statistical analysis of such systems genetics data have been reported. 31 , 32 , 33 Basically, they provide a means of assessing the statistical significance of the possible relationships between a genetic locus and the correlated traits controlled by that locus.
Causality modeling need not be restricted to genes that are regulated directly by local DNA variation. For example, suppose that the expression of gene A influences BMD and that gene A is regulated in trans by gene B, which resides on a different chromosome. In this case, a local polymorphism affecting either the expression or structure of gene B could perturb both the expression of gene A and BMD. If so, gene A would be identified as causal for BMD even in the absence of a local eQTL. Thus, systems genetics, but not GWASs, would be capable of identifying gene A as a causal gene for BMD. As discussed below, causality modeling can also be used to infer causal relationships between the elements of biological networks.
Causality modeling has now been applied to several organisms and phenotypes. Most convincing have been studies in yeast, where validation is relatively straightforward, but several studies in mouse suggest that it should be broadly applicable to mammalian systems as well. (34) For example, in a study of adiposity in mice, a list of likely causal genes was derived from liver expression data in an intercross between two inbred mouse strains. The list consisted of genes that were highly correlated with obesity, regulated by eQTL, both local and distal, mapping to loci perturbing fat mass and were predicted to be causal for adiposity. The top candidate genes were tested for an effect on adiposity by altering their expression using transgenic or gene targeting approaches. Of nine genes tested, eight had some effect on adiposity. (34)
We have recently used systems genetics to identify causal genes for BMD. Using a similar approach described above for obesity, we identified 18 genes predicted to be causally linked to BMD. (35) Three of the 18, twist homolog 2 (Twist2), wingless‐type MMTV integration site 9A (Wnt9a), and matrix metallopeptidase 14 (membrane‐inserted) (Mmp14), are known to influence bone mineralization, suggesting that causality modeling is an effective way to identify BMD genes. Although the causality modeling predictions are statistically strong, these genes must be validated using experimental perturbation to confirm their role in the regulation of BMD. (36)
GENE NETWORKS
It is clear that the elements in biologic systems, whether genes, transcripts, proteins, or metabolites, exhibit complex, nonlinear interactions, with some elements interacting with many other elements and most others interacting with few. Thus, biologic processes are better described as “networks” than as linear pathways. This was first observed in the modeling of metabolic interactions and was subsequently observed in studies of protein interactions and transcript regulation. 37 , 38 , 39
Biologic networks can be represented as graphs consisting of a collection of nodes and edges. In the case of gene networks, the nodes are genes, and the edges represent a relationship between two genes. A particularly useful network in systems genetics is one in which the edges are defined as the correlation of two gene expression traits across a sample population. Such “coexpression” networks are based on the concept that genes that exhibit similar regulation over a large number of perturbations are likely to be functionally related. (40)
Single gene perturbations, such as in a transgenic mouse, can alter the expression of many genes. However, the relationships between the genes cannot be determined because there are essentially only two states: transgenic or nontransgenic. Multiple gene perturbations, such as those resulting from naturally occurring genetic variation among a large number of individuals, are capable of a range of states for each gene and for relationships between genes, allowing for the generation of gene networks.
A disadvantage of coexpression networks is that causality must be established by other methods. Whereas causality is clear in a single gene perturbation experiment (i.e., the transgene perturbs many other genes), the nodes in a coexpression network are simply correlated and, as highlighted above, correlation alone does not imply causation. Such a network in which the causal relationships between nodes are unknown is termed an “undirected” network compared with a “directed” network. It is possible to produce “directed” networks from systems genetics data using the causality modeling approaches discussed above. 41 , 42 More sophisticated Bayesian analyses, in which additional elements or information are incorporated into the network modeling, have also been performed. (43) It should be noted, however, that such analyses are only hypothesis generating and that firm conclusions require experimental validation.
Global studies of biologic networks have shown certain conserved topologic features. One, mentioned above, is the tendency of most elements to have relatively few edges, whereas some have many (the latter termed “hubs”). Another is the tendency of elements to cluster into highly connected groups, termed “modules,” which presumably share functional aspects. For example, in protein interaction networks, proteins located in particular cellular compartments, such as nuclei or mitochondria, tend to exhibit clustering. (44) Similarly, coexpression networks generated from systems genetics exhibit clear clustering. One indication that modules are functionally significant is that they are frequently highly enriched for genes with known biologic functions. Another feature of interest is that particular modules have been found to correlate significantly with clinical traits, suggesting that there is a relationship, either causal or reactive, between the module as a whole and clinical phenotypes. (45) Recent studies have expanded on this concept, showing through experimental perturbation the coherence of modules and their relevance to clinical traits. 46 , 47 , 48 The feasibility of constructing similar networks for bone traits is discussed below.
FUTURE DIRECTIONS
To date, systems genetics studies for bone traits have been limited. One of the major obstacles for systems genetics studies of osteoporosis is accessibility to relevant tissues for expression profiling. Circulating monocytes are one possible source. They are easy to isolate and purify and they can serve as osteoclast progenitors. 49 , 50 , 51 Bone tissues samples harvested during orthopedic procedures, or primary osteoblasts derived from such samples, have been used on a small scale for bone‐related microarray gene expression studies, 52 , 53 and it may be possible to extend this approach to larger studies. One issue that will need to be addressed when using cells is how their expression profiles differ when cultured. It will also be important to choose the most relevant clinical phenotypes that can be collected in a large population. (54)
In addition, we believe the mouse will play a much larger role because of the inherent advantages of inbred strains for systems genetics, (55) especially given the challenges of generating genome‐scale data in human bone. The use of the mouse is also being enhanced through the emergence of “next‐generation” mapping populations, such as heterogeneous stocks (56) and outbred mice. 35 , 57
Technological and statistical improvements have and will continue to be the driving force for systems genetics. Next‐generation sequencing technologies are poised to revolutionize our ability to quantitatively and qualitatively characterize the transcriptome. (58) In addition, we expect that emerging technologies will soon enable the routine evaluation of biological components other than the transcriptome. It is also expected that, as the field continues to mature, novel statistical algorithms will provide new ways to approach and analyze systems genetic data.
In conclusion, we see systems genetics as a way to enhance the next generation of bone‐related GWASs and provide a way to transition from gene‐based to network‐centric views of disease. The use of systems genetics may yet unlock the potential of genomics for prevention of osteoporotic fractures.
The authors state that they have no conflicts of interest.
Published online on November 2, 2009;
REFERENCES
- 1. Ralston SH, de Crombrugghe B 2006. Genetic regulation of bone mass and susceptibility to osteoporosis. Genes Dev 20:2492–2506. [DOI] [PubMed] [Google Scholar]
- 2. International HapMap , Frazer KA, Ballinger DG, Cox DR, Hinds DA, Stuve LL, Gibbs RA, Belmont JW, Boudreau A, Hardenbol P, Leal SM, Pasternak S, Wheeler DA, Willis TD, Yu F, Yang H, Zeng C, Gao Y, Hu H, Hu W, Li C, Lin W, Liu S, Pan H, Tang X, Wang J, Wang W, Yu J, Zhang B, Zhang Q, Zhao H, Zhao H, Zhou J, Gabriel SB, Barry R, Blumenstiel B, Camargo A, Defelice M, Faggart M, Goyette M, Gupta S, Moore J, Nguyen H, Onofrio RC, Parkin M, Roy J, Stahl E, Winchester E, Ziaugra L, Altshuler D, Shen Y, Yao Z, Huang W, Chu X, He Y, Jin L, Liu Y, Shen Y, Sun W, Wang H, Wang Y, Wang Y, Xiong X, Xu L, Waye MM, Tsui SK, Xue H, Wong JT, Galver LM, Fan JB, Gunderson K, Murray SS, Oliphant AR, Chee MS, Montpetit A, Chagnon F, Ferretti V, Leboeuf M, Olivier JF, Phillips MS, Roumy S, Sallee C, Verner A, Hudson TJ, Kwok PY, Cai D, Koboldt DC, Miller RD, Pawlikowska L, Taillon‐Miller P, Xiao M, Tsui LC, Mak W, Song YQ, Tam PK, Nakamura Y, Kawaguchi T, Kitamoto T, Morizono T, Nagashima A 2007. A second generation human haplotype map of over 3.1 million SNPs. Nature 449:851–861. [DOI] [PMC free article] [PubMed] [Google Scholar]
- 3. Maresso K, Broeckel U 2008. Genotyping platforms for mass‐throughput genotyping with SNPs, including human genome‐wide scans. Adv Genet 60:107–139. [DOI] [PubMed] [Google Scholar]
- 4. McCarthy MI, Abecasis GR, Cardon LR, Goldstein DB, Little J, Ioannidis JP, Hirschhorn JN 2008. Genome‐wide association studies for complex traits: Consensus, uncertainty and challenges. Nat Rev Genet 9:356–369. [DOI] [PubMed] [Google Scholar]
- 5. Cho YS, Go MJ, Kim YJ, Heo JY, Oh JH, Ban HJ, Yoon D, Lee MH, Kim DJ, Park M, Cha SH, Kim JW, Han BG, Min H, Ahn Y, Park MS, Han HR, Jang HY, Cho EY, Lee JE, Cho NH, Shin C, Park T, Park JW, Lee JK, Cardon L, Clarke G, McCarthy MI, Lee JY, Lee JK, Oh B, Kim HL 2009. A large‐scale genome‐wide association study of Asian populations uncovers genetic factors influencing eight quantitative traits. Nat Genet 41:527–534. [DOI] [PubMed] [Google Scholar]
- 6. Deng FY, Zhao LJ, Pei YF, Sha BY, Liu XG, Yan H, Wang L, Yang TL, Recker RR, Papasian CJ, Deng HW 2009. Genome‐wide copy number variation association study suggested VPS13B gene for osteoporosis in Caucasians. Osteoporos Int (in press). [DOI] [PubMed]
- 7. Liu YZ, Pei YF, Liu JF, Yang F, Guo Y, Zhang L, Liu XG, Yan H, Wang L, Zhang YP, Levy S, Recker RR, Deng HW 2009. Powerful bivariate genome‐wide association analyses suggest the SOX6 gene influencing both obesity and osteoporosis phenotypes in males. PLoS One 4:e6827. [DOI] [PMC free article] [PubMed] [Google Scholar]
- 8. Richards JB, Rivadeneira F, Inouye M, Pastinen TM, Soranzo N, Wilson SG, Andrew T, Falchi M, Gwilliam R, Ahmadi KR, Valdes AM, Arp P, Whittaker P, Verlaan DJ, Jhamai M, Kumanduri V, Moorhouse M, van Meurs JB, Hofman A, Pols HA, Hart D, Zhai G, Kato BS, Mullin BH, Zhang F, Deloukas P, Uitterlinden AG, Spector TD 2008. Bone mineral density, osteoporosis, and osteoporotic fractures: A genome‐wide association study. Lancet 371:1505–1512. [DOI] [PMC free article] [PubMed] [Google Scholar]
- 9. Styrkarsdottir U, Halldorsson BV, Gretarsdottir S, Gudbjartsson DF, Walters GB, Ingvarsson T, Jonsdottir T, Saemundsdottir J, Center JR, Nguyen TV, Bagger Y, Gulcher JR, Eisman JA, Christiansen C, Sigurdsson G, Kong A, Thorsteinsdottir U, Stefansson K 2008. Multiple genetic loci for bone mineral density and fractures. N Engl J Med 358:2355–2365. [DOI] [PubMed] [Google Scholar]
- 10. Styrkarsdottir U, Halldorsson BV, Gretarsdottir S, Gudbjartsson DF, Walters GB, Ingvarsson T, Jonsdottir T, Saemundsdottir J, Snorradottir S, Center JR, Nguyen TV, Alexandersen P, Gulcher JR, Eisman JA, Christiansen C, Sigurdsson G, Kong A, Thorsteinsdottir U, Stefansson K 2009. New sequence variants associated with bone mineral density. Nat Genet 41:15–17. [DOI] [PubMed] [Google Scholar]
- 11. The Genetic Factors for Osteoporosis , Rivadeneira F, Styrkarsdottir U, Estrada K, Halldorsson BV, Hsu YH, Richards JB, Zillikens MC, Kavvoura FK, Amin N, Aulchenko YS, Cupples LA, Deloukas P, Demissie S, Grundberg E, Hofman A, Kong A, Karasik D, van Meurs JB, Oostra B, Pastinen T, Pols HA, Sigurdsson G, Soranzo N, Thorleifsson G, Thorsteinsdottir U, Williams FM, Wilson SG, Zhou Y, Ralston SH, van Duijn CM, Spector T, Kiel DP, Stefansson K, Ioannidis JP, Uitterlinden AG 2009. Twenty bone‐mineral‐density loci identified by large‐scale meta‐analysis of genome‐wide association studies. Nat Genet 41:1199–1206. [DOI] [PMC free article] [PubMed] [Google Scholar]
- 12. Timpson NJ, Tobias JH, Richards JB, Soranzo N, Duncan EL, Sims AM, Whittaker P, Kumanduri V, Zhai G, Glaser B, Eisman J, Jones G, Nicholson G, Prince R, Seeman E, Spector T, Brown MA, Peltonen L, Smith GD, Deloukas P, Evans DM 2009. Common variants in the region around Osterix are associated with bone mineral density and growth in childhood. Hum Mol Genet 18:1510–1517. [DOI] [PMC free article] [PubMed] [Google Scholar]
- 13. Xiong DH, Liu XG, Guo YF, Tan LJ, Wang L, Sha BY, Tang ZH, Pan F, Yang TL, Chen XD, Lei SF, Yerges LM, Zhu XZ, Wheeler VW, Patrick AL, Bunker CH, Guo Y, Yan H, Pei YF, Zhang YP, Levy S, Papasian CJ, Xiao P, Lundberg YW, Recker RR, Liu YZ, Liu YJ, Zmuda JM, Deng HW 2009. Genome‐wide association and follow‐up replication studies identified ADAMTS18 and TGFBR3 as bone mass candidate genes in different ethnic groups. Am J Hum Genet 84:388–398. [DOI] [PMC free article] [PubMed] [Google Scholar]
- 14. Yang TL, Chen XD, Guo Y, Lei SF, Wang JT, Zhou Q, Pan F, Chen Y, Zhang ZX, Dong SS, Xu XH, Yan H, Liu X, Qiu C, Zhu XZ, Chen T, Li M, Zhang H, Zhang L, Drees BM, Hamilton JJ, Papasian CJ, Recker RR, Song XP, Cheng J, Deng HW 2008. Genome‐wide copy‐number‐variation study identified a susceptibility gene, UGT2B17, for osteoporosis. Am J Hum Genet 83:663–674. [DOI] [PMC free article] [PubMed] [Google Scholar]
- 15. Lei SF, Tan LJ, Liu XG, Wang L, Yan H, Guo YF, Liu YZ, Xiong DH, Li J, Yang TL, Chen XD, Guo Y, Deng FY, Zhang YP, Zhu XZ, Levy S, Papasian CJ, Hamilton JJ, Recker RR, Deng HW 2009. Genome‐wide association study identifies two novel loci containing FLNB and SBF2 genes underlying stature variation. Hum Mol Genet 18:1661–1669. [DOI] [PMC free article] [PubMed] [Google Scholar]
- 16. Liu YZ, Wilson SG, Wang L, Liu XG, Guo YF, Li J, Yan H, Deloukas P, Soranzo N, Chinappen‐Horsley U, Cervino A, Williams FM, Xiong DH, Zhang YP, Jin TB, Levy S, Papasian CJ, Drees BM, Hamilton JJ, Recker RR, Spector TD, Deng HW 2008. Identification of PLCL1 gene for hip bone size variation in females in a genome‐wide association study. PLoS One 3:e3160. [DOI] [PMC free article] [PubMed] [Google Scholar]
- 17. Sanna S, Jackson AU, Nagaraja R, Willer CJ, Chen WM, Bonnycastle LL, Shen H, Timpson N, Lettre G, Usala G, Chines PS, Stringham HM, Scott LJ, Dei M, Lai S, Albai G, Crisponi L, Naitza S, Doheny KF, Pugh EW, Ben‐Shlomo Y, Ebrahim S, Lawlor DA, Bergman RN, Watanabe RM, Uda M, Tuomilehto J, Coresh J, Hirschhorn JN, Shuldiner AR, Schlessinger D, Collins FS, Davey Smith G, Boerwinkle E, Cao A, Boehnke M, Abecasis GR, Mohlke KL 2008. Common variants in the GDF5‐UQCC region are associated with variation in human height. Nat Genet 40:198–203. [DOI] [PMC free article] [PubMed] [Google Scholar]
- 18. Soranzo N, Rivadeneira F, Chinappen‐Horsley U, Malkina I, Richards JB, Hammond N, Stolk L, Nica A, Inouye M, Hofman A, Stephens J, Wheeler E, Arp P, Gwilliam R, Jhamai PM, Potter S, Chaney A, Ghori MJ, Ravindrarajah R, Ermakov S, Estrada K, Pols HA, Williams FM, McArdle WL, van Meurs JB, Loos RJ, Dermitzakis ET, Ahmadi KR, Hart DJ, Ouwehand WH, Wareham NJ, Barroso I, Sandhu MS, Strachan DP, Livshits G, Spector TD, Uitterlinden AG, Deloukas P 2009. Meta‐analysis of genome‐wide scans for human adult stature identifies novel Loci and associations with measures of skeletal frame size. PLoS Genet 5:e1000445. [DOI] [PMC free article] [PubMed] [Google Scholar]
- 19. Goldstein DB 2009. Common genetic variation and human traits. N Engl J Med 360:1696–1698. [DOI] [PubMed] [Google Scholar]
- 20. Maher B 2008. Personal genomes: The case of the missing heritability. Nature 456:18–21. [DOI] [PubMed] [Google Scholar]
- 21. Sieberts SK, Schadt EE 2007. Moving toward a system genetics view of disease. Mamm Genome 18:389–401. [DOI] [PMC free article] [PubMed] [Google Scholar]
- 22. Alter O, Brown PO, Botstein D 2000. Singular value decomposition for genome‐wide expression data processing and modeling. Proc Natl Acad Sci USA 97:10101–10106. [DOI] [PMC free article] [PubMed] [Google Scholar]
- 23. Farber CR, Lusis AJ 2008. Integrating global gene expression analysis and genetics. Adv Genet 60:571–601. [DOI] [PMC free article] [PubMed] [Google Scholar]
- 24. Melzer D, Perry JR, Hernandez D, Corsi AM, Stevens K, Rafferty I, Lauretani F, Murray A, Gibbs JR, Paolisso G, Rafiq S, Simon‐Sanchez J, Lango H, Scholz S, Weedon MN, Arepalli S, Rice N, Washecka N, Hurst A, Britton A, Henley W, van de Leemput J, Li R, Newman AB, Tranah G, Harris T, Panicker V, Dayan C, Bennett A, McCarthy MI, Ruokonen A, Jarvelin MR, Guralnik J, Bandinelli S, Frayling TM, Singleton A, Ferrucci L 2008. A genome‐wide association study identifies protein quantitative trait loci (pQTLs). PLoS Genet 4:e1000072. [DOI] [PMC free article] [PubMed] [Google Scholar]
- 25. Dumas ME, Wilder SP, Bihoreau MT, Barton RH, Fearnside JF, Argoud K, D'Amato L, Wallis RH, Blancher C, Keun HC, Baunsgaard D, Scott J, Sidelmann UG, Nicholson JK, Gauguier D 2007. Direct quantitative trait locus mapping of mammalian metabolic phenotypes in diabetic and normoglycemic rat models. Nat Genet 39:666–672. [DOI] [PubMed] [Google Scholar]
- 26. Zhao E, Keller MP, Rabaglia ME, Oler AT, Stapleton DS, Schueler KL, Neto EC, Moon JY, Wang P, Wang IM, Lum PY, Ivanovska I, Cleary M, Greenawalt D, Tsang J, Choi YJ, Kleinhanz R, Shang J, Zhou YP, Howard AD, Zhang BB, Kendziorski C, Thornberry NA, Yandell BS, Schadt EE, Attie AD 2009. Obesity and genetics regulate microRNAs in islets, liver, and adipose of diabetic mice. Mamm Genome 20:476–485. [DOI] [PMC free article] [PubMed] [Google Scholar]
- 27. Rockman MV, Kruglyak L 2006. Genetics of global gene expression. Nat Rev Genet 7:862–872. [DOI] [PubMed] [Google Scholar]
- 28. Doss S, Schadt EE, Drake TA, Lusis AJ 2005. Cis‐acting expression quantitative trait loci in mice. Genome Res 15:681–691. [DOI] [PMC free article] [PubMed] [Google Scholar]
- 29. Moffatt MF, Kabesch M, Liang L, Dixon AL, Strachan D, Heath S, Depner M, von Berg A, Bufe A, Rietschel E, Heinzmann A, Simma B, Frischer T, Willis‐Owen SA, Wong KC, Illig T, Vogelberg C, Weiland SK, von Mutius E, Abecasis GR, Farrall M, Gut IG, Lathrop GM, Cookson WO 2007. Genetic variants regulating ORMDL3 expression contribute to the risk of childhood asthma. Nature 448:470–473. [DOI] [PubMed] [Google Scholar]
- 30. Shipley B 2002. Cause and Correlation in Biology: A User's Guide to Path Analysis, Structural Equations and Causal Inference. Cambridge University Press, Cambridge, MA, USA. [Google Scholar]
- 31. Schadt EE, Lamb J, Yang X, Zhu J, Edwards S, Guhathakurta D, Sieberts SK, Monks S, Reitman M, Zhang C, Lum PY, Leonardson A, Thieringer R, Metzger JM, Yang L, Castle J, Zhu H, Kash SF, Drake TA, Sachs A, Lusis AJ 2005. An integrative genomics approach to infer causal associations between gene expression and disease. Nat Genet 37:710–717. [DOI] [PMC free article] [PubMed] [Google Scholar]
- 32. Aten JE, Fuller TF, Lusis AJ, Horvath S 2008. Using genetic markers to orient the edges in quantitative trait networks: The NEO software. BMC Syst Biol 2:34. [DOI] [PMC free article] [PubMed] [Google Scholar]
- 33. Chaibub Neto E, Ferrara CT, Attie AD, Yandell BS 2008. Inferring causal phenotype networks from segregating populations. Genetics 179:1089–1100. [DOI] [PMC free article] [PubMed] [Google Scholar]
- 34. Yang X, Deignan JL, Qi H, Zhu J, Qian S, Zhong J, Torosyan G, Majid S, Falkard B, Kleinhanz RR, Karlsson J, Castellani LW, Mumick S, Wang K, Xie T, Coon M, Zhang C, Estrada‐Smith D, Farber CR, Wang SS, van Nas A, Ghazalpour A, Zhang B, Macneil DJ, Lamb JR, Dipple KM, Reitman ML, Mehrabian M, Lum PY, Schadt EE, Lusis AJ, Drake TA 2009. Validation of candidate causal genes for obesity that affect shared metabolic pathways and networks. Nat Genet 41:415–423. [DOI] [PMC free article] [PubMed] [Google Scholar]
- 35. Farber CR, van Nas A, Ghazalpour A, Aten JE, Doss S, Sos B, Schadt EE, Ingram‐Drake L, Davis RC, Horvath S, Smith DJ, Drake TA, Lusis AJ 2009. An integrative genetics approach to identify candidate genes regulating BMD: Combining linkage, gene expression, and association. J Bone Miner Res 24:105–116. [DOI] [PMC free article] [PubMed] [Google Scholar]
- 36. Klein RF, Allard J, Avnur Z, Nikolcheva T, Rotstein D, Carlos AS, Shea M, Waters RV, Belknap JK, Peltz G, Orwoll ES 2004. Regulation of bone mass in mice by the lipoxygenase gene Alox15. Science 303:229–232. [DOI] [PubMed] [Google Scholar]
- 37. Carter SL, Brechbuhler CM, Griffin M, Bond AT 2004. Gene co‐expression network topology provides a framework for molecular characterization of cellular state. Bioinformatics 20:2242–2250. [DOI] [PubMed] [Google Scholar]
- 38. Jeong H, Tombor B, Albert R, Oltvai ZN, Barabasi AL 2000. The large‐scale organization of metabolic networks. Nature 407:651–654. [DOI] [PubMed] [Google Scholar]
- 39. Stelzl U, Worm U, Lalowski M, Haenig C, Brembeck FH, Goehler H, Stroedicke M, Zenkner M, Schoenherr A, Koeppen S, Timm J, Mintzlaff S, Abraham C, Bock N, Kietzmann S, Goedde A, Toksoz E, Droege A, Krobitsch S, Korn B, Birchmeier W, Lehrach H, Wanker EE 2005. A human protein‐protein interaction network: A resource for annotating the proteome. Cell 122:957–968. [DOI] [PubMed] [Google Scholar]
- 40. Zhang B, Horvath S 2005. A general framework for weighted gene co‐expression network analysis. Stat Appl Genet Mol Biol 4:17. [DOI] [PubMed] [Google Scholar]
- 41. Zhu J, Lum PY, Lamb J, GuhaThakurta D, Edwards SW, Thieringer R, Berger JP, Wu MS, Thompson J, Sachs AB, Schadt EE 2004. An integrative genomics approach to the reconstruction of gene networks in segregating populations. Cytogenet Genome Res 105:363–374. [DOI] [PubMed] [Google Scholar]
- 42. Zhu J, Wiener MC, Zhang C, Fridman A, Minch E, Lum PY, Sachs JR, Schadt EE 2007. Increasing the power to detect causal associations by combining genotypic and expression data in segregating populations. PLOS Comput Biol 3:e69. [DOI] [PMC free article] [PubMed] [Google Scholar]
- 43. Zhu J, Zhang B, Smith EN, Drees B, Brem RB, Kruglyak L, Bumgarner RE, Schadt EE 2008. Integrating large‐scale functional genomic data to dissect the complexity of yeast regulatory networks. Nat Genet 40:854–861. [DOI] [PMC free article] [PubMed] [Google Scholar]
- 44. Han JD, Bertin N, Hao T, Goldberg DS, Berriz GF, Zhang LV, Dupuy D, Walhout AJ, Cusick ME, Roth FP, Vidal M 2004. Evidence for dynamically organized modularity in the yeast protein‐protein interaction network. Nature 430:88–93. [DOI] [PubMed] [Google Scholar]
- 45. Ghazalpour A, Doss S, Zhang B, Wang S, Plaisier C, Castellanos R, Brozell A, Schadt EE, Drake TA, Lusis AJ, Horvath S 2006. Integrating genetic and network analysis to characterize genes related to mouse weight. PLoS Genet 2:e130. [DOI] [PMC free article] [PubMed] [Google Scholar]
- 46. Chen Y, Zhu J, Lum PY, Yang X, Pinto S, MacNeil DJ, Zhang C, Lamb J, Edwards S, Sieberts SK, Leonardson A, Castellini LW, Wang S, Champy MF, Zhang B, Emilsson V, Doss S, Ghazalpour A, Horvath S, Drake TA, Lusis AJ, Schadt EE 2008. Variations in DNA elucidate molecular networks that cause disease. Nature 452:429–435. [DOI] [PMC free article] [PubMed] [Google Scholar]
- 47. Horvath S, Zhang B, Carlson M, Lu KV, Zhu S, Felciano RM, Laurance MF, Zhao W, Qi S, Chen Z, Lee Y, Scheck AC, Liau LM, Wu H, Geschwind DH, Febbo PG, Kornblum HI, Cloughesy TF, Nelson SF, Mischel PS 2006. Analysis of oncogenic signaling networks in glioblastoma identifies ASPM as a molecular target. Proc Natl Acad Sci USA 103:17402–17407. [DOI] [PMC free article] [PubMed] [Google Scholar]
- 48. Miller JA, Oldham MC, Geschwind DH 2008. A systems level analysis of transcriptional changes in Alzheimer's disease and normal aging. J Neurosci 28:1410–1420. [DOI] [PMC free article] [PubMed] [Google Scholar]
- 49. Fujikawa Y, Quinn JM, Sabokbar A, McGee JO, Athanasou NA 1996. The human osteoclast precursor circulates in the monocyte fraction. Endocrinology 137:4058–4060. [DOI] [PubMed] [Google Scholar]
- 50. Lei SF, Wu S, Li LM, Deng FY, Xiao SM, Jiang C, Chen Y, Jiang H, Yang F, Tan LJ, Sun X, Zhu XZ, Liu MY, Liu YZ, Chen XD, Deng HW 2009. An in vivo genome wide gene expression study of circulating monocytes suggested GBP1, STAT1 and CXCL10 as novel risk genes for the differentiation of peak bone mass. Bone 44:1010–1014. [DOI] [PubMed] [Google Scholar]
- 51. Parfitt AM 1994. Osteonal and hemi‐osteonal remodeling: The spatial and temporal framework for signal traffic in adult human bone. J Cell Biochem 55:273–286. [DOI] [PubMed] [Google Scholar]
- 52. Hopwood B, Tsykin A, Findlay DM, Fazzalari NL 2009. Gene expression profile of the bone microenvironment in human fragility fracture bone. Bone 44:87–101. [DOI] [PubMed] [Google Scholar]
- 53. Wilson SG, Jones MR, Mullin BH, Dick IM, Richards JB, Pastinen TM, Grundberg E, Ljunggren O, Surdulescu GL, Dudbridge F, Elliott KS, Cervino AC, Spector TD, Prince RL 2009. Common sequence variation in FLNB regulates bone structure in women in the general population and FLNB mRNA expression in osteoblasts in vitro. J Bone Miner Res (in press). [DOI] [PubMed]
- 54. Chen Y, Shen H, Yang F, Liu PY, Tang N, Recker RR, Deng HW 2009. Choice of study phenotype in osteoporosis genetic research. J Bone Miner Metab 27:121–126. [DOI] [PubMed] [Google Scholar]
- 55. Churchill GA 2007. Recombinant inbred strain panels: A tool for systems genetics. Physiol Genomics 31:174–175. [DOI] [PubMed] [Google Scholar]
- 56. Valdar W, Solberg LC, Gauguier D, Burnett S, Klenerman P, Cookson WO, Taylor MS, Rawlins JN, Mott R, Flint J 2006. Genome‐wide genetic association of complex traits in heterogeneous stock mice. Nat Genet 38:879–887. [DOI] [PubMed] [Google Scholar]
- 57. Ghazalpour A, Doss S, Kang H, Farber C, Wen PZ, Brozell A, Castellanos R, Eskin E, Smith DJ, Drake TA, Lusis AJ 2008. High‐resolution mapping of gene expression using association in an outbred mouse stock. PLoS Genet 4:e1000149. [DOI] [PMC free article] [PubMed] [Google Scholar]
- 58. Wang Z, Gerstein M, Snyder M 2009. RNA‐Seq: A revolutionary tool for transcriptomics. Nat Rev Genet 10:57–63. [DOI] [PMC free article] [PubMed] [Google Scholar]