Abstract
This study experimentally investigated the instability of flow impingement in a cerebral aneurysm, which was speculated to promote the degradation of aneurysmal wall. A patient-specific, full-scale and elastic-wall replica of cerebral artery was fabricated from transparent silicone rubber. The geometry of the aneurysm corresponded to that found at 9 days before rupture. The flow in a replica was analysed by quantitative flow visualization (stereoscopic particle image velocimetry) in a three-dimensional, high-resolution and time-resolved manner. The mid-systolic and late-diastolic flows with a Reynolds number of 450 and 230 were compared. The temporal and spatial variations of near-wall velocity at flow impingement delineated its inherent instability at a low Reynolds number. Wall shear stress (WSS) at that site exhibited a combination of temporal fluctuation and spatial divergence. The frequency range of fluctuation was found to exceed significantly that of the heart rate. The high-frequency-fluctuating WSS appeared only during mid-systole and disappeared during late diastole. These results suggested that the flow impingement induced a transition from a laminar regime. This study demonstrated that the hydrodynamic instability of shear layer could not be neglected even at a low Reynolds number. No assumption was found to justify treating the aneurysmal haemodynamics as a fully viscous laminar flow.
Keywords: haemodynamics, aneurysm, impingement, transition, particle image velocimetry, wall shear stress
1. Introduction
Intracranial aneurysm is a pathological lesion of cerebral artery that bulges outwards like a balloon owing to wall weakening. The most serious consequence of aneurysm is its rupture and intracranial haemorrhage, leading to a high mortality rate of 45 per cent [1]. The number of patients harbouring unruptured aneurysms is estimated to reach 3.6–6.0% of the population [2]. According to an international study of unruptured aneurysms, excluding giant aneurysms, less than 1% of aneurysms rupture per year [3]. Nonetheless, most ruptured aneurysms are found to be less than 10 mm diameter [4]. The increasing availability and improved sensitivity of non-invasive imaging techniques enable detection of small, unruptured aneurysms. Aneurysmal treatments, such as neurosurgical clipping or endovascular embolization, have an inevitable risk [3]. Therefore, the therapeutic strategy of unruptured aneurysms is determined by balancing the risks of follow-up and surgical intervention.
Aneurysmal haemodynamics is widely expected to give the potential to predict which aneurysms are doomed to rupture. Using surgically produced aneurysmal models, Ujiie et al. [5] show that inflow impingements with an aspect ratio over 1.6 lead to a secondary circulation. The aspect ratio is statistically proved as a predictor of the rupture risk of human aneurysms [6]. In the last decade, a number of researchers retrospectively studied ruptured and unruptured aneurysms on a patient-specific basis for differentiating the haemodynamics to promote aneurysmal growth and rupture [7–14]. Yet, the mechanism remains controversial, and two schools of thought still prevail, namely high-flow and low-flow effects, which assume different theories for describing the relationship between the haemodynamics and wall degradation [15]. The high-flow theory emphasizes elevated wall shear stress (WSS) leading to endothelial injuries, whereas the low-flow theory supports blood stagnation causing the dysfunction of flow-induced nitric oxide in endothelial cells.
Cebral et al. [16] showed that ruptured aneurysms are more likely to exhibit focal impinging jets using computational fluid dynamics (CFD) with 25 ruptured and 34 unruptured cases. Meng et al. [17] surgically created a new branch in the carotid artery of an adult dog and found that destructive remodelling, which resembles aneurysm initiation such as the disruption of internal elastic lamina and the loss of medial smooth muscle cells, appears in the adjacent region of flow impingement at the apex, which corresponds to the site exposed to a greater WSS magnitude and gradient.
The genesis of aneurysm is widely believed to be associated with abnormal haemodynamics. The degeneration of arterial wall leads to loss of mechanical strength and dilation because of exposure to blood pressure. The remodelling of aneurysmal wall into a balloon-like shape proceeds over a long period of time, whereas the intra-aneurysmal flow is reorganized to exhibit site-dependent haemodynamics. The neck, side wall and dome of the aneurysm are often exposed to different types of haemodynamics. If the local haemodynamics turns out to be favourable, then the wall lesion may be regenerated, thickened and stabilized. If the haemodynamics become malignant over time, then the wall lesion will not regenerate much and will increasingly degenerate because of the dominancy of destructive wall remodelling over healing.
Over the past decades, the advent of CFD in neurosurgery undoubtedly contributes to the progress of aneurysmal haemodynamics on a patient-specific basis. As an a priori assumption, however, the majority of studies regard the flow as a fully viscous, i.e. laminar, stream enclosed by a solid boundary. The laminar flow herein indicates that the flow is periodic, but stable, meaning that the frequency of velocity oscillation is within the range of frequency of the periodic motion. Aneurysmal jets and their impingements regions often observed in ruptured cases motivated us to investigate that the flows induced a transition from a laminar regime. The critical Reynolds number of a free laminar jet (Rec,jet) is of the order of 500 [18,19], which is markedly lower than a commonly cited value, Rec,pipe = 2300, in a stationary pipe flow. The critical Reynolds number of a free laminar jet is comparable to the bulk Reynolds number of major cerebral arteries, suggesting that aneurysmal jets and their impingements may exhibit transitional behaviours. Once transition is induced, an instantaneous velocity profile appears to be fluctuating with a frequency range exceeding that of the heart rate. Aneurysmal jets and their impingements were hypothesized to yield a high-frequency fluctuating WSS by inducing a transition from a laminar regime.
For verification, a three-dimensional, high-resolution and time-resolved experimental measurement technique is required, which has to be capable of resolving boundary layers for associating aneurysmal jets and their impingements with WSS. Owing to the lack of proper techniques, recent studies are heavily dependent on the results of CFD alone. Only a few studies compare the CFD results with experimental data [20,21]. Experimental techniques, however, are limited to the two-dimensional, which cannot measure the WSS of aneurysm. The validation of WSS despite its paramount interest has been poorly performed due to lack of proper measurement.
This study developed an advanced three-dimensional laser flow diagnostic technique, fluorescent scanning stereoscopic particle image velocimetry (FS-SPIV) [22,23], to investigate the near-wall dynamics of aneurysmal jets and their impingements with a spatial resolution of an order of 100 µm and a temporal resolution of 500 Hz. This is an experimental benchmark study using an elastic replica of cerebral artery. Owing to the lack of the similarity law in fluid–structure interactive flows, flow measurements in a replica have to be performed with full-scale geometry. This requirement placed a significant burden on the spatial resolution of measurement for resolving near-wall flows in boundary layers. This study for the first time experimentally demonstrated transition from a laminar regime in cerebral aneurysm haemodynamics using a patient-specific, full-scale and elastic-wall replica of cerebral artery.
2. Experimental methods
2.1. Aneurysmal replica
A patient-specific, full-scale and elastic-wall replica of a ruptured aneurysm (63-year-old female) was produced using rapid prototyping techniques (stereolithography, wax moulding and silicone rubber coating) based on arterial geometry acquired at 9 days before rupture (figure 1). The patient did not have multiple aneurysms and there was no record of subarachnoid haemorrhage. The arterial geometry was reconstructed from computed tomography (CT) images. One hundred and seventy-five CT images (in-plane resolution: 0.29 mm per pixel) with a slice increment of 0.60 mm reconstructed the inner geometry of artery (Mimics; Materialize, Leuven, Belgium). The size of the neck was 4.3 mm and the aspect ratio was 1.1. The mechanical property of the replica was adjusted by the wall thickness and elastic modulus of transparent silicone rubber (KE-1603; Shin-Etsu Chemical, Tokyo, Japan). The wall thickness (t) measured by a micro-CT (TDM1300-IS; Yamato Scientific, Tokyo, Japan) was 1.0 ± 0.3 mm (mean ± s.d.). Micro-CT scanning confirmed a smooth surface of the inner lumen of the model over the entire volume. The elastic modulus of silicone rubber was 0.96 ± 0.115 MPa at room temperature, following the Japan Industrial Standards (JIS K6251) using a tensile testing machine (AG-X; Shimadzu, Kyoto, Japan). The wall compliance of the replica was evaluated by incremental distensibility, I = ΔV/VΔP (V, volume; P, pressure; I = 1.36 × 10⁻³ mm Hg−1 at 100 mmHg pressure), comparable to that of the internal carotid (IC) artery of healthy adults at the age of 50 [24]. The replica included IC, middle cerebral (MC), anterior cerebral (AC) and posterior communicating (PC) arteries. The aneurysm was located at the IC–PC branch. The trifurcated replica was supported by a special rig shaped by rapid prototyping to follow the patient-specific geometry of cerebral artery (figure 1). The replica gave a patient-specific geometry of IC to cover the upstream of the carotid siphon and those of MC, AC and PC to their first principal curvature, and further downstream was given by simply extending the cross section of each artery.
Figure 1.
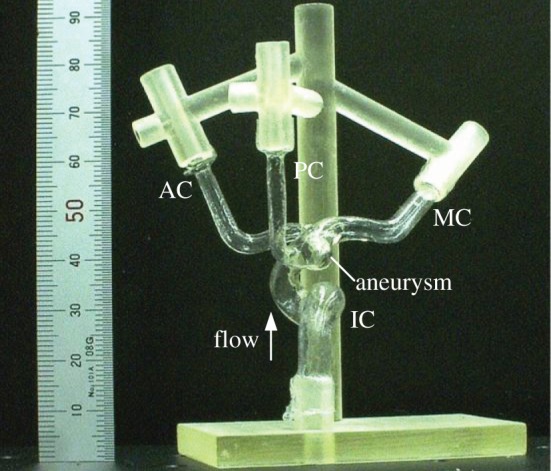
Patient-specific replica of human cerebral aneurysm. The inner geometry of replica corresponded to an actual aneurysm found at 9 days before rupture. The replica was fabricated in a full scale using transparent silicone rubber. IC, MC, AC and PC denote the internal carotid, middle cerebral, anterior cerebral, and posterior communicating arteries, respectively.
2.2. In vitro cerebral circulation
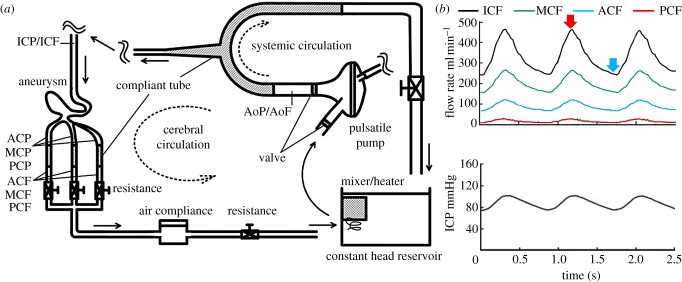
A physiological cerebral circulation was reproduced using a standard flow rate and pressure waveform (figure 2). The flow rate and pressure were monitored by electromagnetic flow meters (MFV-2100; Nihon Kohden, Tokyo, Japan) and pressure transducers (UK-801; Baxter, Irvine, CA, USA). The systemic circulation was driven by a pneumatically controlled pulsatile pump [22]. A heart rate was set to be 70 beats per minute. The systemic and cerebral loop obeyed a Windkessel circuit. All compliant components were given by laboratory-made silicone rubber tubes, except for an air-filled compliance tank in the cerebral circulation. The IC flow rate was set to give mean and peak values of 330 and 480 ml min−1, respectively (figure 2), where the mid-systolic and late-diastolic Reynolds numbers were 450 and 230, respectively, and the Wormersley number was 3.2. The diameter of the IC inlet (5.0 mm) was used for computation. An entrance length of 500 mm was placed at the inlet of the IC. The ratio of the mean PCF, ACF and MCF was set to be 1 : 5 : 12, which approximately corresponds to those of healthy adults [25]. A parametric study included a change in the mean PCF from 0 to 55 ml min−1 while maintaining the same ICF, leading us to confirm that the inflow structure including the location of flow impingement was unchanged. Excellent repeatability of flow waveforms was ensured, and the cycle-to-cycle variations were confirmed to be virtually negligible (figure 2). The working fluid consisted of glycerin and water with a bulk mass ratio of 3 : 2. This fluid is known to show a Newtonian behaviour, and the density and viscosity were 1160 kg m−3 and 5.3 mPa · s at 37°C, respectively. Human blood behaves as a non-Newtonian shear-thinning fluid, but this behaviour is only at a shear rate of less than 200 s−1 [26]. The present shear rate was of the order of 500 s−1 minimum. This observation justified disregarding the non-Newtonian nature of blood. The working fluid was maintained at 37°C, and the refractive index was adjusted to 1.4096 ± 0.002 at a 532 nm wavelength, which ensured nearly perfect matching of the refractive index with that of silicone rubber [27]. This liquid is hereinafter referred to as index-matching liquid.
Figure 2.
(a) Schematic of flow circulation system, and (b) flow rate and pressure waveforms. ICF, MCF, ACF and PCF are flow rates in the internal carotid, middle cerebral, anterior cerebral and posterior communicating arteries, respectively, and ICP is pressure in the internal carotid artery. Red and blue arrows in the flow waveform indicate time phases defined as mid-systole and late diastole, respectively.
2.3. Fluorescent scanning stereoscopic particle image velocimetry
FS-SPIV is a multiplane scanning SPIV measurement using fluorescent seeding particles in refractive index-matching environments (figure 3). Technical details of SPIV can be found elsewhere [28]. The validation of FS-SPIV has been performed previously in cardiovascular applications, such as ventricular assist devices and prosthetic heart valves, with the aid of laser Doppler velocimetry (LDV) and two-dimensional particle image velocimetry [22,23].
Figure 3.
Schematic of a fluorescent scanning stereoscopic particle image velocimetry system (a, top view; b, side view). The replica of cerebral aneurysm was immersed into refractive-index matching liquid, and the position of replica was precisely controlled using translational and rotational stages with the four degrees of freedom. Photograph (c) shows scattering light (green) and fluorescence (orange) from an exciting laser light and seeding particles, respectively. The fluorescence was selectively acquired by blocking the scattering light using an optical filter. Fluorescent images (d) visualized near-wall particles, whereas non-fluorescent images (e) failed to visualize the particles due to wall-reflective lights.
The optical components of FS-SPIV consist of a high-repetition pulsed laser and a pair of high-speed cameras (figure 3). The laser was a diode-pumped solid-state neodymium-doped yttrium lithium fluoride (Nd : YLF) laser (DS20-527; Photonics Industries, Bohemia, NY, USA), which has a capability of emitting a nanosecond pulse with a wavelength of 527 nm and energy of 8 mJ at a repetition rate of 1 kHz. A double-pulsed mode, which splits a single laser pulse into twin pulses with a desired time interval, is able to adjust particle displacements between a pair of successive images. A thin laser light sheet is achieved by using a beam expander and a series of optical lenses. The thickness of the laser light sheet (tL) measured by a laser beam profiler (SPIRICON SP620U; Ophir-Spiricon, Logan, UT, USA) was confirmed to be within 100 ± 20 μm. A high-speed camera (Fastcam1024; Photoron, Tokyo, Japan) was equipped with a complementary metal-oxide semiconductor sensor with a format of 1024 × 1024 pixels. A function generator controlled synchronization of the laser and cameras. Image acquisition was performed and 15 pairs of successive particle images were recorded by setting a 30 ms time period during mid-systole and late diastole independently, which was repeated over 10 pulsatile cycles. This setting allowed us to measure the time-resolved profiles of instantaneous velocity variations at a sampling frequency of 500 Hz, and the total number of 150 velocity vectors was obtained at each scanning plane in a phase-locked manner.
A pair of cameras were angled at 30° in the normal direction to the laser light sheet (figure 3a). The lens of the camera had a focal distance of 85 mm, and an attached bellows enabled particle images to be acquired at a magnification of 11.8 μm per pixel. The camera sensor was slightly tilted to the lens to meet the Scheimpflug configuration [28]. A lens aperture of f/16 was used to ensure sufficient depth-of-field. Seeding particles were fluorescent particles (Fluostar; EBM, Tokyo, Japan). The mean diameter and density of particles were 15 μm and 1100 kg m−3, respectively. The particles contained rhodamine B, a fluorescent dye, emitting orange fluorescence when illuminated by a green laser light (figure 3). An optical filter with a cut-off wavelength of 550 nm (CVI Melles Griot, NM, USA) allowed us to acquire fluorescent lights selectively by eliminating undesired scattering lights from the wall of the replica. The seeding particles ensured there was sufficient fluorescent light intensity against the lens aperture of f/16.
In situ calibration was carried out in the index-matching liquid (figure 3). Matching the refractive index of the liquid with that of silicone rubber minimized optical distortion owing to wall curvature, allowing us to perform the calibration outside the replica [27]. A calibration plate showed numerous dots, which were 62.5 μm in diameter with an interval of 125 μm. A single-image camera calibration was performed using a Tsai pinhole model [29]. The centre of the dot was determined by pattern matching, with an uncertainty of 0.1 pixels. The Tsai camera model calculated the camera angle and position in situ [30,31]. All particle images were back-projected (dewarped) into physical coordinates in pixel units. Image dewarping was able to correct varying magnifications in the field of view, ensuring a spatially coinciding interrogation volume from both viewing directions. Moreover, image dewarping was able to verify the accuracy of calibration and compensate possible errors associated with the misalignment of laser light sheet to the target plate. After iterative compensations, the optical misalignment was confirmed to be less than a few micrometres even at the edge of the image.
A pair of velocity vectors were calculated using an adaptive cross-correlation scheme, including sub-pixel shifting and window deformation. The final interrogation size was reduced to 8 × 8 pixels with 50 per cent overlap. A pair of velocity vectors obtained from the left and right cameras were combined to reconstruct three-component velocity vectors. All SPIV processing described earlier was performed using commercial software (VidPIV4.6XP v. 5; Intelligent Laser Application, Jűlich, Germany). The in-plane spatial resolution was 94 × 94 μm2 with an interval of 47 μm. The total 41 planes were scanned with a 150 μm pitch to cover the whole volume of the aneurysm. The accuracy of plane positioning was confirmed to be less than 10 μm. The following formulae were used to calculate phase-locked mean velocity (MEAN or  ), fluctuating velocity (u′, v′ and w′) and turbulent kinetic energy (TKE or k),
| 2.1 |
| 2.2 |
| 2.3 |
 |
2.4 |
| 2.5 |
where U is an instantaneous velocity magnitude, and u, v and w are its three-component vectors. The bar and prime represent the phase-locked mean and fluctuating components, respectively. N denotes the total number of velocity sampling (N = 150).
2.4. Wall shear stress calculation
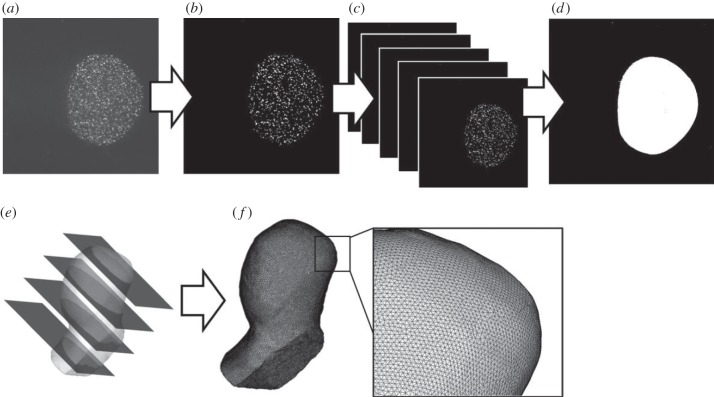
The inner geometry of the replica was reconstructed in situ using particle images (figure 4). Three hundred particle images during a time period of 30 ms (see §2.3) were overlapped, allowing us to determine the wall location. An associated uncertainty at the mid-plane of the aneurysm was found to be a few pixels, corresponding to approximately 30 μm (±15 μm). The scheme of reconstruction implicitly assumed that the wall motion and deformation was pseudo-stationary at the same time phase in every pulsatile cycle. The wall location was microscopically investigated, confirming that in-phase wall displacements and cycle-to-cycle variations fell within the range of the above uncertainty. All images were dewarped to physical coordinates. The dewarped images were able to define an identical coordinate system between the measured velocity and reconstructed geometry. A set of images were imported to volume-rendering software (MIMICS; Materialise) to reconstruct the three-dimensional geometry. Then, the geometry was meshed by commercial software (ICEM; ANSYS, Canonsburg, PA, USA).
Figure 4.
In situ three-dimensional reconstruction of inner geometry of replica (a, fluorescent image; b, binarization; c, phase-locked overlapping; d, image dewarping; e, volume rendering; f, meshing).
The phase-locked mean velocity and turbulent kinetic energy measured at each scanning plane were interpolated into a meshed geometry. The interrogation volume was aligned in a Cartesian coordinate (Xc, Yc, Zc). The wall-nearest vector was overlapped with aneurysmal wall. Wall overlapping caused measurement errors (figure 5), which were not only due to the lack of seeding particles (random error), but also due to the wrong allocation of velocity vector (bias error). Herein, the contaminated velocity was simply excluded (figure 5). Assuming the interrogation volume as rectangular parallelepiped (ΔXc = ΔYc = 94 μm, ΔZc = tL = 100 μm), the length of overlapping (L) was estimated to be 83.2 μm (L = 0.5 (ΔXc2 + ΔYc2 + ΔZc2)0.5). Thus, the velocity within the range of Zw < L (Zw: local wall-normal axis) was excluded.
Figure 5.
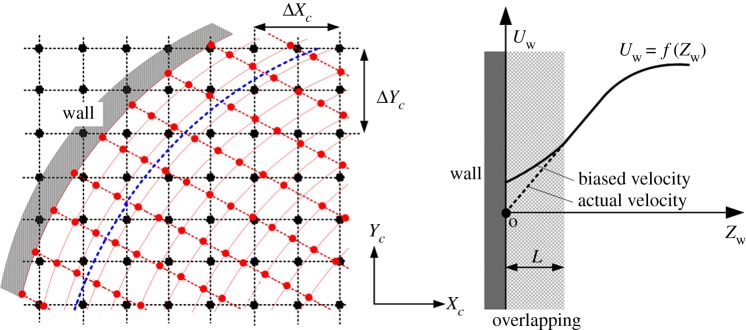
Diagram of measurement error due to the overlapping of interrogation volume with the wall. In the left, the black dotted line and dots are a Cartesian coordinate system and the location of measured velocity in FS-SPIV, respectively. The red dotted line and dots denote prismatic elements for velocity interpolation and the location of interpolated velocity, respectively. The blue dotted line denotes the boundary of wall overlapping, and the overlapping length L was defined in the wall-normal direction with an origin at the centre of surface elements.
The near-wall mesh consisted of prismatic layers, and the size of the element in the wall-normal direction was set to be half of the velocity interval. The interpolation scheme used an inverse-distant algorithm. The computation was carried out using an in-house code by Matlab (MathWorks, Natick, MA, USA). The three-dimensional streamlines and contour plots were made using commercial software (Tecplot 360; Tecplot, Bellevue, WA, USA). WSS was obtained using an in-house Matlab code by setting local coordinates at each of the surface elements. The magnitude of WSS was calculated using a first-order approximation
| 2.6 |
with μ being the dynamic viscosity of working fluid and Uw being the magnitude of local wall-parallel fluid velocity (Uw = f(Zw)). A calculation point of Z1 was set to be 100 μm, and the reference point of Z0 to be zero, namely located on the luminal surface. For computation, the effect of relative velocity was assumed to be negligible, (Uw(Z0) = 0), and non-slip conditions were applied. The rate of wall displacement was assumed to reach its maximum from early to mid-systole (a time period of 250 ms). The wall displacement was observed to be of the order of 500 μm. Then, the representative value of wall displacement rate was estimated to be 2 × 10⁻³ m s−1. The near-wall velocity was of the order of 0.05 m s−1 at the minimum. The ratio was found to be only 4 per cent thereby justifying excluding the effect of relative velocity. For analysing the spatial direction of WSS, a wall shear vector was defined as a unit vector as follows
| 2.7 |
where Uw,X and Uw,Y are a local wall-parallel velocity component  .
.
2.5. Measurement uncertainty
The uncertainty of modern PIV is of the order of 0.1 pixels [32]. Given an image magnification of 11.8 μm per pixel and a laser-pulse interval of 30 μs, a possible uncertainty was estimated to be the order of 0.04 m s−1. For example, an aneurysmal jet with a velocity of 0.5 m s−1 gave a measurement uncertainty of 8 per cent. In SPIV, the measurement uncertainty of out-of-plane velocity is related to a camera angle θ via a formula er = 1/tanθ (= 1.7), which indicates a gain in error propagation from in-plane to out-of-plane velocity [33].
WSS was associated with a greater uncertainty due to the wall location. The uncertainty of WSS was evaluated by the following formula, where Δɛ denotes the uncertainty of the wall location,
| 2.8 |
Formula (2.8) described that the WSS magnitude from formula (2.6) can vary due to the uncertainty of the reference calculation point (Z1±Δɛ), which was caused by the uncertainty of determining the wall location:
 |
2.9 |
The following formula was assumed.
| 2.10 |
Then,
| 2.11 |
Given Z1 = 100 μm and Δɛ = 15 μm (§2.4), formula (2.11) shows that the uncertainty of the wall location increased that of WSS by ±15%. Given the wall-parallel velocity of Uw(Z1) = 0.5 m s−1 (corresponding to maximum), the measurement uncertainty of WSS reached the order of ±20%. In the earlier-described analysis, a linear relation of Uw as a function of Zw was assumed within a range of Zw < Z1 = 100 μm. In addition, the uncertainty of near-wall velocity was assumed to be similar to that of far-wall.
3. Results
3.1. Phase-locked mean flow structure
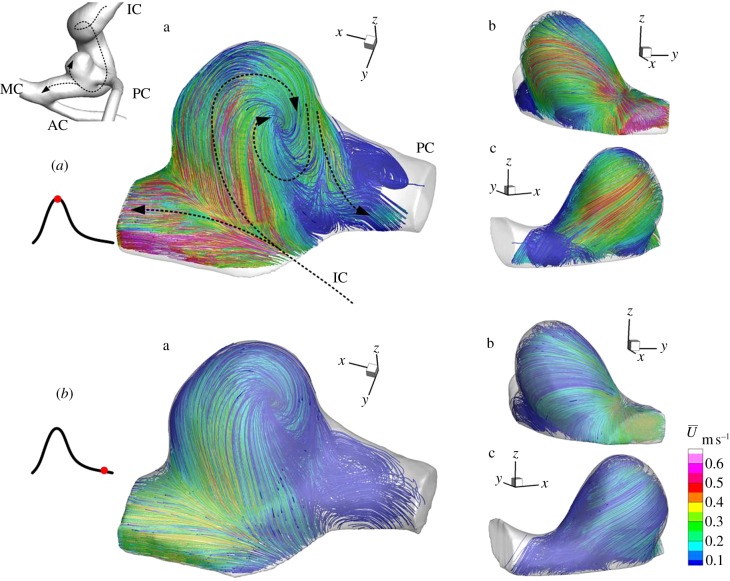
A three-dimensional flow structure in a patient-specific, full-scale and elastic-wall replica of cerebral artery with a small aneurysm, which was exactly the same physical size as that found 9 days before rupture, was measured by FS-SPIV. The streamlines from three viewing angles (a, b, c) were summarized in figures 6 and 7, and coloured by a phase-locked mean velocity  . High-density streamlines in figure 6 allowed us to understand the trajectory of the near-wall flow during mid-systole and late diastole, respectively. Figure 7 explains major flow elements during mid-systole. The inflow to the aneurysm was found to impinge and bifurcate at the distal side of the neck (figure 6a). During mid-systole, the bifurcating flow into the aneurysm became a wall jet that could be recognized by a locally elevated velocity of 0.5 m s−1, whereas that of late diastole was observed to be more diffusive. As described in §3.2, flow transition from a laminar regime was induced only during mid-systole. The wall jet during mid-systole was not directed to an aneurysmal dome, which was rather occupied with a weak flow separated from the wall jet (figure 6a(b)). Then the separated flow was entrained into a vortex emerging in the outflow tract (figures 6a(a) and 7). The internal flow structure was found to be extremely complex (figure 7). The inflow and outflow intersected and formed a crossflow at the aneurysmal neck. The outflow was severely twisted and squeezed by a limited flow passage owing to inflow. The aneurysmal core vortex was found to be significantly distorted. A stagnant flow occupied the core region of aneurysm, which was found to be more organized during mid-systole than late diastole.
Figure 6.
Streamlines during mid-systole (a, upper group) and late diastole (b, lower group) from three viewing angles (a–c). Colour coding shows the phase-locked mean velocity.
Figure 7.

Major flow elements during mid-systole: inflow jet (solid arrow), vortex (dotted arrow) and outflow (dashed arrow). Colour coding shows the phase-locked mean velocity.
3.2. Wall shear stress and turbulent kinetic energy
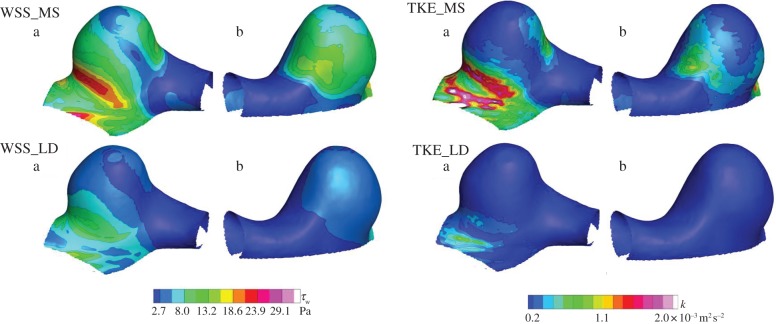
WSS and TKE during mid-systole were compared with those of late diastole (figure 8). TKE was calculated on a planar basis, interpolated into a meshed geometry and mapped at each of the surface elements. The colour contours corresponded to its magnitude at a 100 μm inner side from the wall. WSS is a frictional force per unit area as defined by a vector quantity in a local coordinate, whereas the TKE is a mean kinetic energy per unit mass associated with fluctuating velocity as defined by a scalar quantity in a global coordinate.
Figure 8.
Wall shear stress (WSS) and turbulent kinetic energy (TKE) maps during mid-systole (MS) and late diastole (LD) from two viewing angles (a,b). The left and right colour codings show WSS and TKE, respectively.
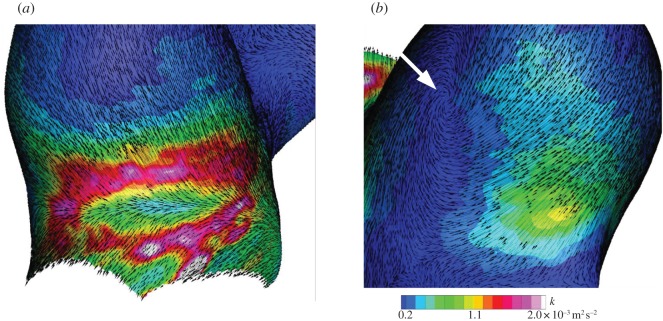
During mid-systole, a locally elevated WSS of 25 Pa was observed in the immediate downstream of flow impingement, and this site was hereinafter referred to as a flow bifurcation. The bifurcating flow became a wall jet, resulting in a fairly uniform WSS along with the jet trajectory at approximately half magnitude to the maximum. The aneurysmal dome occupied by the separated flow exhibited a smaller WSS of the order of 3 Pa. The maximum TKE was observed to be localized around the flow impingement in the inflow region, demonstrating the substantial instability of the inflow impingement into bifurcation. It was concluded that the site of flow bifurcation was exposed to an elevated frictional force, which was not only characterized by magnitude alone, but also by a temporal fluctuation. During late diastole, the flow impingement was found to be diminished. The velocity fluctuation observed during mid-systole almost disappeared during late diastole. In other words, the velocity fluctuation was found to appear intermittently during a cardiac cycle. Consequently, the instability of aneurysmal flow was found to be induced only during mid-systole, and flow during late diastole became stabilized.
Figure 9 shows WSS vectors with the colour contours of TKE during mid-systole. At the site of flow bifurcation, the spatial direction of WSS was found to be abruptly changed and form a radiational pattern, which is hereinafter termed as a divergence of WSS. The combination of temporal fluctuation and spatial divergence was characteristic of flow impingement. This unusual WSS was physically interpreted as a high-frequency-fluctuating tearing force. On the other hand, the elevated TKE was also observed at a PC junction in the outflow site. Although both sites seemed similar at first sight, the direction of WSS allowed us to notice differences. Unlike the divergent pattern at flow impingement in the inflow site, WSS vectors in the outflow site remained fairly parallel. Another finding was a rotating WSS found at the root of the aneurysmal vortex along with the outflow tract. Consequently, such WSS types can be characterized by three patterns: (i) divergent, (ii) parallel, and (iii) rotating.
Figure 9.
Wall shear stress (WSS) vectors with colour contours of turbulent kinetic energy (TKE) during mid-systole in (a) the inflow and (b) outflow tracts, respectively. A white arrow shows the rotating root of vortex.
3.3. Spatial and temporal distribution of turbulent kinetic energy
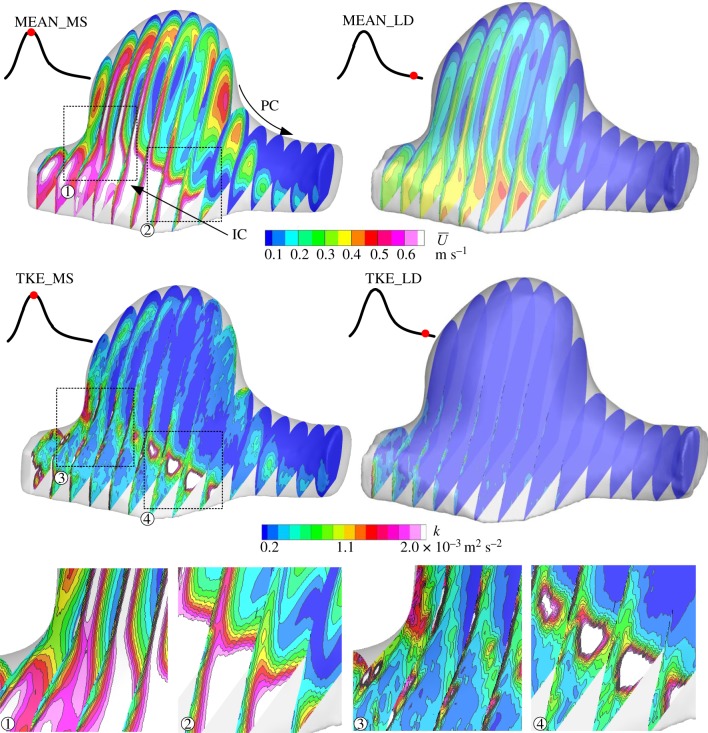
The spatial distribution of phase-locked mean velocity and TKE during mid-systole and late diastole is shown in figure 10. The temporal variation of time-resolved instantaneous velocity at a selected point during mid-systole is shown in figure 11. Instantaneous velocity plots during a time period of 30 ms were combined for 10 successive pulsatile cycles.
Figure 10.
Spatial distribution of phase-locked mean velocity (MEAN,  ) and turbulent kinetic energy (TKE, k) during mid-systole (MS, left) and late diastole (LD, right). Dotted line squares are zoomed (1–4).
Figure 11.
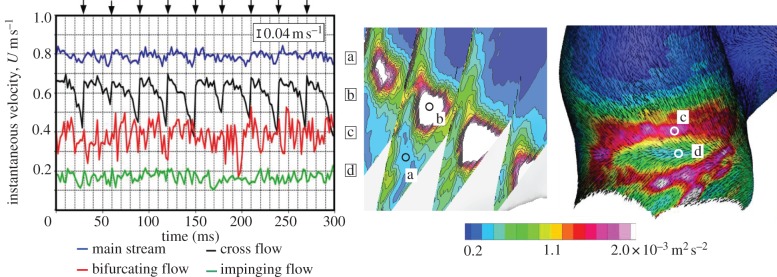
Comparison of instantaneous velocity plots at several locations (a–d) during mid-systole. The 15 instantaneous velocities measured at 500 Hz during a time period of 30 ms were plotted through 10 pulsatile cycles, as shown by black arrows on the top of graph. The velocities at the bifurcating flow (c) and impinging flow (d) were sampled at a nominal distance of 100 μm inside from the wall. The measurement uncertainty of 0.04 m s−1 is shown in the figure.
Turbulent kinetic energy during mid-systole was confirmed to differ significantly from that of late diastole (figure 10). During mid-systole, TKE was also observed along with the shear layer of crossflow due to the intersection of inflow and outflow (figure 10 (4)). These velocity fluctuations observed during mid-systole almost disappeared during late diastole. In figure 11, the mainstream of the parent artery (IC) exhibited a fairly stable velocity profile despite the highest mean velocity of approximately 0.8 m s−1. The superimposed velocity fluctuation was sufficiently small and was similar to the measurement uncertainty (figure 11a). At the shear layer of crossflow, a large magnitude of TKE was observed as described earlier. Nonetheless, the temporal variation of instantaneous velocity was found to behave like a low-frequency periodic signal (figure 11b) unlike a high-frequency randomized signal at the flow bifurcation (figure 11c). Those observations demonstrated the presence of at least two types of flow instability in aneurysmal haemodynamics.
4. Discussion
Over the past decades, the advent of CFD in neurosurgery has increasingly unveiled aneurysmal haemodynamics on a patient-specific basis. Ruptured and unruptured aneurysms are retrospectively compared in an effort to establish a rupture risk predictor. However, the majority of studies accept the a priori assumption that aneurysmal haemodynamics can be fully represented by viscous laminar streams enclosed by a solid boundary. The assumption has been poorly verified owing to the limitation of experimental techniques. The recent finding of flow impingement often observed in ruptured aneurysms motivated us to investigate possible transition from a laminar regime. Unlike stationary pipe flows, free laminar jets exhibit a transition from a laminar regime at a fairly low Reynolds number. The critical Reynolds number (Rec,jet) is of the order of 500 [18,19], which is comparable to the Reynolds number of major cerebral arteries (table 1). The orders of the critical Reynolds numbers in the case of impinging jets [35–38] and wall jets [39] are in a similar range. In an early stage of research, pioneers reported the presence of flow instability using a glass-made idealized model of cerebral artery [40], but there are few studies addressing the same subject on a patient-specific basis. For demonstrating the presence of transition and relating it to WSS, a three-dimensional, high-resolution and time-resolved measurement of instantaneous near-wall velocity is required. The lack of measurement resolution (space and time) forces us to ignore the presence of fluctuating velocity. The requirements of spatial and temporal resolutions to resolve the true figure of aneurysmal haemodynamics have to be studied. A guide to determine the spatial resolution at the near wall may be beneficial when considering the wall friction velocity. Given a wall friction velocity (ue) and a characteristic wall coordinate (Zw+),
| 4.1 |
| 4.2 |
where ρ and ν are the density and kinematic viscosity of fluid, respectively. The location of wall-nearest velocity (Zw = 100 μm) was ensured to be within a range of Zw+ < 5, confirming that the location fell within a viscous sublayer even if the flow was assumed to reach a fully turbulent regime [41]. The adopted setting ensured a sufficient spatial resolution to resolve boundary layers. Also, a temporal resolution of 500 Hz allowed us to track the variation of instantaneous velocity up to 250 Hz according to the Nyquist sampling theorem.
Table 1.
Comparison of dimensionless flow parameters. Being unable to be described by the original authors, the parenthetic values were calculated by given parameters. Remax, Remin, and Remean represented the maximum, minimum, and mean Reynolds numbers of pulsatile flow, respectively. α indicated the Womersley number. MC and IC indicated middle cerebral and internal carotid arteries. LDV, CFD, and PIV were laser Doppler velocimetry, computational fluid dynamics, and particle image velocimetry, respectively.
| study | Remax | Remin | Remean | α | artery | method |
|---|---|---|---|---|---|---|
| Tateshima et al. [14] | 920 | 340 | n.a. | 7.4 | MC | LDV |
| Shojima et al. [13] | (560) | n.a. | 410 | 4.0 | MC | CFD |
| Cebral et al. [16,34] | (700)a | (130)a | (310)a | n.a. | IC | CFD |
| this study | 450 | 230 | 310 | 3.2 | IC | PIV |
aAssumed a bulk diameter to be 5 mm.
Transition from a laminar regime in oscillatory pipe flows has been studied by classifying into a pure oscillatory flow and an oscillatory flow superimposed on a mean flow. The transition of pure oscillatory flow is commonly evaluated by the Stokes-layer Reynolds number, Reδ = Uδ/ν, where U is the cross-sectional average of peak velocity, δ is the Stokes layer thickness  and ω is the frequency of flow oscillation. According to a survey by Winter & Nerem [42], the critical Reδ of pure oscillatory pipe flow is in the order of 500. Nerem et al. [43] have demonstrated the presence of transition in the thoracic aorta of dogs, and the critical Reynolds number (Reδ) is given as 150. This study gave only a smaller value for the Reδ (100; δ = 1.1 mm). Meanwhile, Stettler & Hussain [44] studied a wide range of relevant parameters in superimposed oscillatory flows. According to their data, the transitional Reynolds number with a Womersley number of 3.2 is estimated to be similar to that of a stationary pipe flow. The earlier-mentioned analysis allowed us to judge that the mainstream of internal carotid artery fell within a laminar regime. In fact, the TKE failed to appear along with the mainstream. Transition from a laminar regime was concluded to be local in both space and time, and its appearance was triggered by flow impingement.
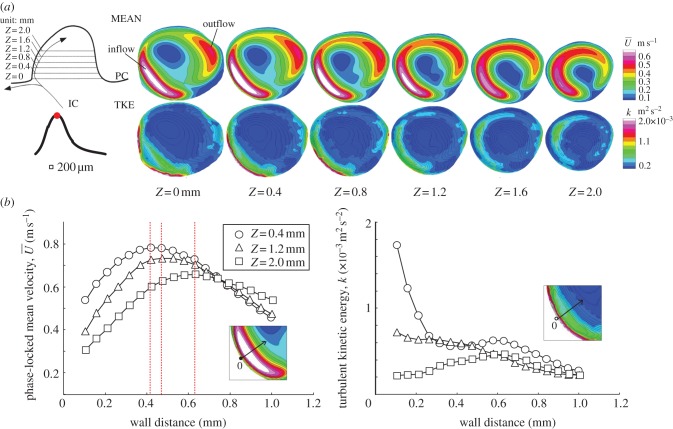
This study demonstrated that flow impingement and bifurcation yielded an unusual WSS characterized by a combination of temporal fluctuation and spatial divergence. The physical meaning of WSS could be interpreted as a high-frequency fluctuating tearing force. The fast Fourier transform analysis of velocity fluctuation was unsatisfactory owing to the small number of velocity samples, but the temporal variation of instantaneous velocity clearly delineated the presence of fluctuating velocity that exceeded the frequency range of the heart rate. Fluctuating velocity appeared only during mid-systole and disappeared during late diastole. The intermittent appearance of velocity fluctuation emphasized the effect of excessive inertia triggering the hydrodynamic instability of the shear layer. The existence of the critical Reynolds number was suggested. Flow impingement is known to behave unstably due to the adverse pressure gradient and the shear layer. The flow instability was speculated to be affected by the downstream curvature of the aneurysmal wall. At the site of flow bifurcation, the trajectory of the jet stream took the nearest location to the wall. The thickness of the boundary layer was considerably narrowed, and then abruptly expanded due to the presence of the wall jet deviating from the aneurysmal wall (figure 12). The thickening boundary layer caused an adverse pressure gradient. The near-wall flow at that site was diverted by the emergence of pressure elevation, thereby promoting the appearance of a high-frequency fluctuating velocity. The same mechanism was adopted for the increased TKE observed in the PC junction (figure 9). Upon a sudden overexpansion of flow passage, the near-wall flow became unstable owing to the adverse pressure gradient.
Figure 12.
(a) Velocity diagram of wall jet in the inflow tract from Z = 0 to 2.0 by 0.4 mm in height during mid-systole. The locations were shown at the top-left corner. The colour contour plots show the phase-locked mean velocity (MEAN,  ) and turbulent kinetic energy (TKE, k). In the plots of TKE, the line contour corresponded to that of mean velocity. The bottom figures (b) show the MEAN and TKE as a function of wall distance where the horizontal axis was aligned to pass through the location of maximum jet velocity (Z) at 0.4, 1.2, and 2.0 mm. The red dotted line indicates the location of the maximum jet velocity.
Baek et al. [45] performed a high-resolution CFD study using a spectral/hp element method assuming solid boundaries and demonstrated the presence of fluctuating velocity exceeding the frequency range of the heart rate. The corresponding site is observed to be exposed to a temporally and spatially varying WSS in magnitude and direction. Torii et al. [46] demonstrate that an aneurysmal inflow with an elastic boundary differs from that with a solid boundary. According to their data, the effect of wall motion and deformation appears to affect the inflow pattern, especially at the site of flow impingement. Flow impingement surely elevates the local pressure, but the elevation may be only a few percent above physiological blood pressure [47]. Assuming the jet velocity (u) to be 1 m s−1, the pressure elevation can be only within a value of 1/2ρu2 ≈ 500 Pa (3.8 mm Hg). Although the value may be small compared with blood pressure, the pressure elevation acted locally on the wall, unlike blood pressure. The local pressure elevation may contribute to the greater extent of wall motion and deformation at that site. The role of fluid–structure coupling for the mechanism of flow transition deserves further investigations.
A low-frequency periodic velocity oscillation was found at the intersection of inflow and outflow. The origin of flow instability may be intricate. The instability of crossflow is documented by Camussi et al. [48]. Hydrodynamic instability of the shear layer was suspected because of the possible presence of entrainment. On the other hand, the core region of the aneurysm may be exposed to lower pressure by the presence of a vortex, resulting in the undulating motion of the shear layer. As seen in streamlines, the aneurysm during mid-systole experienced a spatially distorted vortical core. The formation of the vortex induced a radial pressure gradient, which was enlarged during mid-systole by the emergence of a strong tangential velocity. By considering that the flow instability not only appeared intermittently, but also with a periodical fluctuation, the effect of pressure-induced instability should be taken into account as a potential to trigger a low-frequency periodic velocity oscillation.
In the community of aneurysmal haemodynamics, the magnitude of WSS has been placed at the centre of a long-standing controversy in an attempt to clarify the relation with aneurysmal growth. In the field of cell biology, however, it is widely known that not only the magnitude but also the temporal variation and spatial gradient of WSS are related to the varying response of endothelial cells. To date, little is known about the role of temporal variation and spatial gradient of WSS on aneurysmal growth and rupture. Flow impingement often observed in ruptured aneurysms is still phenomenological, which has to be mapped to the relevant wall parameters in an effort to better understand the relation with aneurysmal pathology. Therefore, the unsteady dynamics of near-wall flow has to be fully understood. The data in this study demonstrated that WSS was unable to be fully characterized by the magnitude alone, and the temporal frequency and spatial direction should be taken into consideration. The spatial direction of WSS was classified into (i) divergent, (ii) rotating, and (iii) parallel (figure 13). The site-dependent nature of the temporal and spatial WSS pattern may be associated with the possible presence of the epicentre of wall degradation, such as the damage to endothelial cells and the infiltration of inflammatory cells.
Figure 13.
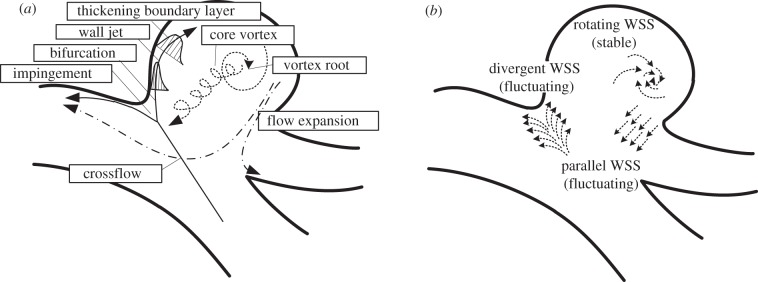
(a) Proposed characteristics of flow elements and (b) unusual shear stress. In the left illustration, the solid, dotted and dashed arrows represent the inflow trajectory, core vortex and outflow, respectively.
The pathophysiology of ruptured human cerebral aneurysms may be different from that of unruptured aneurysms. Kataoka et al. [49] compared 44 ruptured and 27 unruptured cases, and found that endothelial cells in ruptured aneurysms are most likely damaged, often with adherent blood cells, whereas most unruptured aneurysms are covered with normally shaped endothelial cells. Increased absence of endothelial cells in ruptured aneurysms was also observed by Frösen et al. [50]. The damage to endothelial cells may differ regionally owing to the site dependency of haemodynamics, but their correlation has yet to be investigated. In the study of atherogenesis, disturbed flow patterns, such as low flow, flow separation, gradients, flow reversal and turbulence are known to be associated with high rates of both endothelial cell proliferation and apoptosis, the failure of alignment in the flow direction, the increased expression of inflammatory mediators, and so on [51]. The response of endothelial cells exposed to shear stress is widely studied by varying the frequency, direction, gradient and net flux. Endothelial cells are capable of sensing these differences, and transmit intracellular signals accordingly to alter the cellular function [52]. Davies et al. [53] found that the fluctuating WSS induces endothelial cell turnover, which is markedly increased compared to laminar shear stress of a similar magnitude. Himburg et al. [54] studied the frequency-dependent response of endothelium to pulsatile shear stress and found that the proinflammatory response evoked at the higher frequency than that of heart rate is most pronounced in a reversing and oscillatory shear stress. Tardy et al. [55] investigated a reattaching flow behind a backward-facing step and found that endothelial cells migrate away from the flow separation via a proliferation–migration–loss cycle, which indicates the shear stress gradient may play a key role in the morphological remodelling of endothelium. These results support our rational speculation that flow impingement and bifurcation may become an epicentre of wall degradation by inducing damage to endothelial cells due to a combination of temporal fluctuation and spatial divergence of WSS.
5. Conclusion
To the best of our knowledge, this study for the first time experimentally demonstrated the presence of transition from a laminar regime in patient-specific aneurysmal haemodynamics. The three-dimensional, high-resolution and time-resolved analysis of near-wall velocity revealed the temporal and spatial dynamics of WSS in an unprecedented manner. Flow impingement was confirmed to promote a flow transition, thereby imposing a unique WSS with a combination of temporal fluctuation and spatial divergence. The physical interpretation of WSS can be represented by a high-frequency fluctuating tearing force. The frequency range of velocity fluctuation was confirmed to be far beyond that of the heart rate. Two types of velocity fluctuation, high-frequency-randomized and low-frequency-periodic fluctuations, were found to exist. The present results demonstrated that a priori assumption of treating the aneurysmal haemodynamics as a fully viscous laminar flow should be carefully verified. This study provided the first experimental data of unveiled three-dimensional complex aneurysmal haemodynamics enclosed by an elastic boundary. These data should be used as a benchmark to evaluate the assumption of CFD. Also, a further experimental research of flow unsteadiness should include other aneurysms with different anatomical locations and shapes.
Acknowledgements
This research was supported by Health Science Research Grant (H20-IKOU-IPAN-001) from Ministry of Health, Labour and Welfare, Japan.
References
- 1.Brisman JL, Song JK, Newell DW. 2006. Cerebral aneurysms. N. Engl. J. Med. 355, 928–939 10.1056/NEJMra052760 (doi:10.1056/NEJMra052760) [DOI] [PubMed] [Google Scholar]
- 2.White PM, Wardlaw JM. 2003. Unruptured intracranial aneurysms. J. Neuroradiol. 30, 336–350 [PubMed] [Google Scholar]
- 3.The International Study of Unruptured Intracranial Aneurysms Investigator 1998. Unruptured intracranial aneurysms: risk of rupture and risks of surgical intervention. N. Engl. J. Med. 339, 1725–1733 10.1056/NEJM199812103392401 (doi:10.1056/NEJM199812103392401) [DOI] [PubMed] [Google Scholar]
- 4.Kataoka K, Taneda M, Asai T, Yamada Y. 2000. Difference in nature of ruptured and unruptured cerebral aneurysms. Lancet 355, 203. 10.1016/S0140-6736(99)03881-7 (doi:10.1016/S0140-6736(99)03881-7) [DOI] [PubMed] [Google Scholar]
- 5.Ujiie H, et al. 1999. Effects of size and shape (aspect ratio) on the hemodynamics of saccular aneurysms: a possible index for surgical treatment of intracranial aneurysms. Neurosurgery 45, 119–130 10.1097/00006123-199907000-00028 (doi:10.1097/00006123-199907000-00028) [DOI] [PubMed] [Google Scholar]
- 6.Ujiie H, Tamano Y, Sasaki K, Hori T. 2001. Is the aspect ratio a reliable index for predicting the rupture of a saccular aneurysms? Neurosurgery 48, 495–503 10.1097/00006123-200103000-00007 (doi:10.1097/00006123-200103000-00007) [DOI] [PubMed] [Google Scholar]
- 7.Boussel L, et al. 2008. Aneurysm growth occurs at region of low wall shear stress: patient-specific correlation of hemodynamics and growth in a longitudinal study. Stroke 39, 2997–3002 10.1161/STROKEAHA.108.521617 (doi:10.1161/STROKEAHA.108.521617) [DOI] [PMC free article] [PubMed] [Google Scholar]
- 8.Chien A, Tateshima S, Sayre J, Castro M, Cebral J, Viñuela F. 2009. Patient-specific hemodynamic analysis of small internal carotid artery-ophthalmic artery aneurysms. Surg. Neurol. 72, 444–450 10.1016/j.surneu.2008.12.013 (doi:10.1016/j.surneu.2008.12.013) [DOI] [PubMed] [Google Scholar]
- 9.Hassan T, Timofeev EV, Saito T, Shimizu H, Ezura M, Matsumoto Y, Takayama K, Tominaga T, Takahashi A. 2005. A proposed parent vessel geometry-based categorization of saccular intracranial aneurysms: computational flow dynamics analysis of the risk factors for lesion rupture. J. Neurosurg. 103, 662–680 10.3171/jns.2005.103.4.0662 (doi:10.3171/jns.2005.103.4.0662) [DOI] [PubMed] [Google Scholar]
- 10.Isoda H, et al. 2010. In vivo hemodynamic analysis of intracranial aneurysms obtained by magnetic resonance fluid dynamics (MRFD) based on time-resolved three-dimensional phase-contrast MRI. Neuroradiology 52, 921–928 10.1007/s00234-009-0635-3 (doi:10.1007/s00234-009-0635-3) [DOI] [PubMed] [Google Scholar]
- 11.Jou L-D, Lee DH, Morsi H, Mawad ME. 2008. Wall shear stress on ruptured and unruptured intracranial aneurysms at the internal carotid artery. Am. J. Neuroradiol. 29, 1761–1767 10.3174/ajnr.A1180 (doi:10.3174/ajnr.A1180) [DOI] [PMC free article] [PubMed] [Google Scholar]
- 12.Meckel S, Stalder AF, Santini F, Radü E-W, Rüfenacht DA, Markl M, Wetzel SG. 2008. In vivo visualization and analysis of 3-D hemodynamics in cerebral aneurysms with flow-sensitized 4-D MR imaging at 3T. Neuroradiology 50, 473–484 10.1007/s00234-008-0367-9 (doi:10.1007/s00234-008-0367-9) [DOI] [PubMed] [Google Scholar]
- 13.Shojima M, Oshima M, Takagi K, Torii R, Hayakawa M, Katada K, Morita A, Kirino T. 2004. Magnitude and role of wall shear stress on cerebral aneurysm computational fluid dynamic study of 20 middle cerebral artery aneurysms. Stroke 35, 2500–2505 10.1161/01.STR.0000144648.89172.0f (doi:10.1161/01.STR.0000144648.89172.0f) [DOI] [PubMed] [Google Scholar]
- 14.Tateshima S, Murayama Y, Villablanca JP, Morino T, Nomura K, Tanishita K, Viñuela F. 2003. In vitro measurement of fluid-induced wall shear stress in unruptured cerebral aneurysms harboring blebs. Stroke 34, 187–192 10.1161/01.STR.0000046456.26587.8B (doi:10.1161/01.STR.0000046456.26587.8B) [DOI] [PubMed] [Google Scholar]
- 15.Sforza DM, Putman CM, Cebral JR. 2009. Hemodynamics of cerebral aneurysms. Annu. Rev. Fluid Mech. 41, 91–107 10.1146/annurev.fluid.40.111406.102126 (doi:10.1146/annurev.fluid.40.111406.102126) [DOI] [PMC free article] [PubMed] [Google Scholar]
- 16.Cebral JR, Castro MA, Burgess JE, Pergolizzi RS, Sheridan MJ, Putman CM. 2005. Characterization of cerebral aneurysms for assessing risk of rupture by using patient-specific computational hemodynamics models. Am. J. Neuroradiol. 26, 2550–2559 [PMC free article] [PubMed] [Google Scholar]
- 17.Meng H, Wang Z, Hoi Y, Gao L, Metaxa E, Swartz DD, Kolega J. 2007. Complex hemodynamics at the apex of an arterial bifurcation induces vascular remodeling resembling cerebral aneurysm initiation. Stroke 38, 1924–1931 10.1161/STROKEAHA.106.481234 (doi:10.1161/STROKEAHA.106.481234) [DOI] [PMC free article] [PubMed] [Google Scholar]
- 18.Crow SC, Champagne FH. 1971. Orderly structure in jet turbulence. J. Fluid Mech. 48, 547–591 10.1017/S0022112071001745 (doi:10.1017/S0022112071001745) [DOI] [Google Scholar]
- 19.Grant AJ. 1974. A numerical model of instability in axisymmetric jets. J. Fluid Mech. 66, 707–724 10.1017/S0022112074000462 (doi:10.1017/S0022112074000462) [DOI] [Google Scholar]
- 20.Ford MD, Nikolov HN, Milner JS, Lownie SP, DeMont EM, Kalata W, Loth F, Holdsworth DW, Steinman DA. 2008. PIV-measured versus CFD-predicted flow dynamics in anatomically realistic cerebral aneurysm models. J. Biomech. Eng. 130, 021015. 10.1115/1.2900724 (doi:10.1115/1.2900724) [DOI] [PubMed] [Google Scholar]
- 21.Hoi Y, Woodward SH, Kim M, Taulbee DB, Meng H. 2006. Validation of CFD simulations of cerebral aneurysms with implication of geometric variations. J. Biomech. Eng. 128, 844–851 10.1115/1.2354209 (doi:10.1115/1.2354209) [DOI] [PMC free article] [PubMed] [Google Scholar]
- 22.Yagi T. 2007. Modeling of fluid flow in a pulsatile artificial blood pump: implication for thrombosis. PhD Dissertation, Waseda University, Japan [Google Scholar]
- 23.Yagi T, Yang W, Umezu M. 2011. Effect of bileaflet valve orientation on the 3D flow dynamics in the sinus of Valsalva. J. Biomech. Sci. Eng. 6, 64–78 10.1299/jbse.6.64 (doi:10.1299/jbse.6.64) [DOI] [Google Scholar]
- 24.Hudetz AG, Márk G, Kovách AGB, Kerényi T, Fody L, Monos E. 1981. Biomechanical properties of normal and fibrosclerotic human cerebral arteries. Atherosclerosis 39, 353–365 10.1016/0021-9150(81)90022-8 (doi:10.1016/0021-9150(81)90022-8) [DOI] [PubMed] [Google Scholar]
- 25.Zhao M, Amin-Hanjani S, Ruland S, Curcio AP, Ostergren L, Charbel FT. 2007. Regional cerebral blood flow using quantitative MR angiography. Am. J. Neuroradiol. 28, 1470–1473 10.3174/ajnr.A0582 (doi:10.3174/ajnr.A0582) [DOI] [PMC free article] [PubMed] [Google Scholar]
- 26.Chien S. 1970. Shear dependence of effective cell volume as a determinant of blood viscosity. Science 168, 977–979 10.1126/science.168.3934.977 (doi:10.1126/science.168.3934.977) [DOI] [PubMed] [Google Scholar]
- 27.Yagi T, Sato A, Shinke M, Takahashi S, Umezu M, Takao H, Murayama Y. 2010. 3D Near-wall flow mapping by fluroescent Stereo-PIV in an elastic replica of human cerebral aneurysm. In Proc. 14th Int. Symp. Flow Visualization Daegu, Korea, 21–24 June, 2010 [Google Scholar]
- 28.Adrian R, Westerweel J. 2011. Particle image velocimetry. Cambridge, UK: Cambridge University Press [Google Scholar]
- 29.Kallweit S, Willert C, Dues M, Műller U, Lederer T. 2008. PIV for volume flow metering. In Proc. 14th Int. Symp. Applications of laser techniques to fluid mechanics Lisbon, Portugal, 7–10 July, 2008 [Google Scholar]
- 30.Wieneke B. 2005. Stereo-PIV using self-calibration on particle images. Exp. Fluids 39, 267–280 10.1007/s00348-005-0962-z (doi:10.1007/s00348-005-0962-z) [DOI] [Google Scholar]
- 31.Willert CE. 2006. Assessment of camera models for use in planar velocimetry calibration. Exp. Fluids 41, 135–143 10.1007/s00348-006-0165-2 (doi:10.1007/s00348-006-0165-2) [DOI] [Google Scholar]
- 32.Westerweel J. 2000. Theoretical analysis of the measurement precision in particle image velocimetry. Exp. Fluids 29, S3–S12 10.1007/s003480070002 (doi:10.1007/s003480070002) [DOI] [Google Scholar]
- 33.Lawson NJ, Wu J. 1997. Three-dimensional particle image velocimetry: error analysis of stereoscopic techniques. Meas. Sci. Technol. 8, 894–900 10.1088/0957-0233/8/8/010 (doi:10.1088/0957-0233/8/8/010) [DOI] [Google Scholar]
- 34.Cebral JR, Sheridan M, Putman CM. 2009. Hemodynamics and bleb formation in intracranial aneurysms. Am. J. Neuroradiol. 31, 304–310 10.3174/ajnr.A1819 (doi:10.3174/ajnr.A1819) [DOI] [PMC free article] [PubMed] [Google Scholar]
- 35.Chiriac VA, Ortega A. 2002. A numerical study of the unsteady flow and heat transfer in a transitional confined slot jet impinging on an isothermal surface. Int. J. Heat Mass Transf. 45, 1237–1248 10.1016/S0017-9310(01)00224-1 (doi:10.1016/S0017-9310(01)00224-1) [DOI] [Google Scholar]
- 36.Kim KC, Min YU, Oh SJ, An NH, Seoudi B, Chun HH, Lee I. 2007. Time-resolved PIV investigation on the unsteadiness of a low Reynolds number confined impinging jet. J. Vis. 10, 367–379 10.1007/BF03181895 (doi:10.1007/BF03181895) [DOI] [Google Scholar]
- 37.Lee HG, Yoon HS, Ha MY. 2008. A numerical investigation on the fluid flow and heat transfer in the confined impinging slot jet in the low Reynolds number region for different channel heights. Int. J. Heat Mass Transf. 51, 4055–4068 10.1016/j.ijheatmasstransfer.2008.01.015 (doi:10.1016/j.ijheatmasstransfer.2008.01.015) [DOI] [Google Scholar]
- 38.Varieras D, Brancher P, Giovannini A. 2007. Self-sustained oscillations of a confined impinging jet. Flow Turbulence Combust. 78, 1–15 10.1007/s10494-006-9017-7 (doi:10.1007/s10494-006-9017-7) [DOI] [Google Scholar]
- 39.Bajura RA, Catalano MR. 1975. Transition in a two-dimensional plane wall jet. J. Fluid Mech. 70, 773–799 10.1017/S0022112075002340 (doi:10.1017/S0022112075002340) [DOI] [Google Scholar]
- 40.Steiger HJ, Reulen H-J. 1986. Low frequency flow fluctuations in saccular aneurysms. Acta Neurochir. 83, 131–137 10.1007/BF01402392 (doi:10.1007/BF01402392) [DOI] [PubMed] [Google Scholar]
- 41.Schlichting H, Gersten K. 2000. Boundary layer theory, 8th edn Berlin, Germany: Springer [Google Scholar]
- 42.Winter DC, Nerem RM. 1984. Turbulence in pulsatile flows. Ann. Biomed. Eng. 12, 357–369 10.1007/BF02407780 (doi:10.1007/BF02407780) [DOI] [PubMed] [Google Scholar]
- 43.Nerem RM, Seed WA, Wood NB. 1972. An experimental study of the velocity distribution and transition to turbulence in the aorta. J. Fluid Mech. 52, 137–160 10.1017/S0022112072003003 (doi:10.1017/S0022112072003003) [DOI] [Google Scholar]
- 44.Stettler JC, Fazle Hussain AKM. 1986. On transition of the pulsatile pipe flow. J. Fluid Mech. 170, 169–197 10.1017/S0022112086000848 (doi:10.1017/S0022112086000848) [DOI] [Google Scholar]
- 45.Baek H, Jayaraman M, Karniadakis GE. 2009. Wall shear stress and pressure distribution on aneurysms and infundibulae in the posterior communicating artery bifurcation. Ann. Biomed. Eng. 37, 2469–2487 10.1007/s10439-009-9794-y (doi:10.1007/s10439-009-9794-y) [DOI] [PubMed] [Google Scholar]
- 46.Torii R, Oshima M, Kobayashi T, Takagi K, Tezduyar TE. 2007. Influence of wall elasticity in patient-specific hemodynamic simulations. Comp. Fluids 36, 160–168 10.1016/j.compfluid.2005.07.014 (doi:10.1016/j.compfluid.2005.07.014) [DOI] [Google Scholar]
- 47.Shojima M, Oshima M, Takagi K, Torii R, Nagata K, Shirouzu I, Morita A, Kirino T. 2005. Role of the bloodstream impacting force and the local pressure elevation in the rupture of cerebral aneurysms. Stroke 36, 1933–1938 10.1161/01.STR.0000177877.88925.06 (doi:10.1161/01.STR.0000177877.88925.06) [DOI] [PubMed] [Google Scholar]
- 48.Camussi R, Guj G, Stella A. 2002. Experimental study of a jet in a crossflow at very low Reynolds number. J. Fluid Mech. 454, 113–144 10.1017/S0022112001007005 (doi:10.1017/S0022112001007005) [DOI] [Google Scholar]
- 49.Kataoka K, Taneda M, Asai T, Kinoshita A, Ito M, Kuroda R. 1999. Structural fragility and inflammatory response of ruptured cerebral aneurysms: a comparative study between ruptured and unruptured cerebral aneurysms. Stroke 30, 1396–1401 10.1161/01.STR.30.7.1396 (doi:10.1161/01.STR.30.7.1396) [DOI] [PubMed] [Google Scholar]
- 50.Frösen J, Piippo A, Paetau A, Kangasniemi M, Niemelä M, Hernesniemi J, Jääskeläinen J. 2004. Remodeling of saccular cerebral artery aneurysm wall is associated with rupture: histological analysis of 24 unruptured and 42 ruptured cases. Stroke 35, 2287–2293 10.1161/01.STR.0000140636.30204.da (doi:10.1161/01.STR.0000140636.30204.da) [DOI] [PubMed] [Google Scholar]
- 51.Hahn C, Schwartz MA. 2009. Mechanotransduction in vascular physiology and atherogenesis. Nat. Rev. Mol. Cell. Biol. 10, 53–62 10.1038/nrm2596 (doi:10.1038/nrm2596) [DOI] [PMC free article] [PubMed] [Google Scholar]
- 52.Li YJ, Haga JH, Chien S. 2005. Molecular basis of the effects of shear stress on vascular endothelial cells. J. Biomech. 38, 1949–1971 10.1016/j.jbiomech.2004.09.030 (doi:10.1016/j.jbiomech.2004.09.030) [DOI] [PubMed] [Google Scholar]
- 53.Davies PF, Remuzzi A, Gordon EJ, Dewey CF, Jr, Gimbrone MA., Jr 1986. Turbulent fluid shear stress induces vascular endothelial cell turnover in vitro. Proc. Natl Acad. Sci. USA 83, 2114–2117 10.1073/pnas.83.7.2114 (doi:10.1073/pnas.83.7.2114) [DOI] [PMC free article] [PubMed] [Google Scholar]
- 54.Himburg HA, Dowd SE, Friedman MH. 2007. Frequency-dependent response of the vascular endothelium to pulsatile shear stress. Am. J. Physiol. Heart Circ. Physiol. 293, H645–H653 10.1152/ajpheart.01087.2006 (doi:10.1152/ajpheart.01087.2006) [DOI] [PubMed] [Google Scholar]
- 55.Tardy Y, Resnick N, Nagel T, Gimbrone MA, Jr, Dewey CF., Jr 1997. Shear stress gradients remodel endothelial monolayers in vitro via a cell proliferation-migration-loss cycle. Arterioscler. Thromb. Vasc. Biol. 17, 3102–3106 10.1161/01.ATV.17.11.3102 (doi:10.1161/01.ATV.17.11.3102) [DOI] [PubMed] [Google Scholar]


