Abstract
Atherosclerosis (AS) commonly occurs in the regions of the arterial tree with haemodynamic peculiarities, including local flow field disturbances, and formation of swirling flow and vortices. The aim of our study was to confirm low-density lipoprotein (LDL) concentration polarization in the vascular system in vitro and in vivo, and investigate the effects of LDL concentration polarization and flow field alterations on atherosclerotic localization. Red fluorescent LDL was injected into optically transparent Flk1: GFP zebrafish embryos, and the LDL distribution in the vascular lumen was investigated in vivo using laser scanning confocal microscopy. LDL concentration at the vascular luminal surface was found to be higher than that in the bulk. The flow field conditions in blood vessel segments were simulated and measured, and obvious flow field disturbances were found in the regions of vascular geometry change. The LDL concentration at the luminal surface of bifurcation was significantly higher than that in the straight segment, possibly owing to the atherogenic effect of disturbed flow. Additionally, a stenosis model of rabbit carotid arteries was generated. Atherosclerotic plaques were found to have occurred in the stenosis group and were more severe in the stenosis group on a high-fat diet. Our findings provide the first ever definite proof that LDL concentration polarization occurs in the vascular system in vivo. Both lipoprotein concentration polarization and flow field changes are involved in the infiltration/accumulation of atherogenic lipids within the location of arterial luminal surface and promote the development of AS.
Keywords: atherosclerosis, concentration polarization, flow field, low-density lipoprotein, zebrafish
1. Introduction
Atherosclerosis (AS) usually starts at the curves, branches and narrow areas of arteries. To date, several theories have been proposed on the pathogenesis of AS, including inflammation, lipid infiltration and response-to-injury theories. However, these theories cannot fully explain the localization of atherogenesis. AS commonly occurs in the regions of arterial trees with haemodynamic peculiarities, including local disturbances of flow field in space and formation of swirling flow and vortices [1–4]. Concentration of low-density lipoprotein (LDL) across the arterial luminal surface is a critical step in AS development [5–7]. Flow field changes significantly affect the accumulation and distribution of LDL, and regional variations in flow field may thus contribute to the localization of AS [8–13].
A haemodynamic hypothesis [14] was proposed based on studies involving numerical simulation and measurement of the luminal surface concentration of LDL in vitro to better explain the localization of AS [14–16]. The hypothesis assumes that infiltration of blood vessel wall results in a higher concentration of atherogenic lipids at the luminal surface than that in the bulk, which is a concept well known in engineering. The atherogenic lipid concentration at the luminal surface may vary according to location in the arterial tree because of regional differences in the near-wall blood flow velocity, blood pressure and vascular permeability. The luminal surface concentrations of atherogenic lipids in the low-speed blood flow, disturbed flow and low shear stress regions are much higher than that in the high-speed laminar flow region. High LDL concentrations could damage the functions of endothelial cells and influence the biological behaviours of smooth muscle cells and monocytes. The haemodynamic hypothesis provides a new perspective for studies on the localization and pathogenesis of AS.
Several recent studies involving numerical simulations [17,18] or in vitro experiments [19,20] indicate that polarization of LDL concentration is indeed present in the vascular system. However, all the studies published to date have been limited to numerical simulations in computers and in vitro experimental methods, and have not reported the phenomenon of lipoprotein concentration polarization by real-time and quantitative methods in vivo. Furthermore, the effects of such polarization of LDL concentration and changes in flow field on AS were not investigated in vivo, thus limiting the significance of the results. Additionally, no systematic in-depth study about the relationship between lipoprotein concentration polarization and development of AS has been conducted.
Zebrafish are commonly used as animal models because of their relatively low-cost maintenance, rapid development and ease of genetic manipulation. Moreover, the optical transparency of the developing fish, together with the availability of sophisticated imaging techniques, enables direct visualization of complex phenomena at the whole organism level. Recently, zebrafish have emerged as a powerful tool for cardiovascular research and in vivo investigations of lipoprotein biology [21–24]. Here, we further investigated the validity of the haemodynamic hypothesis by observing polarization of LDL concentration in vivo in zebrafish, using laser scanning confocal microscopy (LSCM). A controllable animal model of rabbit was established [25,26] to study the effects of flow field changes and LDL concentration polarization on the development of AS via flow field surveys and pathology detection. Our findings further support the haemodynamic hypothesis and provide experimental evidence of AS pathogenesis.
2. Material and methods
2.1. Animals
The animal housing and surgical procedures were in accordance with the Guide for the Chinese Animal Care and Use Committee Standards, which conforms to the Guide for the Care and Use of Laboratory Animals published by the US National Institutes of Health (NIH publication no. 85-23, revised in 1996). All animal procedures were also performed in accordance with protocols approved by the Animal Ethics Committee of Chongqing University. NIH guidelines for the care and use of laboratory animals (NIH publication no. 85-23, revised in 1985) were observed.
2.1.1. Zebrafish
Flk1: green fluorescent protein zebrafish (Flk1: GFP), in which endothelial cells express GFP, were provided by the Developmental Biology Laboratory at Tsinghua University, PR China. The UCSD Institutional Animal Care and Use Committee approved our protocol for zebrafish maintenance and experimental procedures. To study the distribution of lipoprotein in vascular lumen, 1,1′-dioctadecyl-3,3,3′,3′-tetramethyl-indocarbocyanine perchlorate–LDL (DiI–LDL, 200 μg ml−1) purchased from Biomedical Technologies Inc. (USA) [22,27,28] was used. DiI–LDL was injected into Flk1: GFP embryo blood circulating at 48 hours post-fertilization (h.p.f.) (n = 60) via microinjection. The control group was injected with phosphate-buffered saline (PBS). The injection site is displayed in figure 1. The zebrafish embryos were anaesthetized (short exposure to 0.02% Tricaine), awakened using fresh water, and then released in the fish tank. The fishes were euthanized via prolonged exposure to 0.02 per cent Tricaine.
Figure 1.

Diagram of the injection and imaging sites. The zebrafish (2.5 days post-fertilization) vasculature diagram is from Isogai et al. [29].
2.1.2. Rabbits
Forty-eight New Zealand white rabbits were provided by the Animal Laboratory Centre of Chongqing Medical University, PR China. A local vascular stenosis model was generated by performing gel-silica pipe ring surgery on rabbit carotid arteries based on our previously published method [25]. This was carried out to further test the effect of LDL concentration polarization and flow field changes on the development and localization of AS. Rabbits received premedication using intramuscular fentanyl/fluanizone, 0.3–0.4 ml kg−1 (Hypnorm, Jansen). Anaesthesia was induced with midazolam (0.2–0.4 ml kg−1) and, following intubation, was maintained with a mixture of nitrous oxide, oxygen (1 : 1 ratio) and 1 per cent halothane. When their lash reflex disappeared, they were fixed on their back, and the hair around their neck was removed and antisepticised normally. A 4 cm long cut was made along the midline of the neck between the thyroid and the breastbone, and the subcutaneous tissue and neck muscles were removed layer by layer. The trachea was then exposed, and the midpiece of the left common carotid artery (LCCA) was separated from the left carotid sheath by about 2 cm. The LCCA was then covered with an 8 mm long segment of medical gel-silica pipe (with stenosis degree of 40%). Surgical silk thread was used for ligation, and the right common carotid artery without gel-silica pipe was used as a sham operation control.
Post-operative analgesia (buprenorphine 0.3 mg kg−1) was administered every 8 h for the first 24–48 h, together with broad-spectrum antibiotics. Each experimental group was fed with different cholesterol concentrations: rabbits in the stenosis group (n = 24) were fed (150 g every day for two months) with either a normal (n = 12) or high-fat diet (with 1% cholesterol (Sigma) and 5% lard in normal diet) (n = 12), and those in the control group (n = 24) were fed (150 g every day for two months) with either a normal (n = 12) or high-fat diet (with 1% cholesterol (Sigma) and 5% lard in normal diet) (n = 12) to produce varying LDL concentrations in the blood. The normal and high-fat diets for the rabbits were provided by the Animal Laboratory Center of Chongqing Medical University.
2.2. Fluorescence analyses
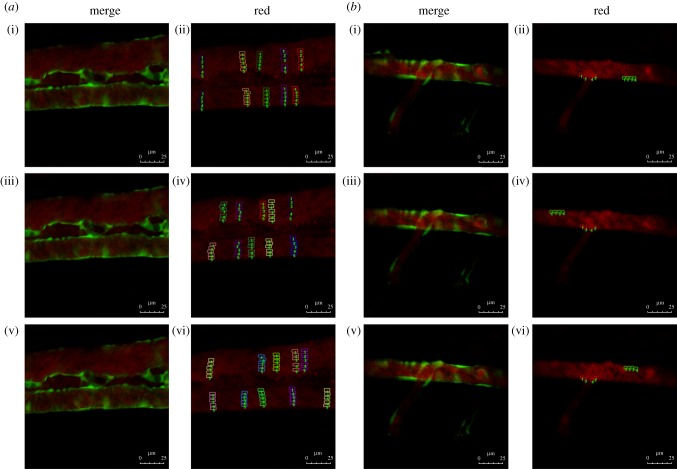
The images used for fluorescence analysis were randomly obtained from the electronic supplementary material, movies S1 and S3. Samples were collected from luminal surfaces to the centre of blood vessels at five different locations (different colours to distinguish) in every random image (figure 2). The intensity of red fluorescence at different locations of vascular lumen was analysed using Image-Pro Plus v. 6.0 software (Media Cybernetics).
Figure 2.
Red fluorescence intensity analysis. Flk1: GFP embryos at 52 h.p.f.; embryos injected with Dil-LDL at 48 h.p.f. (n = 56/60); endothelial cells are green and Dil-LDL is red. (a) Red fluorescence intensity analysis in straight vascular segments. (i,iii,v) Stills from three time points ((i) t = 0, (iii) t = 2.22 and (v) t = 8.88 s) in electronic supplementary material, movie S1. (ii,iv,vi) Fluorescence intensity analysis chart; the small lattice marks the sample taken at the three time points. (b) Red fluorescence intensity analysis of the vascular bifurcation region. (i,iii,v) Stills from three time points ((i) t = 1.674, (iii) t = 2.511 and (v) t = 13.671 s) in electronic supplementary material, movie S3. (ii,iv,vi) Fluorescence intensity analysis chart; the small lattice marks the sample taken at the three time points.
2.3. Flow field determinations
2.3.1. Local stenosis flow field numerical simulation
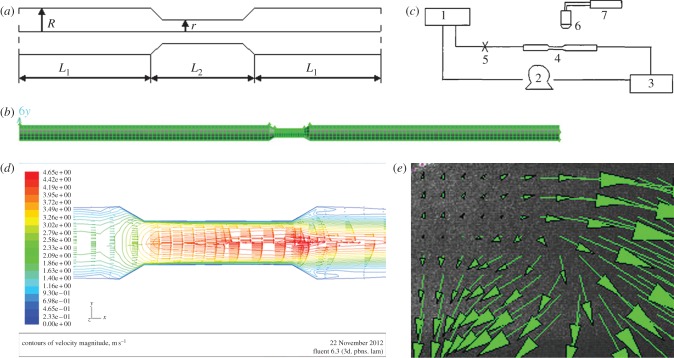
A geometric model of local stenosis arteries was established (figure 3a), and the governing equations and boundary condition were created. It is assumed that the vessel wall is rigid, and blood is an incompressible Newtonian fluid with viscosity: μ = 3.5 mPa s−1, blood density: ρ = 1.05 × 10³ kg m−3. Under these assumptions, the Navier–Stokes equations of steady flow are
| 2.1 |
and
| 2.2 |
where  is the gradient of the blood pressure,
  is the divergence of the velocity and
  is the vector Laplace operator of u.
Figure 3.
Analysis of flow field in the vascular stenosis region. (a) Schematic showing the geometric model of local stenosis arteries. The stenosis vessel segment is an axisymmetric tube. r (0.075 cm) is the diameter of the stenosis blood vessel section, R (0.125 cm) is the diameter of the straight blood vessel sections. (R−r)/R represents the degree of stenosis (40%), L2 (0.8 cm) and L1 (5 cm) represent lengths of the different sections. (b) Three-dimensional model of a stenotic blood vessel and mesh dividing. (c) Schematic illustrating the PIV system. (d,e) Distribution of flow field in the vascular stenosis region determined via (d) simulation and (e) PIV determination.
Boundary condition:
| 2.3 |
where u, v, w are the velocity vectors in the x-, y- and z-direction, respectively, u0 is the entrance speed, r is the diameter of stenosis blood vessel section and R is the diameter of straight blood vessel sections.
Then, a three-dimensional model of a stenotic blood vessel (with stenosis degree of 40%) was established using Gambit software. The diameter of the vessel inlet was 0.25 cm with same diameter as that of a rabbit carotid artery (figure 3a). The three-dimensional model was meshed in 49 680 units using Gambit software, and the result of model meshing was saved in mesh format (figure 3b). The Fluent software could set the boundary conditions and simulate flow field when the graph of mesh was imported.
2.3.2. Determination of particle image velocimetry of local stenosis flow field
Particle image velocimetry (PIV) flow field test technology has been applied to successfully study different cardiovascular flow field models, including the vascular bifurcation model [30]. In this study, Plexiglass material with 1 mm thick walls was used to produce a model of a stenotic blood vessel (with stenosis degree of 40%). The diameter of straight sections of the circular tube was 10 mm, and that of the stenosis section was 5 mm. The length of the stenosis section was 8 mm, whereas the Reynolds number (Re) was 500. Pulse laser power was 120 mJ per pulse. CCD resolution was 2048 × 2048, and pixel dimensions were 7 × 7 μm.
Set-up of the PIV system (figure 3c): in order to keep the fluid physical properties and flow field tracer particle concentration stable during the experiment, circulating water was used. System water flow rate was controlled by upstream and downstream water tank levels. Water flowed into the downstream tank and mixed with water in the upstream tank with the help of a peristaltic pump. The PIV light source was calibrated to make the light source through the horizontal plane of central axis in tube. The PIV camera was fixed on the top of the collection points. Image of stenosis section was collected 30 min after a stable cycle by controlling the pulse frequency of the light sheet and sampling frequency of the camera. The results were then analysed using image processing software.
2.4. Lipid analyses
Blood (1 ml) was drawn from the veins around the ears of the rabbits at two months after surgery and immediately diluted in 5 ml ice-cold PBS–ethylenediaminetetraacetic acid (Versene from Invitrogen). After centrifugation, 1 : 10 diluted plasma was collected and used for analysis. Low-density lipoprotein cholesterol (LDLC) was detected using the fully automatic biochemistry analyser Sapphire 600 at Chongqing University Hospital.
Rabbits were sacrificed at two months after surgery by venous injection of an overdose of sodium pentobarbital solution. A portion of the arterial tissue was used for cholesterol analysis, and the remainder was taken for histological analysis. The arterial tissue was ground on ice and homogenized, and its protein content was determined. An equal volume of fresh 15 per cent alcohol-soluble potassium hydroxide was added in arterial tissue slurry, and it was shocked until the cell lysate was clear. The protein component was removed after adding 6 per cent trichloroacetic acid, and an equal volume of hexane–isopropanol (solution volume ratio is 4 : 1) was added in this solution, then upper organic phase was collected after centrifugation (15 000g for 5 min at 4°C). The solution of upper organic phase was treated by vacuum freeze drying for 90 min at 65°C, and 0.1 ml of mobile phase was added in the solution when it is cooling at room temperature, then supernatant was collected after centrifugation (15 000g for 5 min at 4°C). The cholesterol content of the arterial wall was measured by high performance liquid chromatography.
2.5. Histology
The arterial tissue samples were subsequently fixed in 4 per cent Zn–formalin for 2 days at 4°C, decalcified in 0.5 mol l−1 PBS–EDTA for 7 days at 4°C, then gradually equilibrated with 25 per cent sucrose in PBS, ending in 100 per cent optimal cutting temperature compound, and finally frozen using dry ice and isopropanol. Ten micrometre serial sections were collected and kept at −80°C, then stained with Oil red O to analyse lipoprotein accumulation in the rabbit carotid artery. The tissues were paraffin-embedded, sectioned, deparaffinized and stained. Sections stained with hematoxylin–eosin and Verhoeff and Van Giesom (Sigma) were respectively used to assess the pathology and elastic fibres of the rabbit carotid artery. All the sections were observed under an optical microscope.
2.6. Laser scanning confocal microscopy
The rabbit carotid artery was isolated, hyalinized [31] and then perfused with media containing DiI–LDL. The LDL concentration distribution in the artery was measured using an LSCM along the z-axis to determine the polarization of LDL concentration in the vascular system. To observe LDL distribution and deposits in vivo using a confocal microscope, zebrafish embryos were fixed with 1.5 per cent low melting agarose to maintain normal blood circulation. A Leica confocal microscope (SP5) was used to screen LDL mobility in straight and bifurcate vascular segments. Images of embryos were acquired in one- or two-channel modes (figure 4a). The excitation wavelengths were 488 and 561 nm for the green and red channels, respectively. A 10× objective was used to record the movies with each frame capturing a focal plane of 512 × 512 square pixels. The imaging sites are displayed in figure 1.
Figure 4.
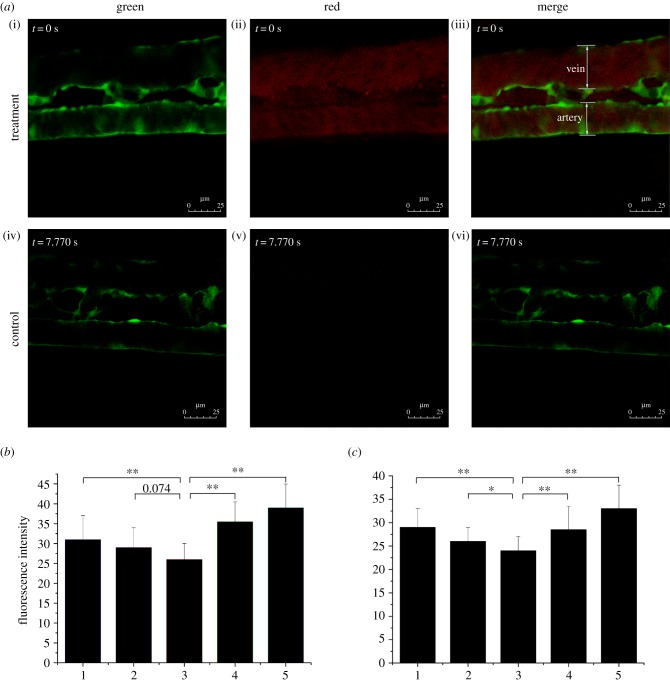
LDL concentration polarization in the vascular system. (a) Flk1: GFP embryos at 52 h.p.f.; stills from electronic supplementary material, movies S1 and S2; (i–iii) embryos injected with DiI–LDL at 48 h.p.f. (n = 56/60) and (iv–vi) control (n = 58/60); endothelial cells are green; DiI–LDL is red. (b,c) Red fluorescence intensity of (b) a vein and (c) an artery. Number 1 to 5 indicates the sample location in the vessel (figure 2a (ii,iv,vi)): 1 and 5 are the luminal surfaces of the blood vessel; 2 and 4 are between the luminal surface and centre of the blood vessel; and 3 is the centre of the blood vessel (*p < 0.05; **p < 0.01).
2.7. Statistical analysis
Data in the graphs are presented as means ± s.e. Statistical differences between experimental groups were evaluated using one-way ANOVA followed by Student's t-test (*p < 0.05 and **p < 0.01).
3. Results
3.1. Low-density lipoprotein concentration distribution in straight vascular segments
Previous studies have proved via numerical simulations that lipoprotein concentration polarization exists [15,16]. Measurement of LDL concentration distribution along the z-axis of the rabbit carotid artery in vitro using LSCM showed that the luminal surface concentration of LDL was higher than that in the bulk (figure 5). LDL concentration polarization in vivo was further confirmed by injecting DiI–LDL into Flk1: GFP embryo blood circulating at 48 h.p.f. Fluorescence distribution was observed using LSCM at 52 h.p.f. (see the electronic supplementary material, movies S1 and S2; figures 1 and 4a). The presence of mobile red particles in the injection group indicated LDL distribution in zebrafish vessels (figure 4a(i)–(iii)), which was invisible in the control (figure 4a(iv)–(vi)). Quantitative measurements of red fluorescence intensity revealed that LDL concentration exhibited a gradient distribution from the blood vessel wall to the axis both in the arteries (figures 4b and 2a) and the veins (figures 4c and 2a). These results provide strong evidence of the existence of LDL concentration polarization in the vascular system.
Figure 5.
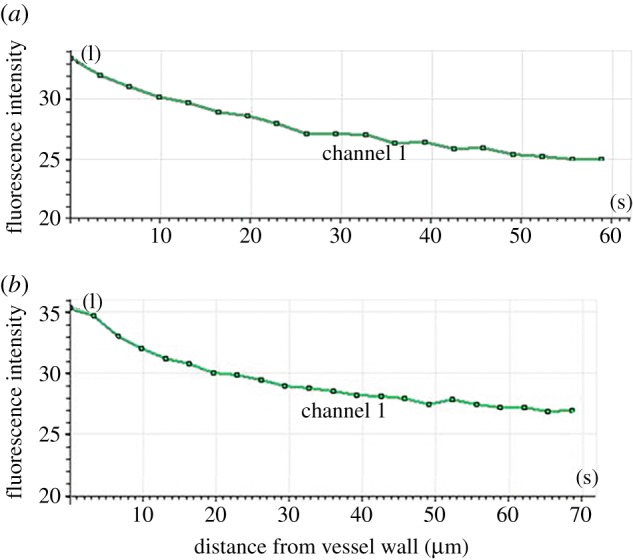
LDL distribution on the y-axis of the rabbit carotid artery as determined by LSCM. The hyalinized rabbit carotid artery was perfused with medium containing DiI–LDL. The distribution of LDL concentration in the artery was measured along the z-axis using LSCM. (a) Half (cupular part) and (b) the other half (basal part) of the blood vessels in the analysis chart.
3.2. Flow field in stenosis and low-density lipoprotein concentration distribution in bifurcations
Flow field alterations caused by vascular geometry changes significantly affect LDL concentration distribution [8,9]. Previous research showed that the flow field disturbance occurred at bifurcation vessel section [32]. To further determine whether the disturbance of flow field presented in stenosis vessel section, a stenotic vascular model was established using Gambit software (figure 3b), and a flow field was simulated using Fluent software. Our numerical simulation results showed that flow field remained unchanged at the straight vessel section. However, flow field changed rapidly at the entry point of the stenosis vessel section, and significant disturbance in the flow field and vortices was observed in the stenosis vessel section (figure 3d). The flow field of the stenotic vascular region was measured in vitro using PIV (figure 3e). The results showed obvious flow field disturbances and formation of local swirling flow regions, distinct vortices and secondary flows in the region of vascular geometry changes. According to the haemodynamic hypothesis [15,16], lipoprotein concentration on the luminal surface is not necessarily uniform because of lipoprotein concentration polarization and regional flow field changes in the vascular system. To support this hypothesis, DiI–LDL was injected into Flk1: GFP embryos blood circulating at 48 h.p.f. and LDL fluorescence distribution was observed using LSCM at 52 h.p.f. (see the electronic supplementary material, movie S3; figures 1 and 6a). Quantitative measurements of red fluorescence intensity revealed that LDL concentration at the luminal surface of bifurcation was significantly higher than that at the straight surface (figures 6b and 2b). These results demonstrate that LDL concentration at the luminal surface in which the flow field altered drastically was significantly higher than that in the straight vascular segment. The majority of lipid deposits were observed in the caudal vein at 72 h.p.f. (figures 7 and 1); at the same site the LDL permeated into sub-endothelial of caudal vein seriously (figure 7, arrow).
Figure 6.
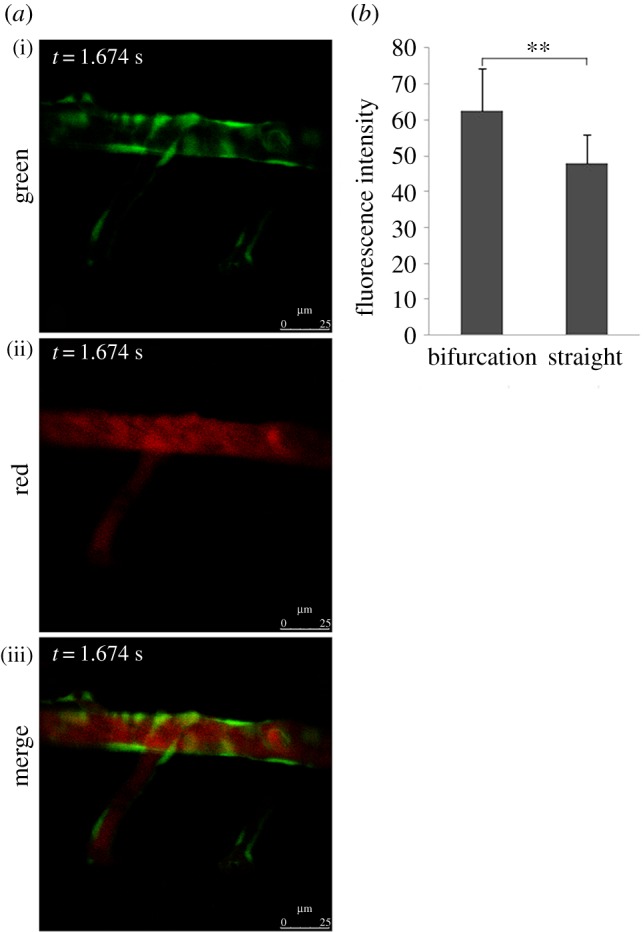
LDL concentration of vascular luminal surface at the bifurcation point was significantly higher than that in straight segments. (a) Flk1: GFP embryos at 52 h.p.f.; stills from electronic supplementary material, movie S3; embryos injected with DiI–LDL at 48 h.p.f. (n = 56/60); endothelial cells are green and DiI–LDL is red. (b) Statistical analysis of red fluorescence intensity. The location of the sample in the vessel is shown in figure 2b (ii,iv,vi); **p < 0.01.
Figure 7.
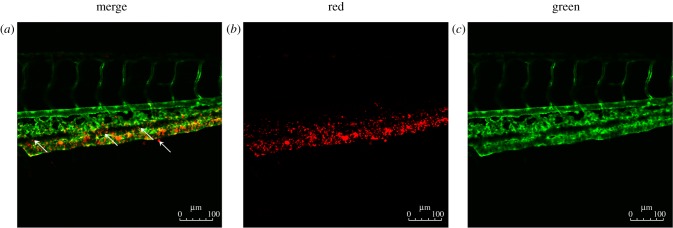
LDL accumulation and permeation in the vascular system. (a–c) Flk1: GFP embryos at 72 h.p.f.; embryos injected with Dil-LDL at 48 h.p.f. (n = 56/60); endothelial cells are green and Dil-LDL is red. Arrow denotes location of LDL permeation.
3.3. Vascular lipid accumulation in rabbit carotid arteries
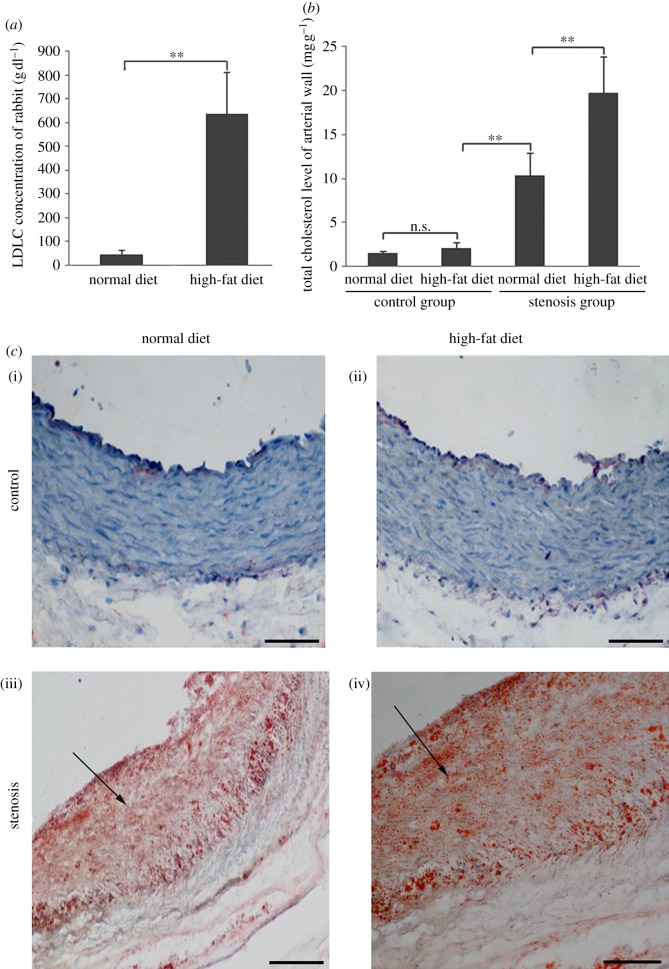
Our results indicated that LDL concentration polarization and flow field could cause the LDL concentration to increase locally in rabbit carotid arteries. The LDLC concentration of rabbits on high-fat diet was notably higher than of those on normal diet in the control group (figure 8a). Significant lipid accumulation was found in both normal and high-fat diet-fed stenosis groups (figure 8c(iii)(iv)), although changes were more obvious in the stenosis group fed with a high-fat diet (figure 8c(iv)). No lipid accumulation was observed in the control group (figure 8c(i)(ii)). The total cholesterol content of the vessel wall was also measured. The cholesterol content in the stenosis group was markedly higher than in the control group, and the amount of cholesterol in the stenosis group fed with a high-fat diet was significantly higher than that fed with a normal diet (figure 8b).
Figure 8.
Hypercholesterolemia and lipid accumulation in rabbits. Forty-eight New Zealand white rabbits (both male and female) were operated on to generate the stenosis model of a local blood vessel (stenosis group, n = 24). Rabbits in the control group did not undergo any operation (control group, n = 24). The stenosis and control group animals were fed either a normal diet or high-fat diet separately for two months. (a) Serum LDLC concentration of rabbit after two months (n = 24 in each group, both male and female; **p < 0.01). (b) Total cholesterol level of rabbit arterial wall after two months (n = 12 in each group, both male and female; **p < 0.01). (c) Oil red O staining for lipid accumulation in the rabbit carotid artery. Control group with a (i) normal and (ii) high-fat diet for two months. Stenosis group with a (iii) normal and (iv) high-fat diet for two months. Scale bars, (i–iv) 20 μm.
3.4. Vascular lesions in rabbit carotid arteries
Pathological sections of rabbit carotid arteries were observed. The results showed conspicuous pathological changes in the stenosis group (figure 9b(iii)(iv)) but not in the control group (figure 9b(i)(ii)); significant changes were observed in the stenosis group with high-fat diet (figure 9b(iv)). In addition, the elastic fibres were disorganized and some of the internal elastic plates were broken in the stenosis group (figure 9c(iii)(iv)), especially in those on high-fat diet (figure 9c(iv)). However, the elastic fibres were neatly arranged in the control group (figure 9c(i)(ii)). Finally, changes in the diameter of the rabbit carotid artery were assayed. The diameter in the stenosis group was conspicuously larger than that in the control group and more apparent in the stenosis group with high-fat diet (figure 9a). These results suggested that hyperlipidaemia mainly facilitated the development of AS, whereas LDL concentration polarization and flow field changes played crucial roles in the development and localization of AS.
Figure 9.
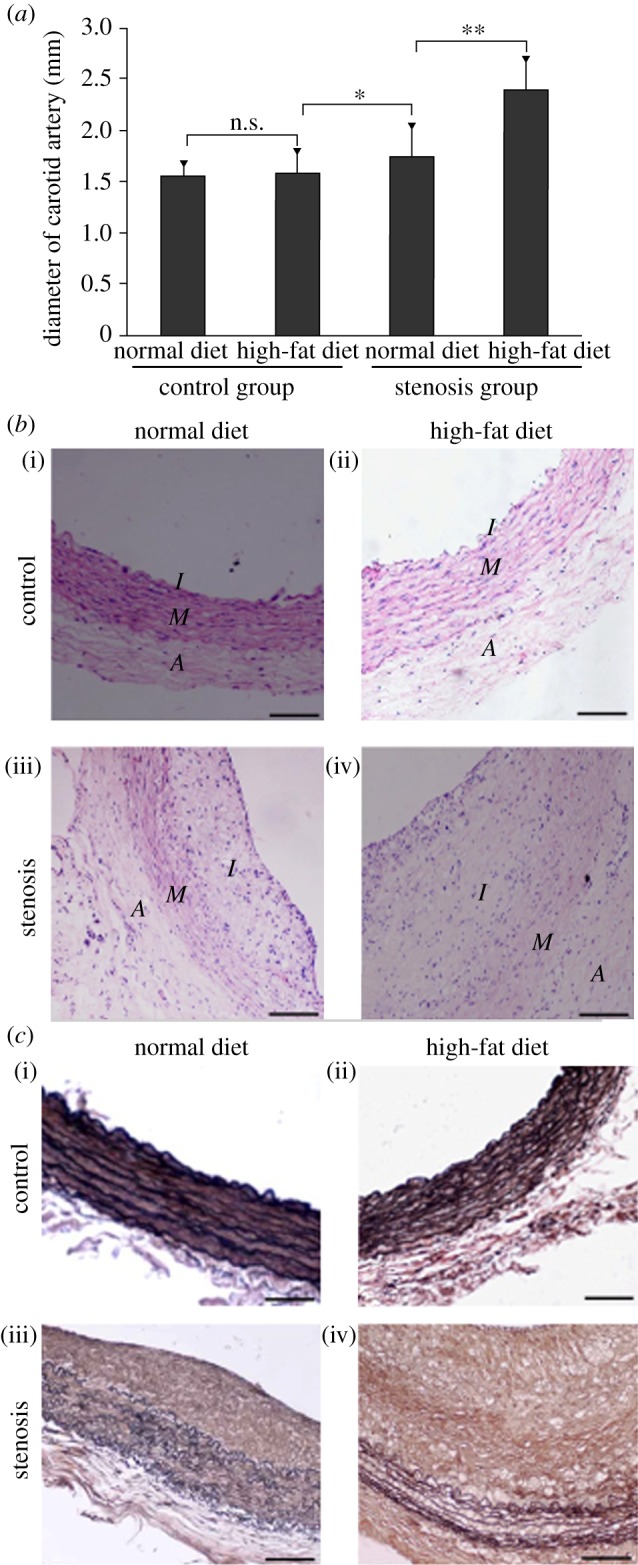
LDL concentration polarization and flow promote atherogenesis. Forty-eight New Zealand white rabbits (male and female) were operated on to generate the stenosis model of local blood vessels (stenosis group, n = 24). Rabbits in the control group did not undergo any operation (control group, n = 24). The stenosis and control group animals were then fed with either a normal or high-fat diet separately for two months. (a) Rabbit carotid artery diameter (*p < 0.05; **p < 0.01). (b) Pathological section of the rabbit carotid artery. Control group with (i) normal and (ii) high-fat diet for two months; stenosis group with (iii) normal and (iv) high-fat diet for two months. Scale bars, (i–iv) 20 µm. (c) Elastic fibrin of the rabbit common carotid artery. Control group with (i) normal and (ii) high-fat diet for two months; stenosis group with (iii) normal and (iv) high-fat diet for two months. Scale bars, (i–iv) 20 μm.
4. Discussion
Studies on cardiovascular diseases, including the pathogenesis of AS, have been given considerable attention in recent years. Autopsy findings have demonstrated branches, curves and stenotic parts with complex geometric configurations in the vasculature, called ‘atherosclerotic localizations’, that are highly susceptible to AS. These AS localizations are closely associated with alteration of haemodynamic forces [1–4]. Abnormality in the flow field is an important factor contributing to atherosclerotic lesions. Lipoprotein concentration polarization and flow field changes appear to lead to the alteration of atherogenic lipid transportation across the arterial luminal surface, causing vascular diseases such as lipoprotein deposition, blood platelet accumulation and intima thickening.
Previous in vitro studies have shown that LDL concentration polarization exists in the vascular system [17–20,33–36]. In our study, the transparent segment of the rabbit carotid artery was vertically scanned along the z-axis using the computed tomography scanning capability of LSCM. Our results indicated that the LDL concentration at the luminal surface was higher than that in the bulk. DiI–LDL was injected into the circulatory system of the Flk1: GFP zebrafish embryo, after which its distribution in the vessel was observed via LSCM. Our findings indicate that LDL concentration polarization exists in the vascular system in vivo. This is the first report of the occurrence of LDL concentration polarization in the vascular system in vivo, and provides a new perspective for lipid studies in vivo.
Because the cardiovascular system is a non-homogeneous and complex circulating system, the existence of LDL concentration polarization in the vascular system can be explained not only by the semi-permeable nature of endothelium to macromolecules, but also by particle–particle interaction [37–39] and haemodynamics action. Possible mechanisms of particle–particle interaction as it applies to platelets include exclusion- and shear-induced mixing [37,40]. The exclusion mechanism refers to the displacement of platelets towards the wall by red blood cells (RBCs) as they migrate towards the vessel centreline—a phenomenon which is typically observed in blood vessels and microchannels narrower than 300 µm. The shear-induced mixing mechanism refers to local enhancement of LDL diffusivity caused by the rotation and random motion of RBCs in the shear field. Haemodynamics action refers to the fact that the main mode of flow inside blood vessels is shear flow and velocity distribution along the tube cross section appears like a parabola: velocity along the vessel wall surface is zero and is maximal at the centre of the vessel [41,42]. Because the vessel wall surface is not completely smooth, LDL can be slowed down close to the wall surface, which contributes to a certain degree to LDL concentration polarization [43]. In summary, the existence of LDL concentration polarization in the vascular system may be caused by the mutual effects of the semi-permeable nature of the endothelium, particle–particle interaction and haemodynamics action.
It was shown that very high concentrations of LDL exist in the recirculation zone of distal vascular stenosis through computer simulations and semi-permeable membrane experiments [44]. Numerical simulations of PIV determination of flow field conditions of the stenosis vessels were carried out, and the results were coincident with the previous bifurcation vessel section research [32]. Significant flow field disturbances, distinct vortices and swirling flow were observed in the regions of vascular geometry changes. High incidence of stagnation occurs at locations where vortices form, resulting in deposition of LDL carried by blood flow. Additionally, we also found that the LDL concentration at the luminal surface of bifurcation was notably higher than that in the straight segment in vivo. There are two possible mechanisms that could increase LDL uptake into the vessel wall of branches, curves, and stenotic parts with significant flow field changes and contribute to the localization of AS. One is concentration polarization of LDL, which could be caused by the mutual effects of the semi-permeable nature of endothelium, particle–particle interaction and haemodynamics action, and the other is an increase in permeability of LDL passing through the endothelium in response to the wall shear stress induced by significant flow field disturbances [45,46]. Together, these results suggest that both LDL concentration polarization present in the vascular system in vivo and flow field changes lead to significantly increased LDL concentration; in animals with markedly altered vascular geometry, this results in the penetration and deposition of LDL in the local regions.
The majority of lipid deposits were observed in the caudal vein, and LDL permeated into sub-endothelium at the same regions of caudal veins in zebrafish embryos. The presence of lipid deposits in the veins can be explained by huge changes in vascular geometry and the fact that at this stage of development, large arteries and veins connect directly, not via a capillary network, in the zebrafish circulatory system. In adult zebrafish, lesions were found only in the dorsal aorta but not in the caudal vein [22]. Why do atherosclerotic diseases occur only in the arteries? Several recent studies on the relationship between flow field and AS have found that flow field changes not only exist in arteries but also in veins. Therefore, this phenomenon is not explained fully by the effect of wall shear stress on endothelial cells. However, this phenomenon can be easily explained by several points derived from the theory of mass transport. First, lipid can penetrate the artery vessel wall more easily because it is a high-pressure system. Second, lipid is easily retarded in the artery wall because the artery wall is thick, and it cannot easily permeate out of the wall, and cannot be easily discharged by the lymphatic system that can blow down foreign matter in the adventitia of the artery wall. Conversely, the vein is a low-pressure system with very thin walls, and lipids easily permeate out of the artery wall and can be discharged easily by the lymphatic system. Thus, the phenomenon of atherosclerotic diseases occurring only in arteries can be explained by the theory of mass transport.
A gel-silica pipe was set on the rabbit carotid artery straight segment to generate a stenosis model of the local blood vessel. This was carried out to further examine the effect of LDL concentration polarization and flow field changes on the development and localization of AS. Although the serum LDL cholesterol in the high-fat diet group was significantly higher than that in the normal diet group, atherosclerotic plaque only formed in the stenosis group. Additionally, intimal thickening, limitations of vascular lumen and increases in cholesterol concentration were observed in the stenosis group, much like in human atherosclerotic lesions.
This study elucidates LDL concentration polarization and flow field changes in relation to AS development and localization. LDL concentration polarization and modification of flow field may result in LDL concentrations at the luminal surface where vascular geometry changes more significantly than in straight segments. Local accumulation of LDL increases the opportunities for contact with the vascular wall, making the penetration and deposition of LDL multiplicative, affecting the permeability of endothelial cells, and inducing intimal hyperplasia and atherosclerotic plaque formation and development. These findings can provide important theoretical guidance and beneficial biophysical insights into AS prevention and treatment.
Acknowledgements
This study was supported by grants from the National Key Basic Research Program of China (2012CB945101), the National Key Technology R&D Program of China (2012BAI18B02) and the National Natural Science Foundation of China (30970721, 30901977) as well as the Public Experiment Center of State Bioindustrial Base (Chongqing), PR China. We thank Dr Lingfei Luo's laboratory at Southwest University, China for kindly providing the laser scanning confocal microscope and partial experimental support. We are very grateful to Dr Anming Meng's laboratory at Tsinghua University, China for providing the zebrafish and partial experimental support. Critical revision of the article from Dr Chengtian Zhao at Tufts University, USA is also appreciated.
References
- 1.Bassiouny HS, Zarins CK, Kadowaki MH, Glagov S. 1994. Hemodynamic stress and experimental aortoiliac atherosclerosis. J. Vasc. Surg. 19, 426–434 10.1001/jama.282.21.2035 (doi:10.1001/jama.282.21.2035) [DOI] [PubMed] [Google Scholar]
- 2.Moore JE, Jr, Ku DN, Zarins CK, Glagov S. 1992. Pulsatile flow visualization in the abdominal aorta under differing physiologic conditions: implications for increased susceptibility to atherosclerosis. J. Biomech. Eng. 114, 391–397 10.1115/1.2891400 (doi:10.1115/1.2891400) [DOI] [PubMed] [Google Scholar]
- 3.Ku DN, Giddens DP, Zarins CK, Glagov S. 1985. Pulsatile flow and atherosclerosis in the human carotid bifurcation. Positive correlation between plaque location and low oscillating shear stress. Arteriosclerosis 5, 293–302 10.1161/01.ATV.5.3.293 (doi:10.1161/01.ATV.5.3.293) [DOI] [PubMed] [Google Scholar]
- 4.Giddens DP, Zarins CK, Glagov S. 1993. The role of fluid mechanics in the localization and detection of atherosclerosis. J. Biomech. Eng. 115, 588–594 10.1115/1.2895545 (doi:10.1115/1.2895545) [DOI] [PubMed] [Google Scholar]
- 5.Hong L, Alan D. 2009. Atherosclerosis: cell biology and lipoproteins. Curr. Opin. Lipidol. 20, 528–529 10.1097/mol.0b013e328332c3bc (doi:10.1097/mol.0b013e328332c3bc) [DOI] [PubMed] [Google Scholar]
- 6.Delles C, et al. 2010. Reduced LDL-cholesterol levels in patients with coronary artery disease are paralelled by improved endothelial function: an observational study in patients from 2003 and 2007. Atherosclerosis 211, 271–277 10.1016/j.atherosclerosis.2010.01.014 (doi:10.1016/j.atherosclerosis.2010.01.014) [DOI] [PMC free article] [PubMed] [Google Scholar]
- 7.Cui Y, Watson DJ, Girman CJ, Shapiro DR, Gotto AM, Hiserote P, Clearfield MB. 2009. Effects of increasing high-density lipoprotein cholesterol and decreasing low-density lipoprotein cholesterol on the incidence of first acute coronary events (from the Air Force/Texas Coronary Atherosclerosis Prevention Study). Am. J. Cardiol. 104, 829–834 10.1016/j.amjcard.2009.05.020 (doi:10.1016/j.amjcard.2009.05.020) [DOI] [PubMed] [Google Scholar]
- 8.Soulis J, Giannoglou G, Dimitrakopoulou M, Papaioannou V, Logothetides S, Mikhailidis D. 2009. Influence of oscillating flow on LDL transport and wall shear stress in the normal aortic arch. Open Cardiovasc. Med. J. 3, 128–142 10.2174/1874192400903010128 (doi:10.2174/1874192400903010128) [DOI] [PMC free article] [PubMed] [Google Scholar]
- 9.Soulis JV, Giannoglou GD, Papaioannou V, Parcharidis GE, Louridas GE. 2008. Low-density lipoprotein concentration in the normal left coronary artery tree. Biomed. Eng. Online 7, 26. 10.1186/1475-925X-7-26 (doi:10.1186/1475-925X-7-26) [DOI] [PMC free article] [PubMed] [Google Scholar]
- 10.Soulis JV, Fytanidis DK, Papaioannou VC, Giannoglou GD. 2010. Wall shear stress on LDL accumulation in human RCAs. Med. Eng. Phys. 32, 867–877 10.1016/j.medengphy.2010.05.011 (doi:10.1016/j.medengphy.2010.05.011) [DOI] [PubMed] [Google Scholar]
- 11.Liu X, Pu F, Fan Y, Deng X, Li D, Li S. 2009. A numerical study on the flow of blood and the transport of LDL in the human aorta: the physiological significance of the helical flow in the aortic arch. Am. J. Physiol. Heart Circ. Physiol. 297, H163–H170 10.1152/ajpheart.00266.2009 (doi:10.1152/ajpheart.00266.2009) [DOI] [PubMed] [Google Scholar]
- 12.Ding Z, Fan Y, Deng X, Sun A, Kang H. 2010. 3,3′-Dioctadecylindocarbocyanine-low-density lipoprotein uptake and flow patterns in the rabbit aorta-iliac bifurcation under three perfusion flow conditions. Exp. Biol. Med. 235, 1062–1071 10.1258/ebm.2010.010035 (doi:10.1258/ebm.2010.010035) [DOI] [PubMed] [Google Scholar]
- 13.Zhou YQ, Zhu SN, Foster FS, Cybulsky MI, Henkelman RM. 2010. Aortic regurgitation dramatically alters the distribution of atherosclerotic lesions and enhances atherogenesis in mice. Arterioscler. Thromb. Vasc. Biol. 30, 1181–1188 10.1161/ATVBAHA.110.204198 (doi:10.1161/ATVBAHA.110.204198) [DOI] [PubMed] [Google Scholar]
- 14.Deng XY, Wang GX. 2003. Concentration polarization of atherogenic lipids in the arterial system. Sci. China C, Life Sci. 46, 153–164 10.1360/03yc9017 (doi:10.1360/03yc9017) [DOI] [PubMed] [Google Scholar]
- 15.Wang GX, Deng XY, Guidoin R. 2003. Concentration polarization of macromolecules in canine carotid arteries and its implication for the localization of atherogenesis. J. Biomech. 36, 45–51 10.1016/S0021-9290(02)0027 (doi:10.1016/S0021-9290(02)0027) [DOI] [PubMed] [Google Scholar]
- 16.Deng XY, Marois Y, How T, Merhi Y, King M, Guidoin R, Karino T. 1995. Luminal surface concentration of lipoprotein (LDL) and its effect on the wall uptake of cholesterol by canine carotid arteries. J. Vasc. Surg. 21, 135–145 10.1016/S0741-5214(95)70252-0 (doi:10.1016/S0741-5214(95)70252-0) [DOI] [PubMed] [Google Scholar]
- 17.Hong J, Wei L, Fu C, Tan W. 2008. Blood flow and macromolecular transport in complex blood vessels. Clin. Biomech. 23, S125–S129 10.1016/j.clinbiomech.2007.07.006 (doi:10.1016/j.clinbiomech.2007.07.006) [DOI] [PubMed] [Google Scholar]
- 18.Wada S, Karino T. 2002. Theoretical prediction of low-density lipoproteins concentration at the luminal surface of an artery with a multiple bend. Ann. Biomed. Eng. 30, 778–791 10.1114/1.1495868 (doi:10.1114/1.1495868) [DOI] [PubMed] [Google Scholar]
- 19.Ding ZF, Fan YB, Deng XY. 2009. Effect of LDL concentration polarization on the uptake of LDL by human endothelial cells and smooth muscle cells co-cultured. Acta Biochim. Biophys. Sin. 41, 146–153 10.1093/abbs/gmn017 (doi:10.1093/abbs/gmn017) [DOI] [PubMed] [Google Scholar]
- 20.Ding Z, Fan Y, Deng X. 2009. Water filtration rate and infiltration/accumulation of low density lipoproteins in 3 different modes of endothelial/smooth muscle cell co-cultures. Sci. China C, Life Sci. 52, 1023–1029 10.1007/s11427-009-0135-z (doi:10.1007/s11427-009-0135-z) [DOI] [PubMed] [Google Scholar]
- 21.Hölttä-Vuori M, Salo VT, Nyberg L, Brackmann C, Enejder A, Panula P, Ikonen E. 2010. Zebrafish: gaining popularity in lipid research. Biochem. J. 429, 235–242 10.1042/BJ20100293 (doi:10.1042/BJ20100293) [DOI] [PubMed] [Google Scholar]
- 22.Stoletov K, et al. 2009. Vascular lipid accumulation, lipoprotein oxidation, and macrophage lipid uptake in hypercholesterolemic zebrafish. Circ. Res. 104, 952–960 10.1161/cricresaha.108.189803 (doi:10.1161/cricresaha.108.189803) [DOI] [PMC free article] [PubMed] [Google Scholar]
- 23.Fang L, Harkewicz R, Hartvigsen K. 2010. Oxidized cholesteryl esters and phospholipids in zebrafish larvae fed a high cholesterol diet: macrophage binding and activation. J. Biol. Chem. 285, 32 343–32 351 10.1074/jbc.M110.137257 (doi:10.1074/jbc.M110.137257) [DOI] [PMC free article] [PubMed] [Google Scholar]
- 24.Jeroen B. 2011. Zebrafish as a model to study cardiac development and human cardiac disease. Cardiovasc. Res. 91, 279–288 10.1093/cvr/cvr098 (doi:10.1093/cvr/cvr098) [DOI] [PMC free article] [PubMed] [Google Scholar]
- 25.Wei DH, Wang GX, Tang CJ, Qiu J, Zhao J, Gregersen H, Deng L. 2012. Upregulation of SDF-1 is associated with atherosclerosis lesions induced by LDLC concentration polarization. Ann. Biomed. Eng. 40, 1018–1027 10.1007/s10439-011-0486-z (doi:10.1007/s10439-011-0486-z) [DOI] [PubMed] [Google Scholar]
- 26.Cheng C, van Haperen R, de Waard M. 2005. Shear stress affects the intracellular distribution of eNOS: direct demonstration by a novel in vivo technique. Blood 106, 3691–3698 10.1182/blood-2005-06-2326 (doi:10.1182/blood-2005-06-2326) [DOI] [PubMed] [Google Scholar]
- 27.Miura Y, Ohtori S, Nakajima T, Kishida S, Harada Y, Takahashi K. 2011. Dorsal root ganglion neurons with dichotomizing axons projecting to the hip joint and the knee skin in rats: possible mechanism of referred knee pain in hip joint disease. J. Orthop. Sci. 16, 799–804 10.1007/s00776-011-0144-1 (doi:10.1007/s00776-011-0144-1) [DOI] [PubMed] [Google Scholar]
- 28.Suckow SK, Caudle RM. 2008. Identification and immunohistochemical characterization of colospinal afferent neurons in the rat. Neuroscience 153, 803–813 10.1016/j.neuroscience.2008.02.046 (doi:10.1016/j.neuroscience.2008.02.046) [DOI] [PMC free article] [PubMed] [Google Scholar]
- 29.Isogai S, Horiguchi M, Weinstein BM. 2001. The vascular anatomy of the developing zebrafish: an atlas of embryonic and early larval development. Dev. Biol. 230, 278–301 10.1006/dbio.2000.9995 (doi:10.1006/dbio.2000.9995) [DOI] [PubMed] [Google Scholar]
- 30.Lim WL, Chew YT, Chew TC, Low HT. 2001. Pulsatile flow studies of a porcine bioprosthetic aortic valve in vitro: PIV measurements and shear-induced blood damage. J. Biomech. 34, 1417–1427 10.1016/S0021-9290(01)00132-4 (doi:10.1016/S0021-9290(01)00132-4) [DOI] [PubMed] [Google Scholar]
- 31.Motomiya M, Karino T. 1984. Flow patterns in the human carotid artery bifurcation. Stroke 15, 50–60 10.1161/01.STR.15.1.50 (doi:10.1161/01.STR.15.1.50) [DOI] [PubMed] [Google Scholar]
- 32.Perktold K, Resch M, Peter RO. 1991. Three-dimensional numerical analysis of pulsatile flow and wall shear stress in the carotid artery bifurcation. J. Biomech. 24, 409–420 10.1016/0021-9290(91)90029-M (doi:10.1016/0021-9290(91)90029-M) [DOI] [PubMed] [Google Scholar]
- 33.Wada S, Karino T. 2002. Prediction of LDL concentration at the luminal surface of a vascular endothelium. Biorheology 39, 331–336 [PubMed] [Google Scholar]
- 34.Naiki T, Karino T. 1999. Flow-dependent concentration polarization of plasma proteins at the luminal surface of a semipermeable membrane. Biorheology 36, 243–256 [PubMed] [Google Scholar]
- 35.Naiki T, Sugiyama H, Tashiro R, Karino T. 1999. Flow-dependent concentration polarization of plasma proteins at the luminal surface of a cultured endothelial cell monolayer. Biorheology 36, 225–241 [PubMed] [Google Scholar]
- 36.Wada S, Karino T. 1999. Theoretical study on flow-dependent concentration polarization of low density lipoproteins at the luminal surface of a straight artery. Biorheology 36, 207–223 [PubMed] [Google Scholar]
- 37.Aarts PA, Heethaar RM, Sixma JJ. 1984. Red blood cell deformability influences platelets–vessel wall interaction in flowing blood. Blood 64, 1228–1233 [PubMed] [Google Scholar]
- 38.Tilles AW, Eckstein EC. 1987. The near-wall excess of platelet-sized particles in blood flow: its dependence on hematocrit and wall shear rate. Microvasc. Res. 33, 211–223 10.1016/0026-2862(87)90018-5 (doi:10.1016/0026-2862(87)90018-5) [DOI] [PubMed] [Google Scholar]
- 39.Zhao R, Marhefka JN, Shu F, Hund SJ, Kameneva MV, Antaki JF. 2008. Micro-flow visualization of red blood cell-enhanced platelet concentration at sudden expansion. Ann. Biomed. Eng. 36, 1130–1141 10.1007/s10439-008-9494-z (doi:10.1007/s10439-008-9494-z) [DOI] [PMC free article] [PubMed] [Google Scholar]
- 40.Eckstein EC, Belgacem F. 1991. Model of platelet transport in flowing blood with drift and diffusion terms. Biophys. J. 60, 53–69 10.1016/S0006-3495(91)82030-6 (doi:10.1016/S0006-3495(91)82030-6) [DOI] [PMC free article] [PubMed] [Google Scholar]
- 41.Fox RW, Mcdonald AT. 1998. Introduction to fluid mechanics, 5nd edn New York, NY: John Wiley & Sons Inc [Google Scholar]
- 42.Munson BR, Young DF, Okiishi TH. 2002. Fundamentals of fluid mechanics, 4nd edn New York, NY: John Wiley & Sons Inc [Google Scholar]
- 43.Bark DL, Ku DN. 2010. Wall shear over high degree stenoses pertinent to atherothrombosis. J. Biomech. 43, 2970–2977 10.1016/j.jbiomech.2010.07.011 (doi:10.1016/j.jbiomech.2010.07.011) [DOI] [PubMed] [Google Scholar]
- 44.Ethier CR. 2002. Computational modeling of mass transfer and links to atherosclerosis. Ann. Biomed. Eng. 30, 461–471 10.1114/1.1468890 (doi:10.1114/1.1468890) [DOI] [PubMed] [Google Scholar]
- 45.Chien S. 2003. Molecular and mechanical bases of focal lipid accumulation in arterial wall. Prog. Biophys. Mol. Biol. 83, 131–151 10.1016/S0079-6107(03)00053-1 (doi:10.1016/S0079-6107(03)00053-1) [DOI] [PubMed] [Google Scholar]
- 46.Himburg HA, Grzybowski DM, Hazel AL, LaMack JA, Li XM, Friedman MH. 2004. Spatial comparison between wall shear stress measures and porcine arterial endothelial permeability. Am. J. Physiol. Heart Circ. Physiol. 286, H1916–H1922 10.1152/ajpheart.00897.2003 (doi:10.1152/ajpheart.00897.2003) [DOI] [PubMed] [Google Scholar]


