Abstract
Ocean circulation models are widely used to simulate organism transport in the open sea, where challenges of directly tracking organisms across vast spatial and temporal scales are daunting. Many recent studies tout the use of ‘high-resolution’ models, which are forced with atmospheric data on the scale of several hours and integrated with a time step of several minutes or seconds. However, in many cases, the model's outputs that are used to simulate organism movement have been averaged to considerably coarser resolutions (e.g. monthly mean velocity fields). To examine the sensitivity of tracking results to ocean circulation model output resolution, we took the native model output of one of the most sophisticated ocean circulation models available, the Global Hybrid Coordinate Ocean Model, and averaged it to commonly implemented spatial and temporal resolutions in studies of basin-scale dispersal. Comparisons between simulated particle trajectories and in situ near-surface drifter trajectories indicated that ‘over averaging’ model output yields predictions inconsistent with observations. Further analyses focused on the dispersal of juvenile sea turtles indicate that very different inferences regarding the pelagic ecology of these animals are obtained depending on the resolution of model output. We conclude that physical processes occurring at the scale of days and tens of kilometres should be preserved in ocean circulation model output to realistically depict the movement marine organisms and the resulting ecological and evolutionary processes.
Keywords: ocean circulation model, particle tracking, dispersal, pleuston, sea turtle, North Atlantic
1. Introduction
The movement and dispersal of organisms is a fundamental component of nearly all ecological and evolutionary processes [1]. Numerical models have become critical tools for generating and testing hypotheses about the evolutionary, ecological and management implications of organism movement by linking the biological traits of organisms to physical transport processes [2,3]. Frequently, ocean velocity fields predicted by circulation models are used to study organism transport and distributions in the open sea, where challenges of directly tracking organisms across vast spatial and temporal scales are daunting [4–7]. Rapid progress has been made in numerical modelling of the ocean in terms of the complexity of the physical processes included and the spatial and temporal resolution over which they are quantified [2]. Sophisticated ocean circulation models have been developed in tandem with data-assimilation algorithms that incorporate in situ and satellite measurements into model predictions to generate more accurate hindcasts of the global ocean [8]. Validation studies indicate that these physical models possess a high-degree of realism in depicting oceanic conditions [8,9].
For simulations of marine organism dispersal, the output of ocean circulation models is typically paired with particle-tracking software that computes the trajectories of virtual particles released within the modelled velocity field [2,10,11]. Most studies using these techniques tout the use of ‘high-resolution’ ocean circulation models; yet, the output that is used greatly varies in temporal resolution among studies. For instance, although an ocean circulation model is typically integrated using a time step of several seconds to minutes, the output of the model actually used to estimate organism transport might be averaged to monthly mean current velocity [4,12–14]. Likewise, the spatial resolution of ocean circulation models also vary, with grid-spacing ranging from less than 10 km [7,15] to more than 90 km [16–18]. However, the sensitivity of oceanic transport predictions to model output resolution, and the extent that differences in resolution influence the inferences made regarding the ecological processes being studied, have received little attention [19].
Here, we took the native model output of one of the most sophisticated ocean circulation models available, the Global Hybrid Coordinate Ocean Model (HYCOM) [8,20] and averaged it to commonly implemented spatial and temporal resolutions used in studies of basin-scale dispersal in marine organisms. In its native resolution, HYCOM output has a spatial resolution of 0.08° (approx. 6–9 km grid spacing), a daily time step and is forced using wind stress, wind speed, heat flux, precipitation and evaporation. HYCOM assimilates satellite altimetry data, sea surface temperature and in situ measurements from a global array of expendable bathythermographs, Argos floats and moored buoys to produce realistic ‘hindcast’ output. Thus, Global HYCOM can resolve mesoscale processes, such as meandering currents, fronts, filaments and oceanic eddies [8,20]. We determined how information lost from the underlying velocity field (i.e. via spatial and temporal averaging) affects the accuracy of simulated trajectories by comparing them with the observed trajectories of near-surface drifters. We then identified how these differences in resolution influence our perception of long-distance transport in juvenile sea turtles, which have been the focus of a growing number of numerical simulations that use model output spanning a wide range of spatial and temporal resolutions [12–14,21–31]. Based on our findings, we provide recommendations for oceanographers and biologists designing (and interpreting the results from) numerical experiments on oceanic movements of plankton, neuston and pleuston, such as jelly fish, gastropods, benthic invertebrate larvae, fish larvae, as well as sea turtles.
2. Material and methods
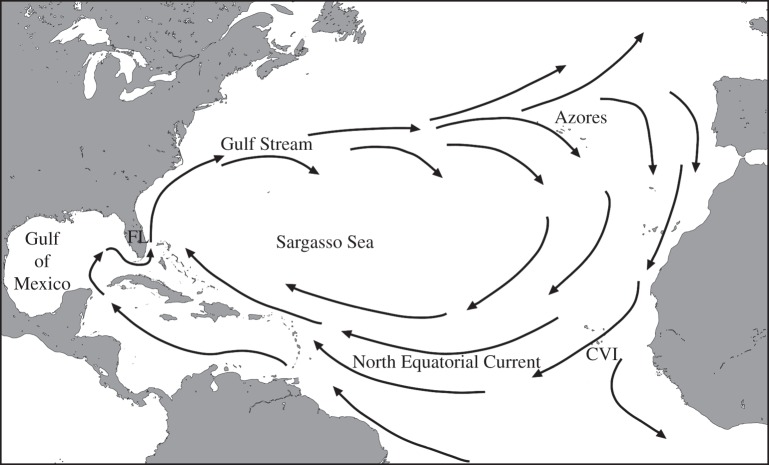
We extracted simulated surface velocity fields from Global HYCOM hindcast output over the North Atlantic (figure 1). This product has a horizontal grid spacing of 0.08° (approx. 6–9 km) and a snapshot of current velocity each day at 00.00 h (http://hycom.org). We coarsened this product by spatially averaging daily velocity over each 0.24° × 0.24° rectangle and over each 0.56° × 0.56° rectangle, respectively. The resulting mean value of each rectangle was then input at each 0.08° grid point within that area. This permitted us to coarsen the current velocity without altering the underlying grid structure and bathymetry. Additionally, for each configuration of spatial resolution (0.08°, 0.24° and 0.56°), we averaged current velocities over 5 days and 30 days, as well as left the velocity as a daily snapshot. This produced nine different configurations of HYCOM output which resolved surface currents over: (i) 0.08° and 1 day (the native format); (ii) 0.24° and 1 day; (iii) 0.56° and 1 day; (iv) 0.08° and 5 days; (v) 0.24° and 5 days; (vi) 0.56° and 5 days; (vii) 0.08° and 30 days; (viii) 0.24° and 30 days and (ix) 0.56° and 30 days. This range of model output intervals encompasses the temporal and spatial resolutions used in many recent studies of oceanic dispersal. To assess how different resolution output influences the predictions of long-distance transport, we used two complementary approaches: one comparing model predictions to surface (Lagrangian) drifters and the other performing dispersal simulations of young sea turtles. For each set of analyses, described in detail in the sections below, computations were performed in all nine model output configurations.
Figure 1.
Schematic of the North Atlantic Subtropical Gyre and study area. Arrows indicate the generalized direction of current flow. Currents and locations discussed in the text are identified. FL marks Florida, USA; CVI marks the Cape Verde Islands.
2.1. Comparison with Lagrangian drifter observations
We examined how well the tracks of 50 Lagrangian near-surface drifters could be predicted by each configuration of model output. The southeast coast of Florida was chosen as a starting position for all drifters because of the large number of observations available spanning multiple years. Additionally, this oceanic region is in close proximity to a major sea turtle nesting aggregation that has been the subject of many numerical experiments which have simulated turtle transport using a wide range of model resolutions [12,13,21,28,29]. The drifter data used were from the NOAA-AOML global drifter dataset and were provided by Fisheries and Oceans Canada (http://www.dfo-mpo.gc.ca/). The drifters are surface floats attached via a thin tether to a subsurface ‘holey-sock’ drogue centred at 15 m. Although data are typically stored as 6 h interpolated locations, we reduced this to the initial daily location because the highest resolution model output had a time step of 1 day. Drifters used in analyses were from the period 2004–2011 and had track lengths that ranged from 24 to 730 days. Divergence between actual surface currents and drifter trajectories is expected due to current shear (an effect of current velocity varying over the length of the drifter) and drifter slip (an effect of wind acting on the surface float) [32,33]. Typically, drifter slip causes drifters to travel a slightly faster speed than surface currents, and current shear deflects the direction of travel slightly clockwise relative to surface currents in the Northern Hemisphere. We make no attempt to reconcile these differences because we do not intend for this analysis to be a validation of the skill of HYCOM; rather, this is a way to compare estimates of surface currents based on different resolutions of model output to an estimate of surface currents based on in situ observations [34]. This cross-validation technique allows us to determine how well predictions match observations and to quantify discrepancies among simulated trajectories when using model outputs having different resolution [35].
Our first analysis determined differences between modelled ocean surface velocity and that of observations. Using the particle-tracking program ICHTHYOP v. 2.21 [10], 100 virtual particles were released randomly within a 0.08° × 0.08° area centred on each daily location of the 50 drifters to account for possible bias in drifter location data. For advection of particles through the surface HYCOM velocity fields, ICHTHYOP implemented a Runge–Kutta fourth-order time-stepping method, whereby particle position was calculated every half an hour for 24 h. At the end of the 24 h, we determined the distance between each particle and the drifter location at that same time. For the nearest particle, we calculated the difference in that numerical particles' apparent velocity and that of the drifter. Drifter direction was calculated by measuring the heading of the drifter from the starting point of the drifter to its position after 24 h; speed was calculated by measuring the straight-line distance travelled and dividing by 24 h. Particle direction was calculated by measuring the heading of the particle from the starting point of the particle to its position after 24 h; speed was calculated by measuring the straight-line distance travelled and dividing by 24 h. The values for particle velocity were then subtracted from the values of drifter velocity; thus, we determined the difference in the daily speed and direction between the particles and the drifter along the entire length of each drifter track. We used velocity data from the particle that, after each 24 h, was nearest the location of the drifter at that same time because that particle's path, presumably, best reflects the movement of the actual drifter. It is not expected that all particles would behave same as the drifter (neither would we expect that a cluster of drifters released over the same area would behave alike), thus this particular technique is more informative than simply taking the mean velocity of all 100 particles released. We used pair-wise Wilcoxon sign-rank tests to determine whether there were systematic differences in the daily velocities predicted by the different model resolutions with respect to the apparent drifter velocities. This test was performed for each of the 50 drifter tracks within each of the nine model configurations. If p-values were greater than 0.05, we designated that there was no significant difference between drifter velocity and numerical particle velocity.
Our second analysis determined how well a cluster of virtual particles released into different model output resolution could predict the path of a drifting object. We calculated the separation distance through time for 100 virtual particles released randomly within a 0.08° × 0.08° area centred on the start location off the Florida coast for each of the 50 drifters. Particles were tracked throughout the duration of each drifter's trajectory. At 10-day intervals, the position of all 100 virtual particles was compared with that of the drifter and the nearest value was recorded. We then calculated the mean separation distance among all drifters for which data were available at 10-day intervals up to 730 days.
2.2. Modelling sea turtle dispersal
In the next set of experiments, we sought to show how simulations performed using ocean circulation model output at different resolutions influence our perception of oceanic movements of marine organisms. For these simulations, we examined transport estimates for young loggerhead sea turtles (Caretta caretta). Recent studies suggest that swimming behaviour by young sea turtles can have a profound influence on their dispersal [13,28,29] (though most studies on sea turtles have ignored this component of their movement, in part, because the swimming behaviour of most populations is unknown). In these analyses, we did not include swimming behaviour for simplicity in presentation and to make our results more broadly generalizable to other taxa. Primarily, there are two ways in which particles are released within models; either across a large domain, typically over the continental shelf and slope [25,36] or as point source injections at specific locations of interest [15,24]. Here, we used both approaches, releasing particles across the continental shelf and slope of the southeastern USA and at two points in the western and eastern basin of the North Atlantic, near Florida, USA and the Cape Verde Islands.
In the simulations along the southeastern USA, a particle release zone was defined by the 0–500 m isobaths (northern most latitude 38° N and western most longitude 90° W). We chose a zone of particle release that slightly extended beyond the continental shelf (0–200 m) to examine the possibility of transport and retention for particles in coastal and oceanic waters. Within this area, 10 000 latitude and longitude coordinates were selected at random to serve as release sites for virtual particles. For the years 2004, 2005 and 2006, a single particle was released from each site on 1 August, 15 August, 1 September, 15 September and 30 September. The August–September period was chosen because it encompasses the time when loggerhead hatchlings in the southeastern US emerge from their nests and migrate offshore. Particles were tracked for 3 years with ICHTHYOP (v. 2) using a Runge–Kutta fourth-order time-stepping method whereby particle position was calculated every half an hour and the location of each virtual particle was recorded daily.
Quickly escaping the continental shelf and reaching developmental habitat in oceanic waters is an important aspect of loggerhead sea turtle life history [35,37,38]. The continental shelf is inhospitable to young turtles due to an abundance of predators and wintertime temperatures that decrease the potential for growth and that can result in cold-stunning or death [35,37–40]. To examine how model output resolution influences our perception of the oceanographic constraints acting on this migration, for each particle, we recorded whether it was located in oceanic waters (water depth more than 200 m) after 90 days (approx. the onset of winter). Then for each release point, we calculated the percentage of the 15 release events that particles were in oceanic waters after 90 days. Another important life-history trait of these loggerheads is reaching productive foraging grounds in the eastern Atlantic. Thus, we also recorded each particle's most eastward longitude that it encountered during 3 years. For each release point, we calculated the mean most eastward longitude from the 15 release events.
In our final set of experiments, we released particles from two point sources where dense loggerhead nesting occurs. We chose locations that differ oceanographically, one in the slower and broader North Equatorial Current System (Cape Verde Islands) and the other in close proximity to the strong and narrow western boundary current, the Gulf Stream System (offshore of southeast Florida; figure 1). At each location, ICHTHYOP (v. 2) released 100 particles at daily intervals throughout 75 days during the main hatching season. In Florida, this began in 1 July 2004 and in the Cape Verde Islands 28 September 2004. Particles were tracked for 5 years. In each simulation, we determined the percentage of particles that passed through the waters surrounding the Azores, an oceanic region favourable for the development of young loggerheads [28,35]. Additionally, to assess how the resolution of model output influences the possibility of detecting connectivity between nesting sites and oceanic areas, we calculated the amount of dispersion at the end of 5 years (as measured by the mean distance among all particles).
3. Results
3.1. Analyses with Lagrangian drifters
The velocity estimated by particle-tracking within Global HYCOM output was typically slower than the apparent velocity of surface drifters. This discrepancy is also seen in other ocean circulation models and is likely related to the absence of the wind induced ‘drifter slip’ effect (that imparts additional velocity to the drifters) in these models [33]. However, differences in speed became more pronounced as output became spatially and temporally coarser (figure 2a). In comparisons between daily velocity estimates between each drifter and the corresponding particle-tracking experiment, Wilcoxon signed-rank tests revealed no difference in speed (i.e. p > 0.05) for 48 per cent of drifter-particle pairs when simulations were performed with the highest resolution output (0.08°, 1 day). This percentage dropped to 32 per cent when output was spatially coarsened to 0.24° and to 28 per cent when output was coarsened to 0.56°. When output was coarsened temporally to 5 days and 30 days averages, the percentage of drifter-particle pairs that were not significantly different dropped to 30 per cent and 18 per cent, respectively. In simulations in which both spatial and temporal resolution was coarsened, daily velocity estimates were not significantly different for 24 per cent (0.24°, 5 days), 20 per cent (0.56°, 5 days), 16 per cent (0.24°, 30 days) and 14 per cent (56°, 30 days) of the drifter-particle pairs. The daily direction of travel estimated by particle tracking within the Global HYCOM output was slightly counterclockwise relative to the path of the drifter (figure 2b). This difference is expected due to drifters' tethers and drogues encountering currents at a slightly greater depth, which, in the Northern Hemisphere, typically move clockwise relative to surface waters (i.e. ‘current shear’) [32,33]. Unlike for the estimates of speed, Wilcoxon signed-rank tests indicate fairly good agreement between drifter and particle directions regardless of model output resolution; no difference was detected in daily direction for 80–90% of drifter-particle pairs, within each model resolution.
Figure 2.
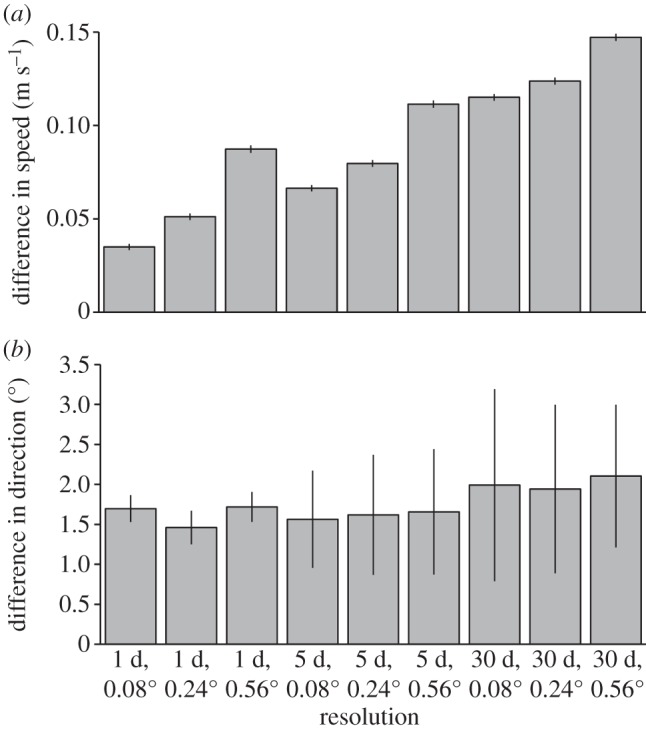
The mean daily difference in velocity between 50 drifters and predictions for each model output resolution. Error bars indicate the 95% CI of the mean. (a) Positive values indicate that the speed of the drifter was greater than modelled predictions. (b) Positive values indicate that the direction of the drifter was more clockwise than modelled trajectories.
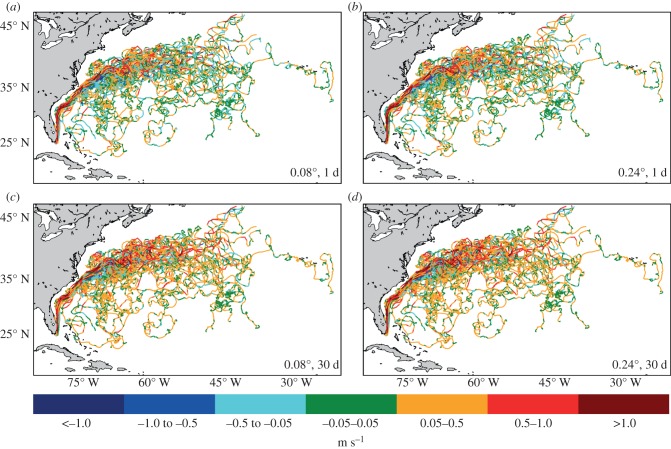
Plotting the difference in the drifter's apparent velocity and the modelled velocity of particles along the tracks of the drifters revealed systematic differences based on oceanic regions (figure 3). For all model output, drifters moved more rapidly than particles in the Gulf Stream along the southeastern US coast between Florida and North Carolina. As the Gulf Stream turns eastward between 70° W and 40° W, in finer model output (i.e. 0.08°, 1 day and 0.24°, 1 day) drifter velocity became better represented by particles, whereas in coarser model output (i.e. 0.56°, 1 day; 0.56°, 5 days; 0.08°, 30 days; 0.24°, 30 days and 0.56°, 30 days) drifters continued to move more rapidly than particles (figure 3). The daily velocity of drifters exported from the Gulf Stream and into the Sargasso Sea was well represented by particle velocity in finer model output, whereas drifters continued to move more rapidly than particles released within coarser model output (figure 3).
Figure 3.
Difference in speed along 50 tracks of surface drifters, relative to model predictions. Green indicates portions of the track where model predictions were within ±0.05 m s−1 of the observed drifter. Warmer colours (reds) indicate portions of the track where drifters moved faster than model predictions, cooler colours (blues) indicate portions of the track where drifters moved slower than model predictions. Differences shown for model output at (a) 0.08°, 1 day; (b) 0.24°, 1 day; (c) 0.08°, 30 days and (d) 0.24°, 30 days.
Analyses assessing how well a cloud of particles released within HYCOM output approximated the path of a drifter showed major differences depending on resolution (figure 4). Although coarser model output, at times, predicts the general direction of a drifter, dynamic mesoscale features are not as well represented as in higher resolution output (figure 4a). In other cases, the predictions based on coarser output might not be representative of the drifter track at all (figure 4b). Mean separation distance varied across time, rising sharply within the first 90 days (between 500 and 1000 km, depending on model output resolution) and dropping after 365 days (between 150 and 700 km) (figure 5). This pattern reflects the dynamics of the Gulf Stream System, in which particles may be detrained from the Gulf Stream's jet while drifters travel on (or vice versa) and thus separation distance is greatest early on (figures 4 and 5). With time, however, drifters and particles rejoin as they move eastward into a less energetic oceanic region. These dynamics are observed in simulations with finer temporal and spatial resolution (i.e. 0.08° and 0.24° averaged over either 1 day or 5 days); mean separation distance remained fairly constant through the end of the second year (between 200 and 300 km). However, separation distance increased (between 500 and 1200 km) in coarser model output (i.e. at all spatial resolutions of 0.56° and all temporal resolutions of 30 days).
Figure 4.
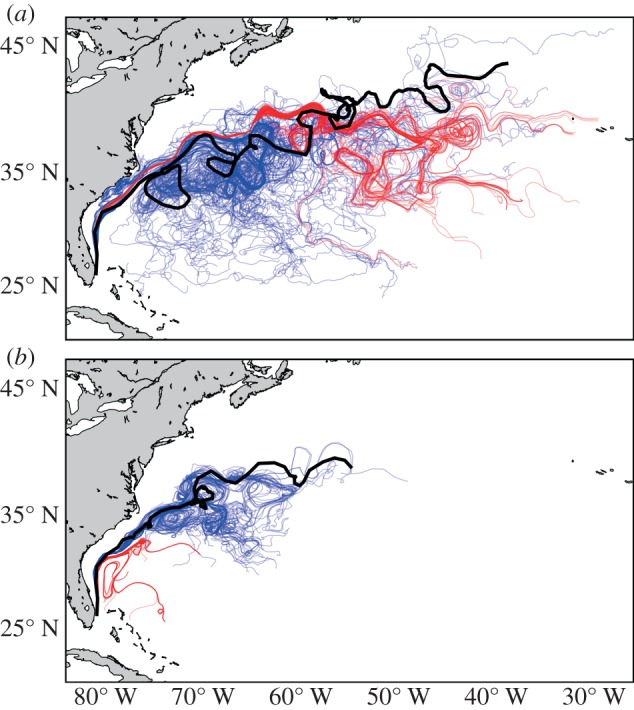
An example of the paths of two different drifters (a,b) in relation to the paths of virtual particles that were released at the drifter's start location and tracked for the same duration. Thick black lines indicate the path of the buoy, blue lines indicate trajectories of 100 particles released over the released in the native model output (0.08°, 1 day) and red lines indicate trajectories of 100 particles released in coarser model output (0.24°, 30 days) commonly used in studies simulating sea turtle dispersal.
Figure 5.
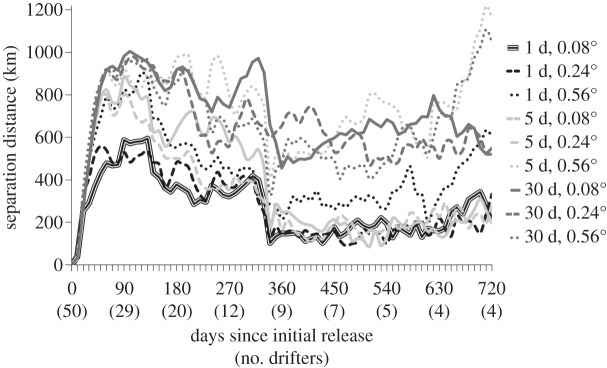
Mean separation distance (y-axis) through time (x-axis) of virtual particles and drifters. Line styles differentiate the model output resolution in which particles were tracked.
3.2. Simulations of sea turtle dispersal along the southeastern USA
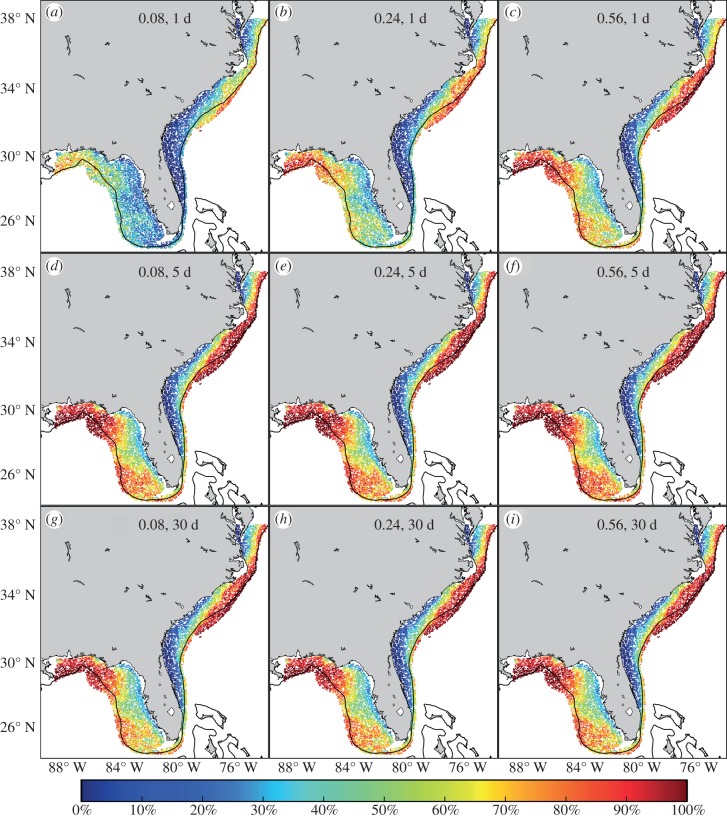
Scenarios of sea turtle dispersal along the southeastern US coast differed substantially depending on the resolution of model output. Cross-shelf transport of particles into oceanic waters at 90 days of release increased in coarser model output (figure 6). At the finest resolution (0.08°, 1 day), the mean percentage of particles in oceanic waters after 90 days was 31 per cent for starting points along the east coast and 38 per cent for starting points in the Gulf of Mexico. Coarsening the resolution to 0.24° increased the percentage to 42 per cent along the east coast and to 55 per cent in the Gulf of Mexico. For other model output resolutions, the mean percentage of particles in oceanic waters after 90 days ranged from 51 to 57 per cent along the east coast and from 66 to 75 per cent in the Gulf of Mexico (figure 6). However, the extent that resolution influenced offshore transport was also dependent on the location site of particle release. Discrepancies were largest seaward of the shelf break, north of 32° N and in the Gulf of Mexico, but predictions were in close agreement within the South Atlantic Bight (i.e. the inner continental shelf between 28° N and 36° N; figure 6).
Figure 6.
Percentage of particles in oceanic waters (greater than 200 m) at the end of 90 days based on start location. The black line designates the 200 m isobath, i.e. the continental shelf. Each panel shows results for the different model output resolution. (a) Native model output, 0.08° spatial resolution, 1 day temporal resolution; (b) 0.24°, 1 day; (c) 0.56°, 1 day; (d) 0.08°, 5 days; (e) 0.24°, 5 days; (f) 0.56°, 5 days; (g) 0.08°, 30 days; (h) 0.24°, 30 days and (i) 0.56°, 30 days.
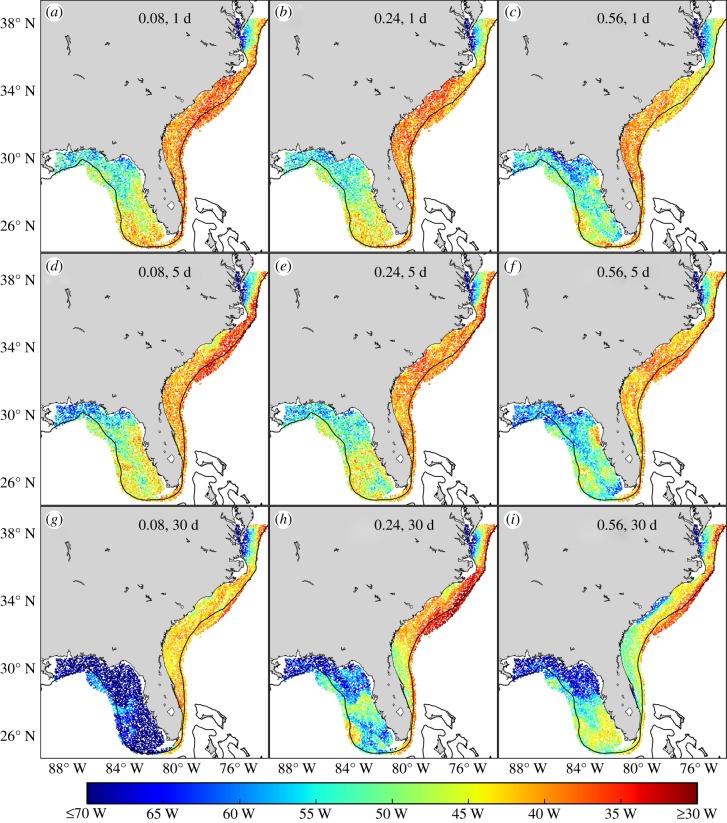
Predictions of eastward transport also differed substantially depending on the resolution of model output (figure 7). At the finest resolution (0.08°, 1 day), the mean eastern-most longitude that particles reached within 3 years was 40.9° W along the east coast and 48.7° W in the Gulf of Mexico. For other model output resolutions, the mean maximum longitude that particles reached ranged from 41.7° W to 45.8° W along the east coast and from 49.2° W to 71.6° W in the Gulf of Mexico. Thus, coarser model output tended to underestimate the likelihood of the mean eastern-most longitude that particles travelled, particularly in the Gulf of Mexico (figure 7).
Figure 7.
Mean eastern-most longitude after 3 years based on start location. (a) Native model output, 0.08° spatial resolution, 1 day temporal resolution; (b) 0.24°, 1 day; (c) 0.56°, 1 day; (d) 0.08°, 5 days; (e) 0.24°, 5 days; (f) 0.56°, 5 days; (g) 0.08°, 30 days; (h) 0.24°, 30 days and (i) 0.56°, 30 days.
3.3. Simulations of sea turtle dispersal from the eastern and western Atlantic
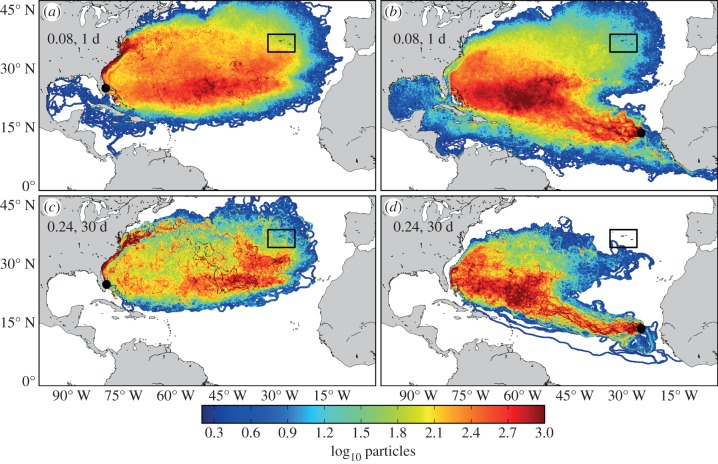
Releasing particles from two point sources of major loggerhead nesting on opposite sides of the Atlantic provided the opportunity to assess how model output resolution influences dispersal predictions for different oceanic regimes. In simulations starting at the Cape Verde Islands, the mean distance between each particle after 5 years was 1803 km at the finest resolution (0.08°, 1 day). In comparison, dispersion was within 10 per cent of this value when model output was averaged over 5 days or less, regardless of spatial resolution. However, comparing simulations in which model output was averaged over 30 days (at 0.08°, 0.24 and 0.56°) dispersion decreased by 21–35%. In simulations starting in southeast Florida, this pattern was similar. Dispersion was 1647 km at the finest resolution and, in comparison, dispersion was within 8 per cent of this value when model output was averaged over 0.24°, 1 day; 0.56°, 1 day; 0.08°, 5 days and 0.24°, 5 days. Comparing simulations in which model output was averaged over 0.56°, 5 days and over 30 days (at 0.08°, 0.24 and 0.56°) dispersion decreased by 17 per cent, 12 per cent, 25 per cent and 48 per cent, respectively. These differences in dispersion resulted in the connections between Florida nesting sites and the Caribbean Sea, Canary Islands and Gulf of Mexico that were identified in simulations performed at the finest resolution (figure 8a) being lost with coarser output (figure 8c). Likewise, connections between the Cape Verde Islands nesting sites and coastal Africa, the Caribbean Sea, Gulf of Mexico, the southeastern US coast and Azores were identified with the finest resolution output (figure 8b), but not at coarser resolution (figure 8d).
Figure 8.
Distribution of 7500 particles tracked for 5 years from southeast Florida and the Cape Verde Islands. The colours indicate the number of particles within each 0.08° × 0.08° area throughout the 5 year simulation. The colours are scaled logarithmically (i.e. log10(n+1), where n is number of particles at a particular location through time). The black rectangle around islands in the northeastern Atlantic indicates the Azores, an important foraging area for young turtles. (a) Paths taken by particles released off the coast of Florida (black dot) when released into the native model output (0.08°, 1 day). (b) Paths taken by particles released off the Cape Verde Islands (black dot) when released into the native model output (0.08°, 1 day). (c) Same as in (a) but particles were released into coarser model output (0.24°, 30 days). (d) Same as in (b) but particles were released into coarser model output (0.24°, 30 days).
In assessing how model output resolution influences specific predictions about connectivity between nesting and foraging grounds in sea turtles, we determined the percentage of particles from each release site that reached the Azores (figure 9 (see figures 1 and 8 for location)). From the Cape Verde Islands, the percentage of particles reaching the Azores within 5 years was most influenced by changes in temporal resolution. For daily snapshots of velocity, the percentage of particles reaching the Azores ranged from 5.0 to 5.6 per cent (when resolution was at 0.08°, 0.24° and 0.56°), when velocities were averaged over 5 days the percentage decreased to 2.3–3.7%, and when velocities were averaged over 30 days the percentage decreased to 0 to less than 0.1 per cent (figure 9). In contrast, the influence of model output resolution was more complicated for particle dispersal off the southeast coast of Florida. At 0.08°, 1 day resolution 18.9 per cent of particles reached the Azores. This percentage increased when model output was coarsened spatially (19.4% of particles at 0.24°, 1 day; 28.9% at 0.56°, 1 day) and when model output was coarsened temporally (20.2% at 0.08°, 5 days; 20.7% at 0.08°, 30 days). However, when model output was coarsened both spatially and temporally (i.e. at resolutions of 0.24°, 5 days; 0.56°, 5 days; 0.24°, 30 days and 0.56, 30 days) the percentage of particles reaching the Azores decreased (figure 9).
Figure 9.
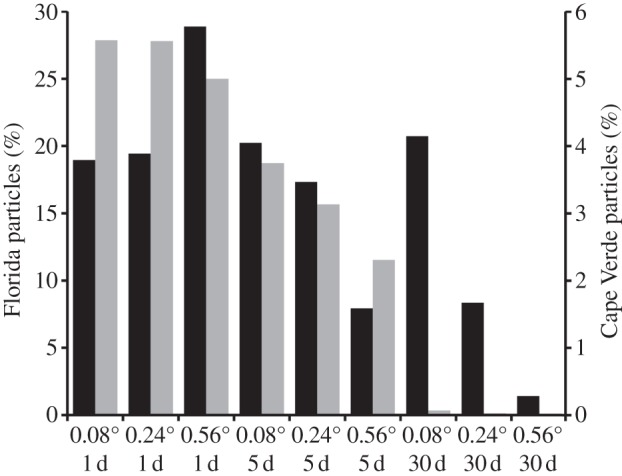
Percentage of particles reaching the Azores within 5 years from Florida, USA (black bars) and the Cape Verde Islands (grey bars). The scale of the left-hand y-axis is for particles originating from Florida; the scale on the right-hand y-axis is for particles originating from Cape Verde.
4. Discussion
Our analyses indicate that predictions of oceanic transport can be highly sensitive to changes in spatial and temporal resolution of ocean circulation model output. Particle-tracking experiments performed in finer resolution ocean circulation model output were more representative of observed trajectories from near-surface drifters than those performed in coarser output. At the daily timescale, spatially and temporally coarsening model output resolution resulted in predictions that were slower than the velocities estimated by drifters (figure 2a). The direction that particles travelled relative to drifter direction was less sensitive to model output resolution, although as output coarsened temporally the predictions became more variable (figure 2b). The magnitude of the discrepancy between observed trajectories and the model's predictions depended on how model output was coarsened. In general, coarsening the spatial resolution of model output had less of an influence on predictions than did coarsening the temporal resolution. Relative to the finest resolution output (0.08°, 1 day), daily speed estimates dropped by 4.4 per cent and 14.3 per cent when output was spatially coarsened to 0.24° and 0.56°, respectively. In contrast, daily speed estimates dropped by 8.6 per cent and 21.8 per cent when temporal resolution was coarsened to 5 days and 30 days, respectively. In part, this might be due to spatial resolution coarsening by a factor of 3 (0.24°) and 7 (0.56°), whereas temporal resolution was coarsened by a factor of 5 (5 days) and 30 (30 days).
At longer timescales, the greater biases in coarser model output resulted in much larger differences in separation distance between simulated particle and observed drifter tracks (figures 4 and 5). Specifically, the dynamics of major currents as the Gulf Stream are much better represented using finer resolution model output than coarser output (figure 4). For instance, the energetic oceanic area east of 70° W, where meanders and rings associated with the Gulf Stream occur, was well-characterized by particle trajectories in fine-resolution output (figure 4a,c). However, in coarser model output particles do not disperse and coincide over long stretches of the ocean (figure 4b,d). Thus, it is clear that oceanic processes that operate of the order of tens of kilometres, such as eddies and fronts, play an important role in determining long-distance movements of marine animals [11,39] (figure 4). Likewise, strong winds, storms and other meteorological events that influence surface waters for only a period of days or less have important roles in organisms' dispersal trajectories [2,14]. The spatio-temporal resolution of model output used when simulating organism dispersal must also account for these dynamic physical processes or our view of the dispersal and movement of marine animals is likely to be flawed.
For example, in simulations of sea turtle dispersal even slightly coarser model output estimated greater offshore transport of particles (figure 6b,d). This is likely due to coarser spatial and temporal output averaging out the frontal zone that exists along the shelf-break that delineates coastal and oceanic water masses [41], making it easier for particles to be advected off the continental shelf. This is potentially problematic because studies relying on predictions from coarser output might infer that offshore movement was relatively easy, and thus turtles need not rely on their own swimming to reach oceanic waters prior to the onset of winter [29]. Such an assessment would clearly bias estimates of the energy required for turtles to complete their offshore migration and the selective pressures driving their evolution.
Additionally, coarser model output tended to predict reduced eastward transport of particles, particularly for those from the Gulf of Mexico and the South Atlantic Bight (figure 7). This is likely because coarser spatial and temporal output reduce the overall velocity fields through which particles move (figure 2a), which decreases the distance that particles travel. However, along the North Carolina and South Carolina shelf break (32° N–36° N) eastward transport was overestimated (figure 7d,h). Over this area, the Gulf Stream experiences relatively large meanders [42]; averaging these meanders over coarser spatio-temporal scales widened the narrow, jet-like current, resulting in a greater likelihood of particle entrainment, which in turn increased eastward transport from these locations. Thus, studies relying on coarser model output might conclude that turtles dispersing from different locations along the southeastern US coast have very different likelihoods of reaching the eastern Atlantic (e.g. turtles from the Carolinas are much more likely to reach the eastern Atlantic than turtles from the Gulf of Mexico), whereas finer resolution output suggests that turtles from different starting points can reach similar longitudes.
Analyses examining the likelihood of particles reaching the Azores from the east coast of Florida and from the Cape Verde Islands highlight important dispersal differences between oceanic regimes. For Cape Verde particles released into the broader, slower North Equatorial Current, coarsening model output decreased the likelihood of particles reaching the Azores (figure 9), probably owing to decreasing the speed at which particles travelled (figure 2a). For Florida particles released near the narrower, faster Gulf Stream, coarsening either the spatial or temporal resolution of output widened this current (though decreased its velocity) and increased the likelihood of particles remaining entrained in it and reaching the Azores. However, when both spatial and temporal resolution of output was coarsened the likelihood of particles reaching the Azores dropped substantially (figure 9), which coincides with configurations of model output that were least dispersive. Thus, coarser model output may initially overestimate connectivity between nesting and distant foraging grounds by averaging out meanders and eddies that would otherwise promote retention, but as current speeds are further reduced and directions become less variable the likelihood of those connections decreases.
Realistically depicting the dispersive and energetic nature of the ocean's surface is essential for identifying connectivity between reproductive sites and foraging areas as well as the corridors of movement (figures 8 and 9). For organisms that primarily rely on ocean currents for transport, not identifying possible connections between reproductive and nursery habitats with dispersal simulations will bias predictions of their oceanic distribution and movement process. For example, depending on the model output resolution used in simulations (figure 8) one might postulate that swimming would be required for turtles from Florida and the Cape Verde Islands to reach (or avoid) the Caribbean Sea. Likewise, depending on the resolution of the model used, very different predictions are made regarding the relative contribution of loggerheads from the Cape Verde Islands and those from Florida to mixed-stock foraging grounds, such as the Azores (figures 8 and 9). Thus, using coarser model output (that is less accurate at depicting oceanic processes (figures 2–5)) necessarily confounds our ability to infer the possible role of biological processes such as swimming behaviour and mortality on animal distributions [15,28,43].
5. Conclusion
Given the sensitivity of transport predictions to changes in the spatial and temporal resolutions of the ocean circulation model output, we recommend that appropriate caution be taken in interpreting results from simulations that rely on them to estimate dispersal. We show that using output which averages out the processes that occur at the scale of days and tens of kilometres can bias perceptions of basin-scale connectivity and organism transport. In simulations of sea turtle dispersal, as model output was coarsened from the native output, dispersal outcomes differed but the magnitude and direction of difference depended, in part, on the metric used to quantify transport. Offshore transport of particles after 90 days of drift was overestimated substantially by coarsening model output from 0.08° to 0.24°, whereas eastward transport over 3 years was similar for both resolutions. Thus, the resolution of circulation model output required to appropriately simulate organism movement depends on the question being addressed and the dominant physical factors influencing ocean dynamics over the regions and timescales of interest [44]. In the vicinity of coastal areas where the primary drivers of ocean circulation transition rapidly [45], using fine spatial and temporal resolution output is important (figure 6a,b). In the open sea, however, slightly coarser spatial resolution may be less problematic (figures 3a,b and 9). Even so, owing to the consistent poor performance of simulations using monthly (30 days) or half-degree (0.56°) current velocity averages, we recommend that such output not be used in predictions of marine organism dispersal. Indeed, the studies of marine animal movement that have used velocity fields with such coarse resolution should perhaps be revisited [4,5,12–14,16–18,21].
To account for the uncertainty of transport predictions using ocean circulation model output (of any resolution), there are several techniques that will minimize the possibility of reaching unjustified conclusions regarding marine animal dispersal. First, we encourage physical oceanographers collaborating with biologists to provide model output at a resolution of daily snapshots (or finer) to depict the realism needed for studies of marine organism dispersal. Second, comparing particle-tracking predictions to observed drifter trajectories will help quantify uncertainty in the model used and provide a good indication of ocean dynamics in the region of interest. Third, releasing particles under the full range of relevant physical conditions (e.g. not simply at a single day or location) will provide a more representative view of dispersal scenarios. As an example, the predictions of particle transport for a single time and location using coarse model resolution can be wholly inaccurate (figure 4b), whereas particles released across 75 days and tracked for 5 years at least conform to the general pattern of ocean circulation (figure 8c,d). Finally, if experiments require the use of fairly coarse model output (e.g. simulations that span multiple decades), potential uncertainty and errors should be parametrized by performing a subset of simulations with the output of finer resolution models.
Acknowledgements
N.F.P. was supported by North Carolina State University's Initiative for Biological Complexity. R.H. acknowledges research support provided by the National Science Foundation (grant nos OCE-1044573 and OCE-1029841), by the BP/The Gulf of Mexico Research Initiative, and by NOAA/SECOORA.
References
- 1.Nathan R. 2008. An emerging movement ecology paradigm. Proc. Natl Acad. Sci. USA 105, 19 050–19 051 10.1073/pnas.0808918105 (doi:10.1073/pnas.0808918105) [DOI] [PMC free article] [PubMed] [Google Scholar]
- 2.Werner FE, Cowen RK, Paris C. 2007. Coupled biological and physical models: present capabilities and necessary developments for future studies of population connectivity. Oceanography 20, 54–69 10.5670/oceanog.2007.29 (doi:10.5670/oceanog.2007.29) [DOI] [Google Scholar]
- 3.Lehodey P, Senina I, Murtugudde R. 2008. A spatial ecosystem and populations dynamics model (SEAPODYM); modeling of tuna and tuna-like populations. Progr. Oceanogr. 78, 304–318 10.1016/j.pocean.2008.06.004 (doi:10.1016/j.pocean.2008.06.004) [DOI] [Google Scholar]
- 4.Dawson MN, Gupta AS, England MH. 2005. Coupled biophysical global ocean model and molecular genetic analyses identify multiple introductions of cryptogenic species. Proc. Natl Acad. Sci. USA 102, 11 968–11 973 10.1073/pnas.0503811102 (doi:10.1073/pnas.0503811102) [DOI] [PMC free article] [PubMed] [Google Scholar]
- 5.Treml EA, Halpin PN, Urban DL, Pratson LF. 2008. Modeling population connectivity by ocean currents, a graph-theoretic approach for marine conservation. Landscape Ecol. 23, 19–36 10.1007/s10980-007-9138-y (doi:10.1007/s10980-007-9138-y) [DOI] [Google Scholar]
- 6.Bonhommeau S, Le Pape O, Gascuel D, Blanke B, Tréguier A-M, Grima N, Vermard Y, Castonguay M, Rivot E. 2009. Estimates of the mortality and the duration of the trans Atlantic migration of European eel Anguilla anguilla leptocephali using a particle tracking model. J. Fish Biol. 74, 1891–1914 10.1111/j.1095-8649.2009.02298.x (doi:10.1111/j.1095-8649.2009.02298.x) [DOI] [PubMed] [Google Scholar]
- 7.Young CM, et al. 2012. Dispersal of deep-sea larvae from the Intra-American Seas: simulations of trajectories using ocean models. Integr. Comp. Biol. 52, 483–496 10.1093/icb/ics090 (doi:10.1093/icb/ics090) [DOI] [PubMed] [Google Scholar]
- 8.Chassignet EP, Hurlburt HE, Smedstad OM, Halliwell GR, Hogan PJ, Wallcraft AJ, Baraille R, Bleck R. 2007. The HYCOM (HYbrid Coordinate Ocean Model) data assimilative system. J. Mar. Syst. 65, 60–83 10.1016/j.jmarsys.2005.09.016 (doi:10.1016/j.jmarsys.2005.09.016) [DOI] [Google Scholar]
- 9.Hyun KH, He R. 2010. Coastal upwelling in the South Atlantic Bight: a revisit of the 2003 cold event using long term observations and model hindcast solutions. J. Mar. Syst. 83, 1–13 10.1016/j.jmarsys.2010.05.014 (doi:10.1016/j.jmarsys.2010.05.014) [DOI] [Google Scholar]
- 10.Lett C, Verley P, Mullon C, Parada C, Brochier T, Penven P, Blanke B. 2008. A Lagrangian tool for modelling ichthyoplankton dynamics. Environ. Model. Softw. 23, 1210–1214 10.1016/j.envsoft.2008.02.005 (doi:10.1016/j.envsoft.2008.02.005) [DOI] [Google Scholar]
- 11.Cowen RK, Sponaugle S. 2009. Larval dispersal and marine population connectivity. Annu. Rev. Mar. Sci. 1, 443–466 10.1146/annurev.marine.010908.163757 (doi:10.1146/annurev.marine.010908.163757) [DOI] [PubMed] [Google Scholar]
- 12.Scott R, Marsh R, Hays GC. 2012. Life in the really slow lane: loggerhead sea turtles mature late relative to other reptiles. Funct. Ecol. 26, 227–235 10.1111/j.1365-2435.2011.01915.x (doi:10.1111/j.1365-2435.2011.01915.x) [DOI] [Google Scholar]
- 13.Scott R, Marsh R, Hays GC. 2012. A little movement orientated to the geomagnetic field makes a big difference in strong flows. Mar. Biol. 159, 481–488 10.1007/s00227-011-1825-1 (doi:10.1007/s00227-011-1825-1) [DOI] [Google Scholar]
- 14.Monzón-Argüello C, Dell'Amico F, Morinière P, Marco A, Lopéz-Jurado LF, Hays GC, Scott R, Marsh R, Lee PLM. 2012. Lost at sea: genetic, oceanographic and meteorological evidence for storm-forced dispersal. J. R. Soc. Interface 9, 1725–1732 10.1098/rsif.2011.0788 (doi:10.1098/rsif.2011.0788) [DOI] [PMC free article] [PubMed] [Google Scholar]
- 15.Staaterman E, Paris CB, Helgers J. 2012. Orientation behavior in fish larvae: a missing piece of Hjort's critical period hypothesis. J. Theor. Biol. 304, 188–196 10.1016/j.jtbi.2012.03.016 (doi:10.1016/j.jtbi.2012.03.016) [DOI] [PubMed] [Google Scholar]
- 16.Thomson KA, Ingraham WJ, Healey MC, Leblond PH, Groot C, Healey CG. 1992. The influence of ocean currents on latitude of landfall and migration speed of sockeye salmon returning to the Fraser River. Fisheries Oceanogr. 1, 163–179 10.1111/j.1365-2419.1992.tb00035.x (doi:10.1111/j.1365-2419.1992.tb00035.x) [DOI] [Google Scholar]
- 17.Azumaya T, Ishida Y. 2004. An evaluation of the potential influence of SST and currents on the oceanic migration of juvenile and immature chum salmon (Oncorhynchus keta) by a simulation model. Fisheries Oceanogr. 13, 10–23 10.1046/j.1365-2419.2003.00271.x (doi:10.1046/j.1365-2419.2003.00271.x) [DOI] [Google Scholar]
- 18.Bracis C, Anderson JJ. 2012. An investigation of the geomagnetic imprinting hypothesis for salmon. Fisheries Oceanogr. 21, 170–181 10.1111/j.1365-2419.2012.00617.x (doi:10.1111/j.1365-2419.2012.00617.x) [DOI] [Google Scholar]
- 19.Paris CB, Chérubin LM, Cowen RK. 2007. Surfing, spinning, or diving from reef to reef: effects on population connectivity. Mar. Ecol. Progr. Series 347, 285–300 10.3354/meps06985 (doi:10.3354/meps06985) [DOI] [Google Scholar]
- 20.Bleck R. 2002. An oceanic general circulation model framed in hybrid isopycnic cartesian coordinates. Ocean Model. 4, 55–88 10.1016/S1463-5003(01)00012-9 (doi:10.1016/S1463-5003(01)00012-9) [DOI] [Google Scholar]
- 21.Hays GC, Marsh R. 1997. Estimating the age of juvenile loggerhead sea turtles in the North Atlantic. Can. J. Zool. 75, 40–46 10.1139/z97-005 (doi:10.1139/z97-005) [DOI] [Google Scholar]
- 22.Blumenthal JM, et al. 2009. Turtle groups or turtle soup: dispersal patterns of hawksbill turtles in the Caribbean. Mol. Ecol. 18, 4841–4853 10.1111/j.1365-294X.2009.04403.x (doi:10.1111/j.1365-294X.2009.04403.x) [DOI] [PubMed] [Google Scholar]
- 23.Godley BJ, Barbosa C, Bruford M, Broderick AC, Catry P, Coyne MS, Angela F, Hays GC, Witt MJ. 2010. Unraveling migratory connectivity in marine turtles using multiple methods. J. Appl. Ecol. 47, 769–778 10.1111/j.1365-2664.2010.01817.x (doi:10.1111/j.1365-2664.2010.01817.x) [DOI] [Google Scholar]
- 24.Hays GC, Fossette S, Katselidis KA, Mariani P, Schofield G. 2010. Ontogenetic development of migration: Lagrangian drift trajectories suggest a new paradigm for sea turtles. J. R. Soc. Interface 7, 1319–1327 10.1098/rsif.2010.0009 (doi:10.1098/rsif.2010.0009) [DOI] [PMC free article] [PubMed] [Google Scholar]
- 25.Putman NF, Shay TJ, Lohmann KJ. 2010. Is the geographic distribution of nesting in the Kemp's ridley turtle shaped by the migratory needs of offspring? Integr. Comp. Biol. 50, 305–314 10.1093/icb/icq041 (doi:10.1093/icb/icq041) [DOI] [PubMed] [Google Scholar]
- 26.Hamann M, Grech AB, Wolanski E, Lambrechts J. 2011. Modelling the fate of marine turtle hatchlings. Ecol. Model. 222, 1515–1521 10.1016/j.ecolmodel.2011.02.003 (doi:10.1016/j.ecolmodel.2011.02.003) [DOI] [Google Scholar]
- 27.Okuyama J, Kitagawa T, Zenimoto K, Kimura S, Arai N, Sasai Y, Sasaki H. 2011. Trans-Pacific dispersal of loggerhead turtle hatchlings inferred from numerical simulation modeling. Mar. Biol. 158, 2055–2063 10.1007/s00227-011-1712-9 (doi:10.1007/s00227-011-1712-9) [DOI] [Google Scholar]
- 28.Putman NF, Verley P, Shay TJ, Lohmann KJ. 2012. Simulating transoceanic migrations of young loggerhead sea turtles: merging magnetic navigation behavior with an ocean circulation model. J. Exp. Biol. 215, 1863–1870 10.1242/jeb.067587 (doi:10.1242/jeb.067587) [DOI] [PubMed] [Google Scholar]
- 29.Putman NF, Scott R, Verley P, Marsh R, Hays GC. 2012. Natal site and offshore swimming influence fitness and long-distance ocean transport in young sea turtles. Mar. Biol. 159, 2117–2126 10.1007/s00227-012-1995-5 (doi:10.1007/s00227-012-1995-5) [DOI] [Google Scholar]
- 30.Gaspar P, Benson SR, Dutton PH, Réveillére A, Jacob G, Meetoo C, Dehecq A, Fossette S. 2012. Oceanic dispersal of juvenile leatherback turtles: going beyond passive drift modeling. Mar. Ecol. Progr. Series 457, 265–284 10.3354/meps09689 (doi:10.3354/meps09689) [DOI] [Google Scholar]
- 31.Shillinger GL, Di Lorenzo E, Luo H, Bograd SJ, Hazen EL, Bailey H, Spotila JR. 2012. On the dispersal of leatherback turtle hatchlings from Mesoamerican nesting beaches. Proc. R. Soc. B 279, 2391–2395 10.1098/rspb.2011.2348 (doi:10.1098/rspb.2011.2348) [DOI] [PMC free article] [PubMed] [Google Scholar]
- 32.Edwards KP, Hare JA, Werner FE, Blanton BO. 2006. Lagrangian circulation on the southeast US Continental Shelf: implications for larval dispersal and retention. Cont. Shelf Res. 26, 1375–1394 10.1016/j.csr.2006.01.020 (doi:10.1016/j.csr.2006.01.020) [DOI] [Google Scholar]
- 33.Grodsky SA, Lumpkin R, Carton JA. 2011. Spurious trends in global surface drifter currents. Geophys. Res. Lett. 38, L10606, pp. 6 10.1029/2011GL047393 (doi:10.1029/2011GL047393) [DOI] [Google Scholar]
- 34.Fossette S, Putman NF, Lohmann KJ, Marsh R, Hays GC. 2012. A biologists guide to assessing ocean currents: a review. Mar. Ecol. Progr. Series 457, 285–301 10.3354/meps09581 (doi:10.3354/meps09581) [DOI] [Google Scholar]
- 35.Putman NF, Bane JM, Lohmann KJ. 2010. Sea turtle nesting distributions and oceanographic constraints on hatchling migration. Proc. R. Soc. B 277, 3631–3637 10.1098/rspb.2010.1088 (doi:10.1098/rspb.2010.1088) [DOI] [PMC free article] [PubMed] [Google Scholar]
- 36.Lett C, Roy C, Levasseur A, van der Lingen CD, Mullon C. 2006. Simulation and quantification of enrichment and retention processes in the southern Benguela upwelling ecosystem. Fisheries Oceanogr. 15, 363–372 10.1111/j.1365-2419.2005.00392.x (doi:10.1111/j.1365-2419.2005.00392.x) [DOI] [Google Scholar]
- 37.Collard SB, Ogren LH. 1990. Dispersal scenarios for pelagic post-hatchling sea turtles. Bull. Mar. Sci. 47, 233–243 [Google Scholar]
- 38.Wyneken J, Salmon M. 1992. Frenzy and postfrenzy activity in loggerhead, green, and leatherback hatchling sea turtles. Copeia 1992, 478–484 10.2307/1446208 (doi:10.2307/1446208) [DOI] [Google Scholar]
- 39.Davenport J. 1997. Temperature and the life-history strategies of sea turtles. J. Thermal Biol. 22, 479–488 10.1016/S0306-4565(97)00066-1 (doi:10.1016/S0306-4565(97)00066-1) [DOI] [Google Scholar]
- 40.Whelan CI, Wyneken J. 2007. Estimating predation levels and site-specific survival of hatchling loggerhead seaturtles (Caretta caretta) from south Florida beaches. Copeia 2007, 745–754 10.1643/0045-8511(2007)2007[745:EPLASS]2.0.CO;2 (doi:10.1643/0045-8511(2007)2007[745:EPLASS]2.0.CO;2) [DOI] [Google Scholar]
- 41.Belkin IM, Cornillon PC, Sherman K. 2009. Fronts in large marine ecosystems. Progr. Oceanogr. 81, 223–236 10.1016/j.pocean.2009.04.015 (doi:10.1016/j.pocean.2009.04.015) [DOI] [Google Scholar]
- 42.Bane JM, Jr, Dewar WK. 1988. Gulf Stream bimodality and variability downstream of the Charleston bump. J. Geophys. Res. 93, 6695–6710 10.1029/JC093iC06p06695 (doi:10.1029/JC093iC06p06695) [DOI] [Google Scholar]
- 43.Werner FE, Page FH, Lynch DR, Loder JW, Lough RG, Perry RI, Greenberg DA, Sinclair MM. 1993. Influences of mean advection and simple behavior on the distribution of cod and haddock early life stages on Georges Bank. Fisheries Oceanogr. 2, 43–64 10.1111/j.1365-2419.1993.tb00120.x (doi:10.1111/j.1365-2419.1993.tb00120.x) [DOI] [Google Scholar]
- 44.Greenberg DA, Dupont F, Lyard FH, Lynch DR, Werner FE. 2007. Resolution issues in numerical models of oceanic and coastal circulation. Cont. Shelf Res. 27, 1317–1343 10.1016/j.csr.2007.01.023 (doi:10.1016/j.csr.2007.01.023) [DOI] [Google Scholar]
- 45.Sponaugle S, Lee T, Kourafalou V, Pinkard D. 2005. Florida Current frontal eddies and the settlement of coral reef fishes. Limnol. Oceanogr. 50, 1033–1048 10.4319/lo.2005.50.4.1033 (doi:10.4319/lo.2005.50.4.1033) [DOI] [Google Scholar]


