Abstract
Glagov's positive remodelling in the early stages of coronary atherosclerosis often results in plaque rupture and acute events. Because positive remodelling is generally diffused along the epicardial coronary arterial tree, it is difficult to diagnose non-invasively. Hence, the objective of the study is to assess the use of scaling power law for the diagnosis of positive remodelling of coronary arteries based on computed tomography (CT) images. Epicardial coronary arterial trees were reconstructed from CT scans of six Ossabaw pigs fed on a high-fat, high-cholesterol, atherogenic diet for eight months as well as the same number of body-weight-matched farm pigs fed on a lean chow (101.9±16.1 versus 91.5±13.1 kg). The high-fat diet Ossabaw pig model showed diffuse positive remodelling of epicardial coronary arteries. Good fit of measured coronary data to the length–volume scaling power law ( where Lc and Vc are crown length and volume) were found for both the high-fat and control groups (R2 = 0.95±0.04 and 0.99±0.01, respectively). The coefficient, KLV, decreased significantly in the high-fat diet group when compared with the control (14.6±2.6 versus 40.9±5.6). The flow–length scaling power law, however, was nearly unaffected by the positive remodelling. The length–volume and flow–length scaling power laws were preserved in epicardial coronary arterial trees after positive remodelling. KLV < 18 in the length–volume scaling relation is a good index of positive remodelling of coronary arteries. These findings provide a clinical rationale for simple, accurate and non-invasive diagnosis of positive remodelling of coronary arteries, using conventional CT scans.
Keywords: coronary compensatory enlargement, scaling power law, computed tomography
1. Introduction
Coronary artery atherosclerosis remains an important risk factor for increased mortality and morbidity [1]. The early stage of atherosclerosis is often characterized by compensatory diffuse enlargement of both the outer wall of the vessel as well as the lumen (i.e. Glagov's positive remodelling) along the epicardial coronary arterial tree [2]. The positive remodelling may make the plaque vulnerable to rupture and potentially cause subsequent acute events [3].
In order to prevent the progression of positive remodelling (e.g. using statin therapy) [4], an accurate early diagnosis of positive remodelling is required [5]. Although intravascular ultrasound (IVUS) has been used to visualize positive coronary artery remodelling [6], this is an invasive procedure that has inherent risks. With enhancement of image quality, multidetector spiral computed tomography (CT) [7], CT angiography [8] and magnetic resonance imaging [9] have recently been used to assess positive remodelling of coronary arteries. These approaches focused on imaging of plaque burden in terms of coronary vessel-wall thickening, however, which can be affected by various factors (e.g. coronary motion and calcification). Hence, there is a need for a simple, accurate and non-invasive method to quantify positive coronary artery remodelling.
Based on the principle of efficiency (minimum energy hypothesis), we have recently proposed several structure–structure (e.g. length–volume) and function–structure (e.g. flow–length) scaling power laws in normal coronary tree structure and validated these laws theoretically and experimentally [10,11]. Here, a deviation from the power law is proposed to be an index for the diagnosis of positive remodelling. Accordingly, the objective of the study is to show the scaling power laws as sensitive diagnostic indices to assess the extent of positive remodelling in the early stages of coronary atherosclerosis, based on conventional CT scans of epicardial coronary arterial tree. We hypothesize that the length–volume and volume–diameter scaling power laws deviate significantly in the positive remodelling from those in the control, but the flow–area and flow–length scaling power laws are less affected in that myocardial flow decreases only in the presence of a severe focal area stenosis more than 75 per cent [12–14]. To test these hypotheses, we reconstructed the epicardial coronary arterial trees from conventional CT scans of Ossabaw pigs fed on atherogenic diet for eight months as well as body-weight-matched normal farm pigs. The power law form of the length–volume scaling relation is preserved in the Ossabaw pig model of positive remodelling but deviates significantly from the theoretical prediction. This provides a rationale for diagnosis of positive remodelling of coronary arteries using conventional coronary CT images.
2. Methods
2.1. Study design
We evaluated six Ossabaw pigs fed on a high-fat, high-cholesterol, atherogenic diet (i.e. high-fat diet group) as well as the same number of body-weight-matched farm pigs fed on a lean chow (i.e. control group). Ossabaw pigs with an initial body weight of 41.7±1.9 kg (mean±s.d. values) were fed on a high-fat, high-cholesterol, atherogenic diet for eight months. The high-fat atherogenic diet was composed of 6–8% kcal from proteins, 19 per cent kcal from complex carbohydrates, and 46–75% kcal from hydrogenated soya bean oil (predominantly trans fatty acids), and 2 per cent cholesterol and 0.7 per cent cholate by weight. These Ossabaw pigs weighed 101.9±16.1 kg after eight months of high-fat diet when they were euthanized. Ossabaw pigs had less than 10 per cent increase in body weight, however, when only fed on a lean chow for eight months [15]. Hence, weight-matched farm pigs fed on a lean chow were selected as the control group (mean±s.d. values: 91.5±13.1 kg) to match the body weight of the high-fat diet group.
2.2. Animal preparation and imaging acquisition
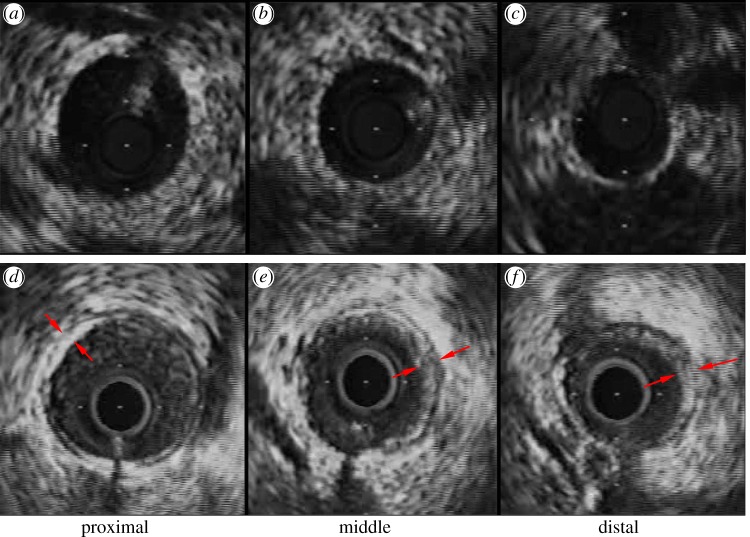
The animal preparation was similar to that described previously [14,16]. At a scheduled time, surgical anaesthesia was induced with TKX (telazol 500 mg, ketamine 250 mg, xylazine 250 mg) and maintained with 2 per cent isoflurane. The animals were intubated and ventilated with room air and oxygen by a respiratory pump. The femoral artery was cannulated with a 7 Fr introducer sheath and after full anticoagulation with heparin (100 IU kg−1), a 6 Fr guiding catheter (Mach 1, HS SH, Boston Scientific, MA, USA) was advanced over a 0.035″ guide wire into the selected coronary artery. The animals received 200 μg of intracoronary nitroglycerin before advancing the IVUS catheter. A 3.6 Fr, 40-MHz coronary imaging catheter (Atlantis SR Pro, Boston Scientific) was advanced over a 0.014″ guide wire and positioned in the distal portion of the coronary arterial tree where the vessel had a diameter of approximately 1.5 mm. An automatic and continuous pullback (0.5 mm s−1) was performed to the proximal portion, allowing visualization of the main trunk of coronary arterial tree. IVUS images were recorded on S-VHS videotape, digitized and analysed off-line using NIS-Elements AR 3.2 software (Nikon, Japan). IVUS measurements at proximal, middle and distal sites along the main trunk of the left anterior descending (LAD) artery were shown in figure 1a–c for a control pig and figure 1e,f for a high-fat diet pig.
Figure 1.
IVUS measurements at (a,d) proximal, (b,e) middle and (c,f) distal sites along the main trunk of the LAD artery for (a–c) control and (d–f) high-fat diet. Arrows refer to the plaques. (Online version colour.)
After a midline sternotomy was performed, the animals were then deeply anaesthetized by an injection of a saturated KCl solution through the jugular vein to arrest the heart in diastole. The aorta was clamped to keep air bubbles from entering the coronary arteries, and the heart was excised and placed in a saline solution.
The LAD, the left circumflex (LCX) and the right coronary arteries (RCAs) were cannulated under saline to avoid air bubbles and perfused with cardioplegic solution to flush out the blood. The major arteries were perfused at a pressure of 100 mmHg with Microfil (MV-112, MV-117 and MV-130, Flow Tech) mixed with Cab-O-Sil to block the capillaries, resulting in the filling of only the arterial tree down to pre-capillary levels. After the Microfil was allowed to harden for 45–60 min, the hearts were kept in the refrigerator in saline solution until the day of the CT scan. Scans were made axially (120 mAs, 120 kV, 0.6 × 0.6 × 1.0 mm) on a 16-slice scanner (Siemens Somatom Sensation 16), resulting in approximately 200 slices of 512 × 512 pixels each.
2.3. Reconstruction of coronary arterial trees
As shown in figure 2, the morphometry (i.e. cross-sectional area (CSA) and length) of the epicardial coronary arterial trees (i.e. LAD, LCX and RCA trees) was extracted from CT scans of both high-fat diet and control groups by an experimentally validated software package [17,18]. The algorithm has been validated by optical measurements with a r.m.s. error of 0.16 mm (less than 10% of the mean value) and an average deviation of 0.13 mm [17].
Figure 2.
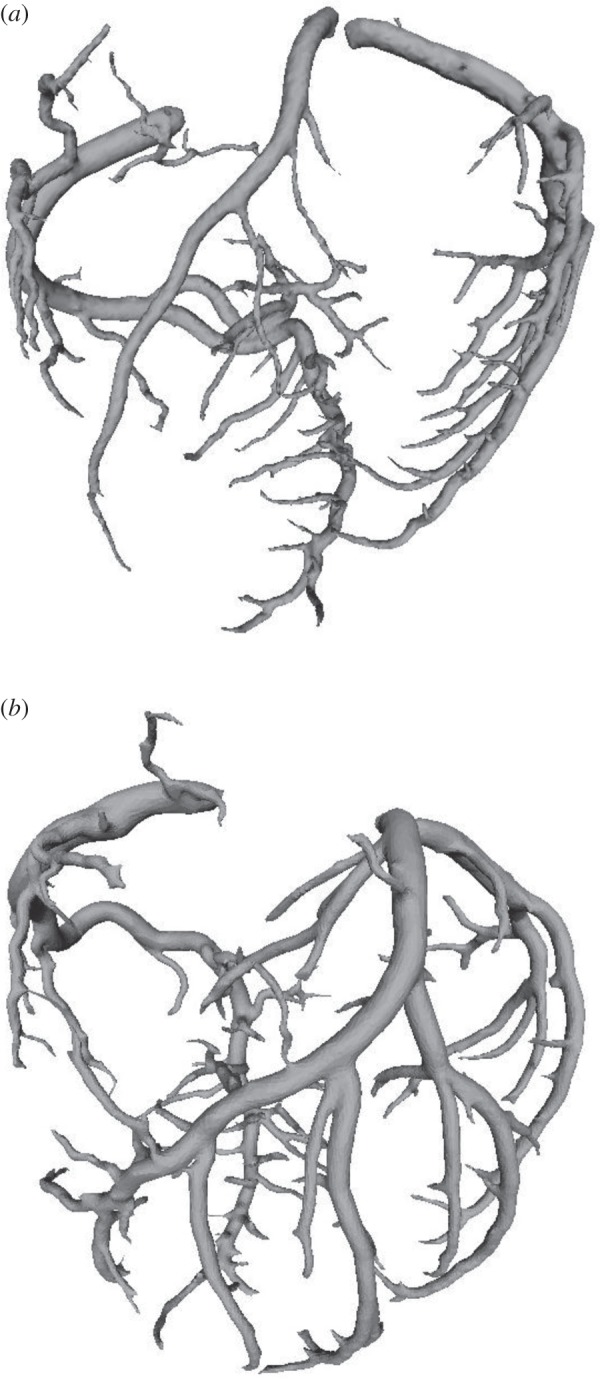
Schematic of epicardial coronary arterial trees for (a) control and (b) high-fat diet reconstructed from CT scans.
2.4. Scaling power laws
We have validated several scaling power laws in normal vascular trees for various organs and species [10,11]. To derive the scaling power laws, we first defined a proximal vessel segment as a stem, and the tree distal to the stem as a crown. A tree structure (i.e. the epicardial coronary arterial tree) has many stem–crown units, as shown in figure 3. In a stem–crown unit, the crown volume (Vc; ml) is defined as the sum of the intravascular volume of each vessel segment, and the crown length (Lc; cm) is defined as the sum of the lengths of each vessel segment in the crown from the stem to the most distal vessels. Here, the smallest stem–crown unit corresponds to a terminal bifurcation (i.e. stemn and crownn in figure 3) of epicardial coronary arterial tree obtained from CT scans with the diameter of terminal vessels approximately equal to 1 mm (slightly larger than resolution of CT).
Figure 3.
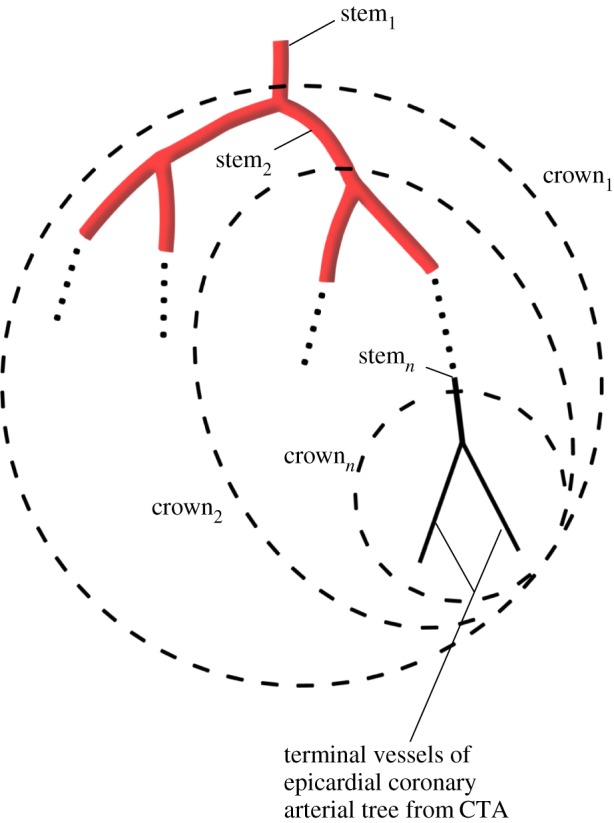
Schematic of the definition of stem–crown units in the epicardial coronary arterial tree. Three stem–crown units are shown successively (1, 2 and n), with the smallest unit corresponding to a terminal bifurcation (i.e. stemn and crownn) of the epicardial coronary arterial tree obtained from CT scans. (Online version in colour.)
Two unique structure–structure scaling relations were used in this study, i.e. length–volume (i.e.  ) and volume–diameter (i.e.
  ) scaling power laws, where
  is the diameter of a stem vessel and As (cm2) is the CSA of the stem and, KLV and KVD are constants. Moreover, we tested two function–structure scaling relations, i.e. flow–area (i.e.
  ) and flow–length (i.e. Qs = KQLLc) scaling power laws, where Qs (ml s−1) is the flow rate in a stem vessel, and KQA and KQL are constants. Two parameters in a stem–crown unit are a data pair (e.g. Lc versus Vc for the length–volume scaling power law and Qs versus Lc for the flow–length scaling power law). The data pairs for all stem–crown units in a tree structure (mean±s.d. values: 94±43 for the high-fat diet group and 53±12 for the control group) are fitted to the respective scaling law to determine the coefficient and exponent.
2.5. Structure and flow analysis
We can directly determine coefficients and exponents of the structure–structure scaling power laws for the epicardial coronary arterial tree of each animal reconstructed from CT images, but not those for the function–structure scaling power laws given that coronary flow rates are not measured. Here, the flow rates were calculated based on a full coronary arterial tree haemodynamic analysis [19]. Briefly, the entire LAD, LCX and RCA trees down to the first capillary bifurcations have been reconstructed [20], based on pig morphometric data [21]. The crown resistance distal to each vessel of the entire coronary arterial tree was computed similar to a previous study [19]. A search was then made to find a vessel whose diameter was the closest to the diameter of each terminal of the epicardial coronary arterial trees for animals in both high-fat diet and control groups so that the crown resistance can be pasted to the corresponding terminal. Given the resistance distal to each terminal, we computed the flow rate in each vessel of epicardial coronary arterial trees [19] and determined coefficients and exponents of function–structure scaling power laws for animals in both groups. The basic assumption is that the microvasculature distal to terminal vessels of the epicardial coronary arterial tree is anatomically unchanged in the high-fat diet group.
2.6. Data analysis
For each epicardial coronary arterial tree, we determined the following parameters: (i) both coefficient K0 and exponent X in a power-law relation of M = K0 · YX (defined as two-parameter model), (ii) coefficient K as exponent X was set equal to the theoretical values (i.e. 7/9, 3, 7/6 and 1 for length–volume, volume–diameter, flow–area and flow–length scaling power laws, respectively) in a power-law relation of M = K · Ytheoretical value (defined as one-parameter model), by a least-square fitting method. The mean and standard deviation was also computed by averaging over arterial trees. The per cent difference was computed as  and
and  in the two-parameter model and
  in the one-parameter model. Two-way ANOVA (SigmaStat v. 3.5) was used to compare the structure–structure and function–structure scaling power laws between high-fat diet and control, whereas one-way ANOVA (SigmaStat v. 3.5) was used to compare coefficients in the high-fat diet group with those in the control group, where p-value less than 0.05 represented statistically significant differences.
3. Results
IVUS measurements made along the main trunk of the LAD artery showed an increase in both internal elastic lamina CSA (i.e. increased wall area) and lumen CSA in Ossabaw pig model when compared with the control (figure 1e,f versus figure 1a–c). There was a layer of eccentric plaque in coronary arteries of Ossabaw pigs.
For the structure–structure scaling relations, table 1 summarizes mean±s.d. values (averaged over arterial trees) of coefficients and exponents for the length–volume and volume–diameter scaling power laws, which show significant differences between high-fat diet and control groups. Figure 4 shows a log–log plot of stem diameter and normalized crown volume for all data of epicardial coronary arterial trees of control (square symbols) and high-fat diet (triangle symbols) groups. To compare lumen diameters between the two groups, the crown volumes were normalized by the sum of the intravascular volume of each vessel segment in the respective epicardial coronary arterial tree reconstructed from CT scans. The thick and thin solid lines represent the least-square fit of all the measurements to the volume–diameter scaling power law for control (R2 = 0.15) and high-fat diet groups (R2 = 0.93), respectively.
Table 1.
Coefficients and exponents for length–volume and volume–diameter scaling power laws in epicardial coronary arterial trees of high-fat diet and control groups. The values were mean±s.d. (averaged over arterial trees). One-way ANOVA was used to compare coefficients between the high-fat diet and control groups.
| scaling power laws |
high-fat diet (n = 6) | control (n = 6) | per cent difference (%) | p-value | |
|---|---|---|---|---|---|
| least-squares fit of both K0 and X values (two-parameter model) | |||||
| length–volume scaling law (Lc = K0LVVcXLV) | K0LV | 17.0±4.6 | 38.8±11.2 | −56.1 | <0.05 |
| XLV | 0.91±0.10 | 0.73±0.07 | 24.3 | <0.05 | |
| R2 | 0.95±0.04 | 0.99±0.01 | |||
| volume–diameter scaling law (Vc = K0VDDsXVD) | K0VD | 3198±5591 | 23.3±11.8 | 13 644 | <0.05 |
| XVD | 4.43±2.23 | 3.28±0.32 | 35.0 | <0.05 | |
| R2 | 0.20±0.17 | 0.94±0.02 | |||
| least-squares fit of K values with X equal to theoretical values (one-parameter model) | |||||
| length–volume scaling law (Lc = KLVVc7/9) | KLV | 14.6±2.6 | 40.9±5.6 | −64.3 | <0.05 |
| R2 | 0.95±0.04 | 0.99±0.01 | |||
| volume–diameter scaling law (Vc = KVDDs3) | KVD | 24.0±7.9 | 9.5±1.6 | 151 | <0.05 |
| R2 | 0.20±0.17 | 0.94±0.02 | |||
Figure 4.
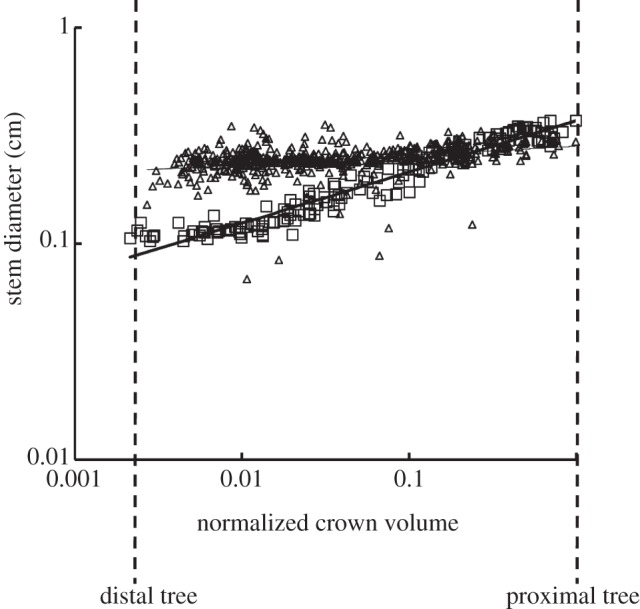
A log–log plot of stem diameter (Ds) versus normalized crown volume (Vc/Vcmax) for all data of epicardial coronary arterial trees of the control (square symbols) and high-fat diet (triangle symbols) groups, where Vcmax is the sum of the intravascular volume of each vessel segment in an entire epicardial coronary arterial tree reconstructed from CT scans. The thick and thin solid lines represent the least-square fit of all the measurements to the volume–diameter scaling power law for the control (R2 = 0.15) and high-fat diet groups (R2 = 0.93), respectively.
Figure 5a,b shows log–log plots of crown length versus crown volume for all data of epicardial coronary arterial trees of control and high-fat diet groups, respectively. The thick solid lines represent the least-square fit of all the measurements in the control group to the length–volume scaling power law ( R2 = 0.99), whereas the thin solid line refers to the least-square fit of all the measurements in the high-fat diet group to the scaling power law (
 R2 = 0.91). All KLV values in the high-fat diet group were less than 18, whereas those in the control group were more than 36. Moreover, a parameter (deviationL) is defined as
  with
with  as shown in figure 5. Figure 6 shows a plot of deviationL versus crown volume (square markers for the control group and triangle markers for the high-fat diet group). The distal coronary arteries have larger deviationL values than the proximal arteries in the high-fat diet group albeit the maximal values occur at some middle side branches.
Figure 5.
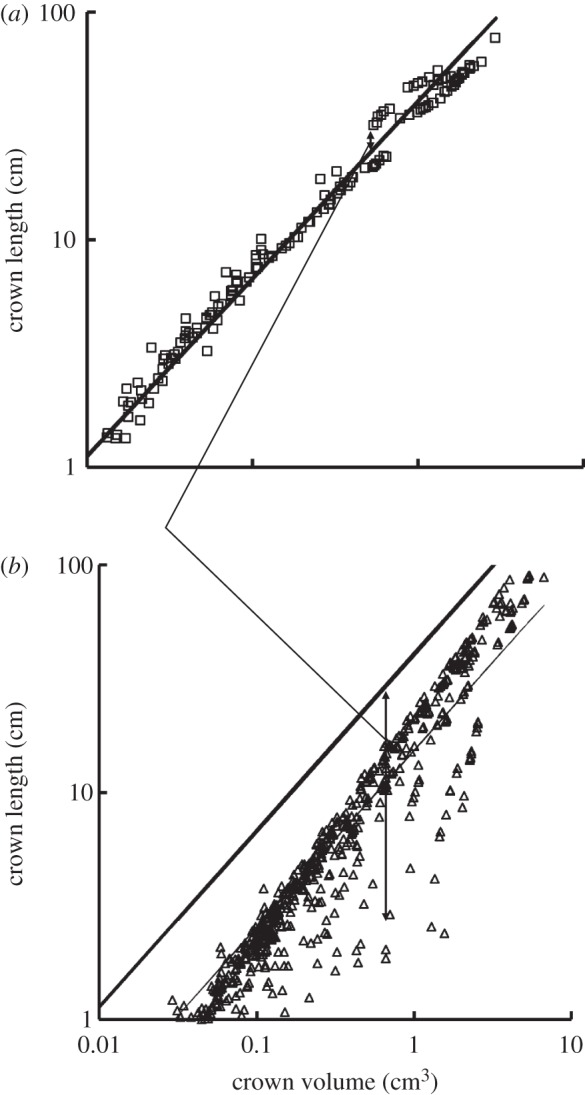
A log–log plot of crown length (Lc) versus crown volume (Vc) for all data of epicardial coronary arterial trees of the (a) control (square symbols) and (b) high-fat diet (triangle symbols) groups. The thick solid lines represent the least-square fit of all the measurements in the control group to the length–volume scaling power law ( , R2 = 0.99), whereas the thin solid line refers to the least-square fit of all the measurements in the high-fat diet group to the length–volume scaling power law (
 , R2 = 0.91). Two-way ANOVA was used to compare all the measurements between the high-fat diet and control groups, which show significant difference (p-value <0.05).
Figure 6.
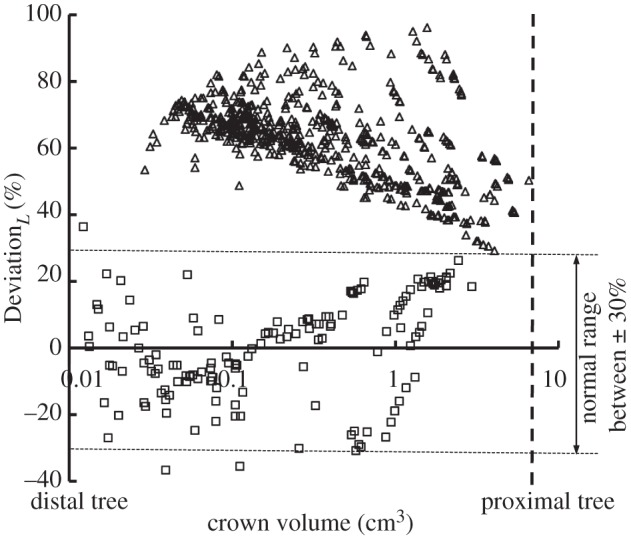
A plot of deviationL versus crown volume (Vc) (square symbols for control group and triangle symbols for high-fat diet group) in correspondence to figure 5, where  with
with  .
.
For the function–structure scaling power laws, table 2 shows mean±s.d. values (averaged over the arterial trees) of coefficients and exponents for the flow–area and flow–length power laws, which show no significant difference between high-fat diet and control groups. Figure 7a,b shows log–log plots of stem flow versus crown length for all data of epicardial coronary arterial trees of control and high-fat diet groups, respectively. The thick solid lines represent the least-square fit of all the measurements in the control group to the flow–length scaling power law (Qs = 2.68 × 10⁻² × Lc, R2 = 0.89), whereas the thin solid line refers to the least-square fit of all the measurements in the high-fat diet group to the scaling power law (Qs = 2.15 × 10⁻² × Lc, R2 = 0.93).
Table 2.
Coefficients and exponents for flow–area and flow–length scaling power laws in epicardial coronary arterial trees of high-fat diet and control groups. The values were mean±s.d. (averaged over arterial trees). One-way ANOVA was used to compare coefficients between the high-fat diet and control groups.
| scaling power laws |
high-fat diet (n = 6) | control (n = 6) | per cent difference (%) | p-value | |
|---|---|---|---|---|---|
| least-squares fit of both K0 and X values (two-parameter model) | |||||
flow–area scaling law ( ) ) |
 |
4.02±2.75 | 5.62±1.16 | −28.4 | =0.21 |
| XQA | 1.05±0.24 | 1.16±0.09 | −9.7 | =0.29 | |
| R2 | 0.66±0.07 | 0.94±0.01 | |||
flow–length scaling law ( ) ) |
 |
2.28±0.35 (×10–2) | 3.17±0.67 (×10–2) | −28.0 | =0.14 |
| XQL | 0.90±0.07 | 0.79±0.06 | 13.5 | =0.05 | |
| R2 | 0.91±0.08 | 0.91±0.02 | |||
| least-squares fit of K values with X equal to theoretical values (one-parameter model) | |||||
flow–area scaling law ( ) ) |
 |
4.59±0.56 | 6.00±0.91 | −23.5 | =0.09 |
| R2 | 0.66±0.07 | 0.94±0.01 | |||
| flow–length scaling law (Qs = KQLLc) | KQL | 2.03±0.34 (×10–2) | 2.58±0.56 (×10–2) | −21.2 | =0.25 |
| R2 | 0.91±0.08 | 0.91±0.02 | |||
Figure 7.
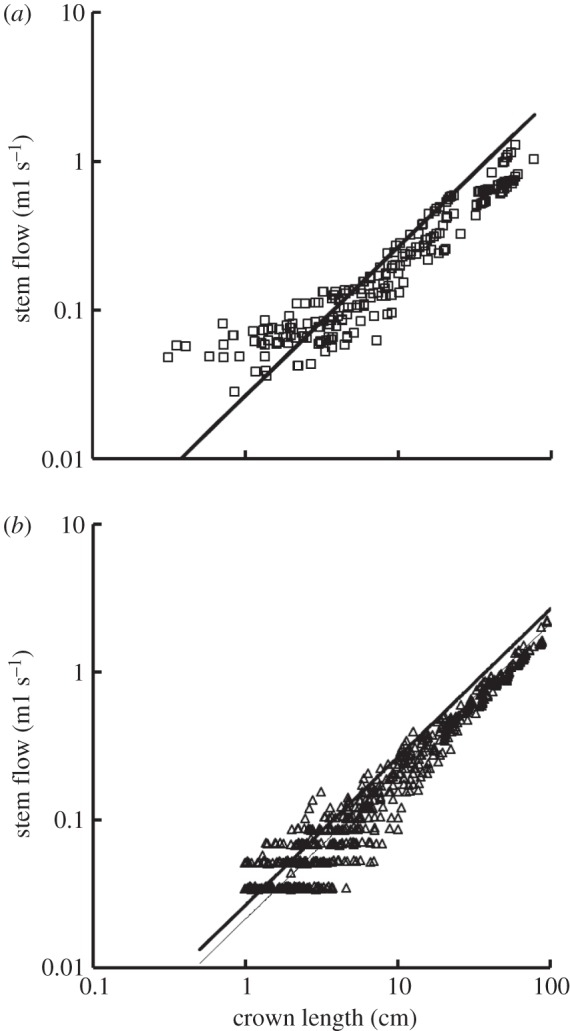
A log–log plot of stem flow (Qs) versus crown length (Lc) for all data of epicardial coronary arterial trees of the (a) control (square symbols) and (b) high-fat diet (triangle symbols) groups. The thick solid lines represent the least-square fit of all the measurements in the control group to the flow–length scaling power law (Qs = 2.68 × 10⁻² × Lc, R2 = 0.89), whereas the thin solid line refers to the least-square fit of all the measurements in the high-fat diet group to the flow–length scaling power law (Qs = 2.15 × 10⁻² × Lc, R2 = 0.93). Two-way ANOVA was used to compare all the measurements between the high-fat diet and control groups, which show no significant difference (p-value = 0.20).
4. Discussion
The major finding is that the positive remodelling of coronary arteries had significantly decreased KLV value for the length–volume scaling power law as:  but preserved KQA and KQL values for the function–structure scaling power laws as:
  and Qs = KQLLc, respectively. This illustrates that a significant decrease in coefficient KLV for the length–volume scaling power law in the epicardial coronary arterial tree may be an index for the diagnosis of positive remodelling in the early stages of coronary atherosclerosis.
4.1. Morphometry of epicardial coronary arterial tree
The findings in figure 1 of increased wall area and lumen area at the early stages of plaque development suggest positive remodelling in epicardial coronary arterial trees of Ossabaw pigs fed on a high-fat, high-cholesterol, atherogenic diet for eight months. These findings are consistent with the Glagov phenomena shown in human autopsy studies [2]. Moreover, we reconstructed epicardial coronary arterial trees of Ossabaw and farm pigs from CT images using an experimentally validated algorithm [17,18], as shown in figure 3. The lumen size in middle and distal vessels of epicardial coronary arterial tree of the high-fat group was significantly larger than that in the controls, as shown in figure 4. There was also significant difference of the summed intravascular volume of each vessel segment of the entire epicardial coronary arterial tree (p-value < 0.05) between the high-fat diet and control groups (5.84±2.84 ml versus 3.17±0.32 ml), but not for the summed segment length (p-value = 0.97).
4.2. Structure–structure scaling power laws
We derived the theoretical exponent of structure–structure scaling power laws in the stem–crown system of a tree structure, which were validated in vascular trees of various organs, including the heart, lung, mesentery, muscle and eye of different species [10,11]. Here, the length–volume and volume–diameter scaling power laws still hold for the epicardial coronary arterial tree in the control group, as shown in figures 4 and 5. The two scaling power laws had exponents of 0.73±0.07 (R2 = 0.99±0.01) and 3.28±0.32 (R2 = 0.94±0.02; table 1), which agreed reasonably well with the theoretical values of 0.78 and 3. Other studies also show support for the theoretical predictions of the structure–structure scaling power laws in normal human epicardial coronary arterial trees [22,23].
4.3. Scaling diagnosis of positive remodelling
A least-square fit of morphometric data in the high-fat diet group to the power-law relation in the two-parameter model showed that both exponents (X) and coefficients (K0) vary substantially in range (table 1). The interaction of the exponent and coefficient in the power-law relation may complicate the diagnosis. Hence, we selected the one-parameter model for the diagnosis, where the coefficient was determined by a least-square fit to the power-law relation as exponent X was set equal to the theoretical value.
The data in the high-fat diet group had a poor fit to the volume–diameter scaling power law (R2 = 0.20±0.17 averaged over arterial trees in table 1 and R2 = 0.15 for a least-square fit to all the measurements in figure 4) albeit those in the control group had very high correlations (R2 = 0.94±0.02). This is caused by the positive remodelling of lumen CSA in different vessels of the epicardial coronary arterial tree without corresponding changes in crown length, as shown in figures 2b and 4. On the other hand, the length–volume scaling power law showed good fit to the experimental measurements (R2 ≥ 0.94) in both the high-fat diet and control groups, whereas KLV values in the high-fat diet group were significantly less than those in the control group, as shown in table 1 and figure 5. The integrated crown volume and length (i.e. the sum of the intravascular volume or length of each vessel segment in a crown) provided a good fit to the experimental measurements in the high-fat diet group. The per cent difference of KLV between the high-fat diet and control groups was 64.3 per cent. In particular, all KLV values in the high-fat diet group were less than 18, whereas those in the control group were more than 36. Therefore, a significant decrease in the KLV value can be a good index for the diagnosis of positive remodelling in the early stages of coronary atherosclerosis, which should be evaluated in future human studies.
4.4. Function–structure scaling power laws
In addition to the structure–structure scaling power laws, we also verified the function–structure scaling power laws [10,11]. Here, coefficients and exponents between the high-fat diet and control groups showed no significant difference, as illustrated in table 2. The function–structure scaling power laws reflect the design of biological trees for flow transport under the principle of minimum energy [11]. The preservation of the scaling power laws suggests that positive remodelling still maintains the same general principle in the early stages of coronary atherosclerosis. Unlike the structure–structure scaling power laws, the function–structure scaling power laws cannot be used to diagnose positive remodelling given the similarity between the control and high-fat diet groups. Clearly, an increase in the severity of stenosis in the progression of negative remodelling of coronary atherosclerosis will eventually cause the breakdown of the function–structure scaling power laws once the flow rate decreases significantly in severe lesions (e.g. area stenosis greater than or equal to 75%).
4.5. Limitations of the study
Because an Ossabaw mini-pig does not grow on a lean chow, farm pigs, fed on a lean chow but having the same body weight as high-fat diet Ossabaw pigs, were selected as the control group despite the species differences, which are likely to be small. Furthermore, the scaling power laws during the transition from positive remodelling [2] to diffuse coronary artery disease [24], however, remain unknown. Future studies are needed to determine the changes of scaling power laws during the process of coronary atherosclerosis. Finally, the function–structure scaling power laws should be validated by accurate measurements of flow rates in epicardial coronary arteries given that the present results are computationally estimated.
4.6. Summary and significance
The CT and haemodynamic analyses show that the length–volume and function–structure scaling power laws are preserved albeit the volume–diameter scaling power law breaks down in the epicardial coronary arterial tree of the high-fat diet animal model. The coefficient of the length–volume scaling power law in the high-fat diet group has a significant deviation from the controls. Hence, the length–volume scaling power law can serve as a quantitative measure of positive remodelling in the early stages of coronary atherosclerosis using standard CT images. The function–structure scaling power laws obeying the principle of minimum energy are unaffected, however, by the positive remodelling. This study provides a clinical rationale for simple, accurate and non-invasive diagnosis of positive remodelling of coronary arteries.
Acknowledgements
All animal experiments were performed in accordance with national and local ethical guidelines, including the Institute of Laboratory Animal Research Guide, Public Health Service policy, Animal Welfare Act and Indiana University–Purdue University, Indianapolis policies regarding the use of animals in research.
This study is supported in part by the National Institute of Health-National Heart, Lung and Blood Institute grant no. HL-092048 (G.S.K.) and the American Heart Association Scientist Development grant no. 0830181N (Y.H.).
References
- 1.Lloyd-Jones D, et al. 2010. Heart disease and stroke statistics: 2010 update. A report from the American Heart Association. Circulation 121, e46–e215 10.1161/circulationaha.109.192667 (doi:10.1161/circulationaha.109.192667) [DOI] [PubMed] [Google Scholar]
- 2.Glagov S, Weisenberg E, Zarins CK, Stankunavicius R, Kolettis GJ. 1987. Compensatory enlargement of human atherosclerotic coronary arteries. N. Engl. J. Med. 316, 1371–1375 10.1056/NEJM198705283162204 (doi:10.1056/NEJM198705283162204) [DOI] [PubMed] [Google Scholar]
- 3.Varnava AM, Mills PG, Davies MJ. 2002. Relationship between coronary artery remodeling and plaque vulnerability. Circulation 105, 939–943 10.1161/hc0802.104327 (doi:10.1161/hc0802.104327) [DOI] [PubMed] [Google Scholar]
- 4.Suzuki M, Saito M, Nagai T, Saeki H, Kazatani Y. 2006. Prevention of positive coronary artery remodeling with statin therapy in patients with coronary artery diseases. Angiology 57, 259–265 10.1177/000331970605700301 (doi:10.1177/000331970605700301) [DOI] [PubMed] [Google Scholar]
- 5.Chikwe J, Kim M, Goldstone AB, Fallahi A, Athanasiou T. 2010. Current diagnosis and management of left main coronary disease. Eur. J. Cardiothorac. Surg. 38, 420–430 10.1016/j.ejcts.2010.03.003 (doi:10.1016/j.ejcts.2010.03.003) [DOI] [PubMed] [Google Scholar]
- 6.Ge J, Erbel R, Zamorano J, Koch L, Kearney P, Gorge G, Gerber T, Meyer J. 1993. Coronary artery remodeling in atherosclerotic disease: an intravascular ultrasonic study in vivo. Coron. Artery Dis. 4, 981–986 10.1097/00019501-199311000-00005 (doi:10.1097/00019501-199311000-00005) [DOI] [PubMed] [Google Scholar]
- 7.Achenbach S, et al. 2004. Assessment of coronary remodeling in stenotic and nonstenotic coronary atherosclerotic lesions by multidetector spiral computed tomography. J. Am. Coll. Cardiol. 43, 842–847 10.1016/j.jacc.2003.09.053 (doi:10.1016/j.jacc.2003.09.053) [DOI] [PubMed] [Google Scholar]
- 8.Rinehart S, Qian Z, Vazquez G, Joshi PH, Kirkland B, Bhatt K, Marvasty I, Christian K, Voros S. 2012. Demonstration of the Glagov phenomenon in vivo by CT coronary angiography in subjects with elevated Framingham risk. Int. J. Cardiovasc. Imaging 28, 1589–1599 10.1007/s10554-011-9979-y (doi:10.1007/s10554-011-9979-y) [DOI] [PubMed] [Google Scholar]
- 9.Miao C, et al. 2009. Positive remodeling of the coronary arteries detected by magnetic resonance imaging in an asymptomatic population: MESA (multi-ethnic study of atherosclerosis). J. Am. College Cardiol. 53, 1708–1715 10.1016/j.jacc.2008.12.063 (doi:10.1016/j.jacc.2008.12.063) [DOI] [PMC free article] [PubMed] [Google Scholar]
- 10.Huo Y, Kassab GS. 2009. A scaling law of vascular volume. Biophys. J. 96, 347–353 10.1016/j.bpj.2008.09.039 (doi:10.1016/j.bpj.2008.09.039) [DOI] [PMC free article] [PubMed] [Google Scholar]
- 11.Huo Y, Kassab GS. 2012. Intraspecific scaling laws of vascular trees. J. R. Soc. Interface 9, 190–200 10.1098/rsif.2011.0270 (doi:10.1098/rsif.2011.0270) [DOI] [PMC free article] [PubMed] [Google Scholar]
- 12.Uren NG, Melin JA, De Bruyne B, Wijns W, Baudhuin T, Camici PG. 1994. Relation between myocardial blood flow and the severity of coronary-artery stenosis. N. Engl. J. Med. 330, 1782–1788 10.1056/NEJM199406233302503 (doi:10.1056/NEJM199406233302503) [DOI] [PubMed] [Google Scholar]
- 13.Gould KL. 2009. Does coronary flow trump coronary anatomy? J. Am. Coll. Cardiol. Imaging 2, 1009–1023 10.1016/j.jcmg.2009.06.004 (doi:10.1016/j.jcmg.2009.06.004) [DOI] [PubMed] [Google Scholar]
- 14.Huo Y, Svendsen M, Choy JS, Zhang Z-D, Kassab GS. 2012. A validated predictive model of coronary fractional flow reserve. J. R. Soc. Interface 9, 1325–1338 10.1098/rsif.2011.0605 (doi:10.1098/rsif.2011.0605) [DOI] [PMC free article] [PubMed] [Google Scholar]
- 15.Fullenkamp AM, et al. 2011. Effect of different obesogenic diets on pancreatic histology in Ossabaw miniature swine. Pancreas 40, 438–443 10.1097/MPA.0b013e3182061583 (doi:10.1097/MPA.0b013e3182061583) [DOI] [PMC free article] [PubMed] [Google Scholar]
- 16.Huo Y, Kassab GS. 2012. Compensatory remodeling of coronary microvasculature maintains shear stress in porcine left-ventricular hypertrophy. J. Hypertens. 30, 608–616 10.1097/HJH.0b013e32834f44dd (doi:10.1097/HJH.0b013e32834f44dd) [DOI] [PubMed] [Google Scholar]
- 17.Wischgoll T, Choy JS, Ritman EL, Kassab GS. 2008. Validation of image-based method for extraction of coronary morphometry. Ann. Biomed. Eng. 36, 356–368 10.1007/s10439-008-9443-x (doi:10.1007/s10439-008-9443-x) [DOI] [PubMed] [Google Scholar]
- 18.Wischgoll T, Choy JS, Kassab GS. 2009. Extraction of morphometry and branching angles of porcine coronary arterial tree from CT images. Am. J. Physiol. Heart Circ. Physiol. 297, H1949–H1955 10.1152/ajpheart.00093.2009 (doi:10.1152/ajpheart.00093.2009) [DOI] [PMC free article] [PubMed] [Google Scholar]
- 19.Huo Y, Kassab GS. 2006. Pulsatile blood flow in the entire coronary arterial tree: theory and experiment. Am. J. Physiol. Heart Circ. Physiol. 291, H1074–H1087 10.1152/ajpheart.00200.2006 (doi:10.1152/ajpheart.00200.2006) [DOI] [PubMed] [Google Scholar]
- 20.Mittal N, Zhou Y, Ung S, Linares C, Molloi S, Kassab GS. 2005. A computer reconstruction of the entire coronary arterial tree based on detailed morphometric data. Ann. Biomed. Eng. 33, 1015–1026 10.1007/s10439-005-5758-z (doi:10.1007/s10439-005-5758-z) [DOI] [PubMed] [Google Scholar]
- 21.Kassab GS, Rider CA, Tang NJ, Fung YC. 1993. Morphometry of pig coronary arterial trees. Am. J. Physiol. 265, H350–H365 [DOI] [PubMed] [Google Scholar]
- 22.Seiler C, Kirkeeide RL, Gould KL. 1992. Basic structure–function relations of the epicardial coronary vascular tree. Basis of quantitative coronary arteriography for diffuse coronary artery disease. Circulation 85, 1987–2003 10.1161/01.CIR.85.6.1987 (doi:10.1161/01.CIR.85.6.1987) [DOI] [PubMed] [Google Scholar]
- 23.Craiem D, Casciaro ME, Graf S, Gurfinkel EP, Armentano RL. 2011. Non-invasive assessment of allometric scaling laws in the human coronary tree. Artery Res. 5, 15–23 10.1016/j.artres.2010.09.002 (doi:10.1016/j.artres.2010.09.002) [DOI] [Google Scholar]
- 24.Stone GW, et al. 2011. A prospective natural-history study of coronary atherosclerosis. N. Engl. J. Med. 364, 226–235 10.1056/NEJMoa1002358 (doi:10.1056/NEJMoa1002358) [DOI] [PubMed] [Google Scholar]


