SUMMARY
Identifying coagulation abnormalities in patients with combined bleeding and thrombosis history is clinically challenging. Our goal was to probe the complexity of dysregulated coagulation in humans by characterizing pathophysiologic mechanisms in a patient with both bleeding and thrombosis. The patient is a 56-year old female with a history of hematomas, poor wound healing, and thrombosis (retinal artery occlusion and transient cerebral ischemia). She had a normal activated partial thromboplastin time, prolonged thrombin and reptilase times, and decreased functional and antigenic fibrinogen levels, and was initially diagnosed with hypodysfibrinogenemia. This diagnosis was supported by DNA analysis revealing a novel FGB mutation (c.656A>G) predicting a Q189R mutation in the mature Bβ chain that was present in the heterozygote state. However, turbidity analysis showed that purified fibrinogen polymerization and degradation were indistinguishable from normal, and Bβ chain subpopulations appeared normal by two-dimensional difference in-gel electrophoresis, indicating the mutated chain was not secreted. Interestingly, plasma thrombin generation testing revealed the patient’s thrombin generation was higher than normal and could be attributed to elevated levels of factor VIII (FVIII, 163-225%). Accordingly, in an arterial injury model, hypofibrinogenemic mice (Fgn+/−) infused with FVIII demonstrated significantly shorter vessel occlusion times than saline-infused Fgn+/− mice. Together, these data associate the complex bleeding and thrombotic presentation with combined hypofibrinogenemia plus plasma hypercoagulability. These findings suggest previous cases in which fibrinogen abnormalities have been associated with thrombosis may also be complicated by co-existing plasma hypercoagulability and illustrate the importance of “global” coagulation testing in patients with compound presentations.
Keywords: thrombin generation, factor VIII, hypofibrinogenemia, thrombosis, bleeding
INTRODUCTION
Identifying coagulopathies in patients with a history of both bleeding and thrombosis is clinically challenging due to complex, interacting components during blood coagulation. During coagulation, thrombin generation is triggered by exposure of the factor VIIa/tissue factor (TF) complex to blood, and augmented by intrinsic tenase [activated factors IX and VIII (FVIII)]. Low levels of certain plasma procoagulants, including factors XI, IX, VIII, and prothrombin, cause reduced thrombin generation (1, 2) and are associated with bleeding. In contrast, in vitro, epidemiologic, and murine studies have associated elevated levels of these procoagulant proteins with abnormally high thrombin generation (1-3) and increased risk of thrombosis (4-8).
The ultimate substrate in these reactions, fibrinogen, is a 340 kDa glycoprotein composed of two copies each of three polypeptide chains (Aα, Bβ and γ) transcribed from three genes encoding the fibrinogen Bβ (FGB), Aα (FGA), and γ (FGG) chains, ordered from centromere to telomere, clustered in a region of approximately 50 kb on the long arm of human chromosome 4 at 4q28-31 (9). Mature fibrinogen Aα, Bβ and γ chains are composed of 610, 461, and 411 residues, respectively (10). Fibrinogen is synthesized and assembled in hepatocytes as a hexameric molecule, and secreted into the bloodstream (11). During coagulation, thrombin cleaves fibrinopeptides A and B from the N-termini of the Aα and Bβ chains, respectively, catalyzing the conversion of fibrinogen to fibrin, which polymerizes, stabilizes platelets, and localizes fibrinolytic enzymes (12). Fibrin can bind thrombin and block its activity towards protein substrates; this activity is known as “antithrombin I” (13). Fibrinogen mutations (dysfibrinogenemias) have been associated with both bleeding (14-16) and thrombosis (16-23).
Herein, we identified a novel FGB mutation (c.656A>G) predicting a Q189R mutation in the mature Bβ chain of a patient with a history of bleeding, thrombosis, and low functional and antigenic fibrinogen levels, consistent with an initial diagnosis of hypodysfibrinogenemia. However, this diagnosis was modified in light of findings that the mutant fibrinogen chain was not present in plasma and the circulating fibrinogen molecules were functionally normal. Interestingly, the patient demonstrated high plasma thrombin generation attributable to elevated FVIII activity, suggesting the presence of co-existing hypercoagulability as a cause for the thrombosis. This hypothesis was supported by a murine model of hypofibrinogenemia (Fgn+/−) plus elevated plasma FVIII which exhibited a shorter time to carotid artery occlusion than Fgn+/− mice infused with saline. These findings show plasma hypercoagulability was not mitigated by low fibrinogen levels. Together, these data suggest complex bleeding and thrombotic presentations can involve combined coagulopathies, and illustrate the need for comprehensive, whole plasma testing in patients with complex presentations.
METHODS
Proteins and Materials
Human thrombin and corn trypsin inhibitor were from Haematologic Technologies Inc. (Essex Junction, VT). Fibronectin-, plasminogen-, and von Willebrand factor-depleted fibrinogen was from Enzyme Research Laboratories (South Bend, IN). Aprotinin was from Sigma Chemical Company (St Louis, MO). Polyclonal rabbit anti-human fibrinogen antibody was from Dako Corporation (Carpinteria, CA), and goat anti-rabbit antibodies were from Calbiochem (La Jolla, CA) or Cappel (West Chester, PA). Mouse anti-human Bβ chain antibody (59D8) was a kind gift from Drs. Marshall Runge and Charles Esmon, and mouse anti-human Aα chain antibody (Y18) was a kind gift from Dr. Susan Lord. Fluorogenic thrombin substrate (Z-Gly-Gly-Arg-AMC), TF/phospholipid reagents, and thrombin calibrator (α2-macroglobulin/thrombin) were from Diagnostica Stago (Parsippany, NJ). Human FVIII was from Baxter Healthcare Corporation (Glendale, CA). FVIII-deficient plasma was from HRF (Raleigh, NC). Tissue plasminogen activator (tPA) and batroxobin were from American Diagnostica (Greenwich, CT).
Plasma
Blood was collected through a 21-guage butterfly needle into a syringe via a protocol approved by the University of North Carolina Institutional Review Board. The first 5 mL were discarded. The following 30 mL were drawn into a separate syringe containing sodium citrate/corn trypsin inhibitor (0.105 M/3.2% sodium citrate, pH 6.5, 18.3 μg/mL corn trypsin inhibitor) to minimize contact activation (24). Platelet-free plasma was prepared by sequential centrifugation (150×g for 15 minutes, 20,000×g for 15 minutes), aliquoted, and snap-frozen in liquid nitrogen within 2 hours of blood collection, as described (3). Plasma from healthy subjects was pooled for normal pooled plasma (NPP). Plasma was defibrinated for certain experiments by incubation with batroxobin (0.5 BU/mL final, 30 minutes, 37 °C), and removing fibrin by centrifugation (1118×g, 10 minutes, 4°C).
Sequencing
Sequencing was performed by standard Sanger sequencing (25) using primers covering all exons and exon/intron boundaries of FGB, FGA and FGG. Polymerase chain reaction was performed on genomic DNA. Sequencing was performed using BigDye V3.1 on an ABI3730xl. Analysis was conducted using Sequencher V4.9 and Mutation Surveyor V3.97. The mutation was replicated and evaluated bidirectionally. Primers and reaction conditions are available upon request.
Fibrinogen purification
Fibrinogen was purified from the patient and normal plasmas as described (26). Briefly, plasmas were supplemented with phenylmethanesulfonyl fluoride and benzamidine (1 mM and 5 mM, final, respectively). Vitamin K-dependent proteins were removed by two adsorptions against 30% BaSO4 (0.2 mL/mL plasma). Fibrinogen was precipitated twice by glycine addition (165 mg/mL plasma), end-over-end rotation (1 hour, room temperature), and centrifugation (4472×g, 15 minutes). SDS-PAGE and western blotting demonstrated no fibrinogen in the supernatants of either the patient or control samples (data not shown), indicating all fibrinogen was precipitated. Purified fibrinogen was then re-suspended and dialyzed to 20 mM N-2-hydroxyethylpiperazine-N’-2-ethanesulfonic acid (pH 7.4), 150 mM NaCl (HBS) containing 5 KIU/mL aprotinin.
Fibrin polymerization and fibrinolysis
Undiluted plasma was clotted with thrombin and CaCl2 (10 nM and 20 mM, final, prepared in HBS). Purified fibrinogen (0.5 mg/mL, final) was incubated for 1 minute with CaCl2 (5 mM, final) and clotted with thrombin (5 nM, final). In both cases, fibrin polymerization was followed by turbidity at 405 nm in a SpectraMax Plus340 spectrophotometer (Molecular Devices, Sunnyvale, CA). The lag time was defined as the time until the initial turbidity increased by 10 mOD units.
Tissue plasminogen activator (tPA, 0.25 μg/mL, final) was added to plasma before triggering clot formation via addition of thrombin and CaCl2 (10 nM and 20 mM, final), as indicated. Clot formation and lysis (turbidity increase and subsequent decrease, respectively) were followed by turbidity at 405 nm. The fibrin lysis rate was determined as the change in mOD versus time in the descending portion of the fibrinolysis curves.
Fibrinogen degradation
Fibrinogen (0.3 mg/mL, final) was degraded with 6 μg/mL plasmin in the presence of 1 mM CaCl2 or 5 mM EDTA at 37 °C. Aliquots were removed at 15 and 30 minutes and 4 hours, quenched with SDS-PAGE sample buffer, and immediately boiled. The zero time point was performed with fibrinogen in the absence of plasmin. Samples were stored at −80 °C until analysis by SDS-PAGE and Western blotting.
Two-dimensional difference in-gel electrophoresis (2D-DIGE)
Protein analysis by 2-Dimensional Differential In-Gel Electrophoresis (2D-DIGE) was performed at the University of North Carolina Systems-Proteomics Center, as described (27). Briefly, control and patient fibrinogens were labeled with Cy5- and Cy3-, respectively, and the 2D SDS-PAGE standards with Cy2-. Individual images of Cy2-, Cy3- and Cy5- labeled proteins were obtained using a Typhoon 9410 scanner (Amersham, Piscataway, NJ) with excitation/emission wavelengths of 480/530 nm for Cy2-, 520/590 nm for Cy3-, and 620/680 nm for Cy5-. After imaging, gels were stained with colloidal Coomassie Blue G-250 (BioRad, Hercules, CA). Fold differences between control and patient samples were determined by Differential In-gel Analysis using DeCyder 2D software (version 7.0). Gel images were calibrated in DeCyder 2D against the pI and MW of four of the known 2D SDS-PAGE standards. The 2D gel was blotted onto polyvinylidene fluoride membrane and probed with mouse anti-human Bβ chain (59D8), mouse anti-human fibrinogen Aα chain (Y18), or rabbit polyclonal antibody against human fibrinogen. Membranes were stripped between blots with 62.5 mM Tris-HCl pH 6.7, 2% SDS, and 100 mM β-mercaptoethanol.
FVIII activity measurements
Patient plasma was mixed with FVIII-deficient plasma (5% patient plasma and 95% FVIII-deficient plasma), and clotting was initiated with Kontact reagent (33% total volume) and calcium (10 mM, final). The clot formation rate was measured in a SpectraMax Plus340 plate reader (28) and compared to a standard curve created by mixing normal pooled plasma (NPP) spiked with FVIII (to 150-300%) with FVIII-deficient plasma.
Thrombin generation measurements
Thrombin generation in whole and defibrinated plasma was measured by calibrated automated thrombography (CAT) in reactions triggered with 1 pM TF/4 μM lipid and 5 pM TF/4 μM lipid in a Fluoroskan Ascent® fluorometer (ThermoLabsystem, Helsinki, Finland), as described (3). Thrombin generation parameters were calculated using Thrombinoscope software version 3.0.0.29 (Thrombinoscope BV, Maastricht, Netherlands).
Measurement of fibrinogen in mice
Fibrinogen heterozygous mice (Fgn+/−) having a deletion of the γ-chain gene have been previously described (29). Blood was drawn from the retro-orbital plexus of Fgn+/+ and Fgn+/− mice through heparinized capillary tubes into 30 U/mL Heparin (Sigma). Platelet-poor plasma was prepared by centrifuging blood at 5,000×g for 10 minutes. Plasma fibrinogen levels were measured by ELISA. Briefly, 96-well plates were coated with goat anti-human fibrinogen antibody (Cappel) diluted 1:500 in 20 mM phosphate pH 7.4, 150 mM NaCl (PBS) for 1 hour at room temperature, washed with PBS plus 0.1% Tween-20 (PBST), and blocked with 1% BSA in PBS. Plasmas diluted serially in PBS were added to coated plates, incubated at room temperature for two hours, and then washed with PBST. Plates were incubated with peroxidase-conjugated goat anti-human fibrinogen antibody (Cappel) diluted 1:25,000 in PBS with 1% BSA for one hour at room temperature, washed in PBST, and developed with SureBlue TMB peroxidase substrate (KPL). Absorbance was monitored at 635 nm on a SpectraMax Plus340 spectrophotometer. The rate of increase in absorbance was fit on a semi-log plot, and the level of fibrinogen in plasma from Fgn+/− mice was determined by comparison to Fgn+/+ mice.
Carotid artery thrombosis model
Procedures were approved by the University of North Carolina Institutional Animal Care and Use Committee. Mice were anesthetized with 2-2.5% isoflurane in 2% oxygen, and the left saphenous vein was exposed under a SZX12 dissecting microscope (Olympus) and catheterized as described (30). Human FVIII or saline was administered through the catheter on a per weight basis (blood volume [mL] is 7% of body weight [g]) 5 minutes before injury. The endogenous FVIII concentration in mice (1 U/mL, 100%) (31) was raised by infusion of human FVIII to levels (total murine plus human) similar to the patient’s FVIII levels. Human FVIII binds murine vWF, has comparable cofactor activity as murine FVIII, promotes coagulation after tail clipping and vessel injury in hemophilic mice, and has sufficient half-life in murine circulation for these experiments (8, 32-36). The final plasma FVIII concentration achieved in mice (198±1%) was confirmed in separate, uninjured mice (n=2) by clotting assays, as we have described (8).
The carotid artery thrombosis model was performed as described (30). Briefly, the right common carotid artery was exposed after midline cervical incision, dried, and treated with 10% ferric chloride (FeCl3, 0.62 M on 0.5×0.5-mm filter paper) for 2 minutes, and washed with warm saline. Blood flow was monitored via Doppler ultrasonic flow probe (Indus Instruments, Webster, TX). The time to occlusion (TTO) was defined as the time between FeCl3 administration and lack of flow for 1 minute. Experiments were stopped after 40 minutes if there was no stable occlusion. Blood was drawn from the inferior vena cava (IVC) into 3.2% sodium citrate and processed to platelet-poor plasma by centrifugation at 5000×g for 10 minutes.
Statistical analysis
Data from plasma polymerization and fibrinolysis were analyzed by non-parametric statistics using the Wilcoxon test. Thrombin generation parameters were analyzed by unpaired students t test. TTO data were analyzed by log-rank test (Mantel-Cox) due to censored TTO values. P<0.05 was considered statistically significant.
RESULTS
Patient history
A 56 year-old female presented with a lifelong history of mild to moderate bleeding including gum bleeding, spontaneous bruising, and hematoma formation. She had developed significant hematomas following cardiac catheterization via her brachial artery, as well as a neck hematoma following injury with a kickboard while swimming. Additionally, she had poor wound healing following surgery for a broken wrist and following mastectomy for breast cancer. She also had prior thrombotic events: a left-sided central retinal artery occlusion at age 35 and an episode of transient global amnesia thought to be ischemic at age 53, although MRI and MRA were both negative. She had no menorrhagia, and underwent 3 caesarean sections and total abdominal hysterectomy with bilateral salpingo-oophorectomy without abnormal bleeding. She had no hyperlipidemia, diabetes, or coronary disease.
Laboratory testing revealed prolonged thrombin and reptilase times, low functional and antigenic fibrinogen values, and prolonged platelet function analysis on two separate occasions by PFA-100, both on and off aspirin (Table 1). The patient had elevated FVIII activity in three separate blood draws spaced 20 months apart, but normal factor XIII activity and von Willebrand factor antigen, activity, and multimers (Table 1). She tested negative for prothrombin G20210A and factor V Leiden mutations, and for antiphospholipid antibodies. The patient’s father and one of her three sons exhibited similar laboratory fibrinogen abnormalities, but were asymptomatic. The patient’s father died following myocardial infarction at age 65; his fibrinogen was never sequenced. The sons were unavailable for further study.
Table 1. Summary of screening tests.
| Coagulation Tests | Normal range | Patienta |
|---|---|---|
| aPTT (sec) | 25.2 – 36.2 | 29.6, 31.9 |
| Prothrombin Time (sec) | 10.1 – 12.6 | 11.9, 12.2 |
| Thrombin Time (sec) | 13.4 – 18.0 | 18.2, 22.6 |
| Reptilase Time (sec) | 15.0 – 19.2 | 21.3 |
| Functional fibrinogen (Clauss, mg/dL) | 208 – 409 | 162 |
| Fibrinogen antigen (mg/dL) | 150 – 375 | 148 |
| Functional fibrinogen (clot weight(55), mg/dL) | 330b | 170 |
| von Willebrand factor antigen (% of normal) | 56 – 223 | 147 |
| von Willebrand factor activity (% of normal) | 50 – 204 | 140 |
| FVIII activity in blood draw 1 (% of normal) | 54 – 161 | 163 |
| FVIII activity in blood draw 2 (% of normal) | 100c | 225 |
| FVIII activity in blood draw 3 (% of normal) | 100c | 225 |
| Antithrombin III (% of normal) | 88 – 133 | 97 |
| PFA-100: collagen and epinephrine (sec) | 84 – 178 | >300, 132d |
| PFA-100: collagen and ADP (sec) | 60 – 107 | 119, 119d |
| Chemistry Tests | ||
| alanine transaminase (U/L) | 15 – 48 | 24, 25, 22 |
| aspartate aminotransferase (U/L) | 14 – 38 | 25, 21, 27 |
| Cholesterol (mg/dL) | 100 – 199 | 220, 251, 192 |
| Triglycerides (mg/dL) | 1 – 149 | 55, 85, 54 |
Multiple values are from separate blood draws
Fibrinogen concentration in NPP
FVIII activity in NPP
First PFA-100 was on aspirin, second was off aspirin for 2 weeks
DNA sequencing was performed only in the proband, revealing a single heterozygous A>G base substitution in FGB at position 656, predicting a glutamine to arginine substitution at position 189 (Q219R numbering includes the signal peptide) of the mature fibrinogen Bβ chain. This variant was not found in the 1000 genomes catalogue of human genetic variation (http://www.1000genomes.org/). No other mutations were found in the three fibrinogen genes.
Plasma shows impaired clot formation and fibrinolysis
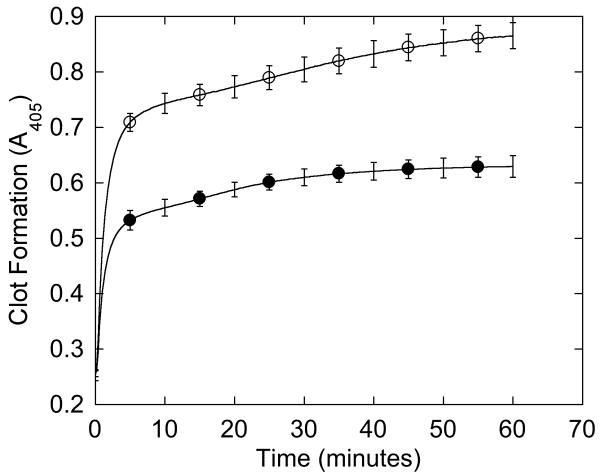
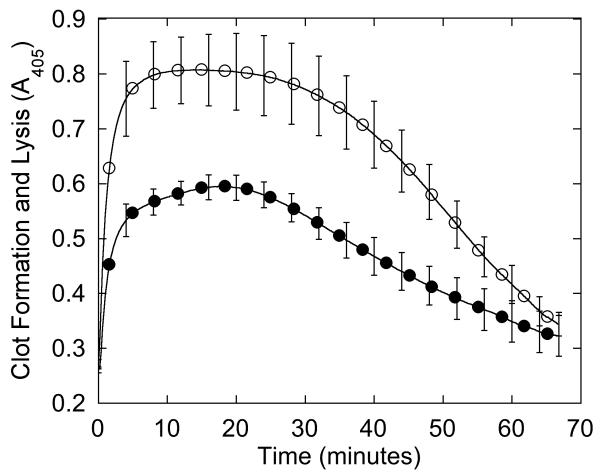
We first characterized the patient’s plasma clotting characteristics. Consistent with prolonged thrombin and reptilase times, the formation rate and final turbidity of the patient’s plasma clots were 1.4- and 1.6-fold lower than NPP (p<0.0001), although the lag time was similar (Figure 1A, Table 2). When fibrinolysis was induced by adding tPA at the onset of clotting, the decrease in turbidity was slower in the patient’s plasma than NPP (−6.7±1.0 versus −14.2±2.4 mOD/min, respectively, p<0.0001), but reached baseline at the same time as NPP (Figure 1B).
Figure 1. Plasma demonstrates impaired clot formation and fibrinolysis.
(A-B) Plasma was clotted with CaCl2 and thrombin (20 mM and 10 nM, final, respectively) in the absence (A) and presence (B) of 0.25 μg/mL tPA. Data shown are representative of three separate reactions performed in triplicate at room temperature and followed by turbidity at 405 nm. Symbols are: NPP (○) and patient plasma (●).
Table 2. Summary of plasma and purified fibrin polymerization parameters.
| NPP | Patient | |
|---|---|---|
| Plasma Clotting Parameters a | ||
| Onset (min)b | 0.2 ± 0.1 | 0.3 ± 0.1 |
| Rate (Vmax, mOD/min) | 292 ± 52 | 202 ± 35* |
| Turbidity change (mOD) | 612 ± 19 | 374 ± 18* |
| Purified Fibrinogen Clotting Parameters a | ||
| Onset (min)b | 0.9 ± 0.2 | 0.9 ± 0.4 |
| Rate (Vmax, mOD/min) | 67 ± 20 | 70 ± 22 |
| Turbidity change (mOD) | 142 ± 8 | 143 ± 16 |
Mean ± standard deviation from three independent experiments from two separate blood draws, performed in triplicate
Time until turbidity increased 10 mOD units
p< 0.0001 versus NPP
Fibrinogen isolated from the patient’s plasma has normal composition and function
To characterize the clotting dysfunction, we then isolated fibrinogen from the patient’s plasma and compared it to fibrinogen isolated from normal plasma. SDS-PAGE and western blotting demonstrated no fibrinogen in the supernatant following glycine precipitation (data not shown), indicating all fibrinogen was precipitated. Figure 2A shows purified fibrinogen chains from the patient’s plasma separated by SDS-PAGE under reducing conditions compared to fibrinogen purified from NPP and a commercial fibrinogen preparation. Fibrinogen from all three sources appeared similar, with all three chains present at the expected molecular weight. These results were confirmed by Western blot, where no additional bands were seen in the patient sample (Figure 2B).
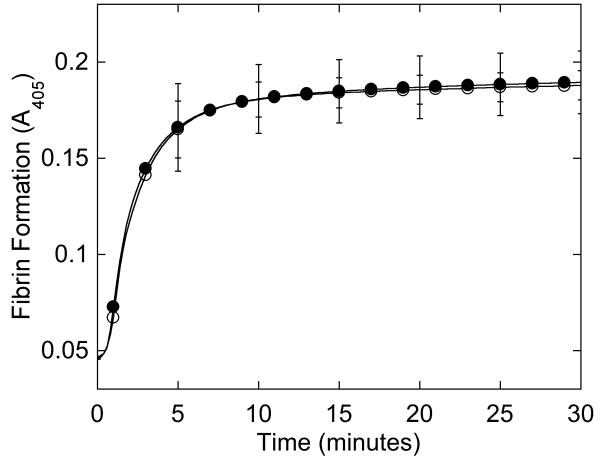
Figure 2. Purified fibrinogen contains all three polypeptide chains at the expected molecular weights and has normal clotting function.
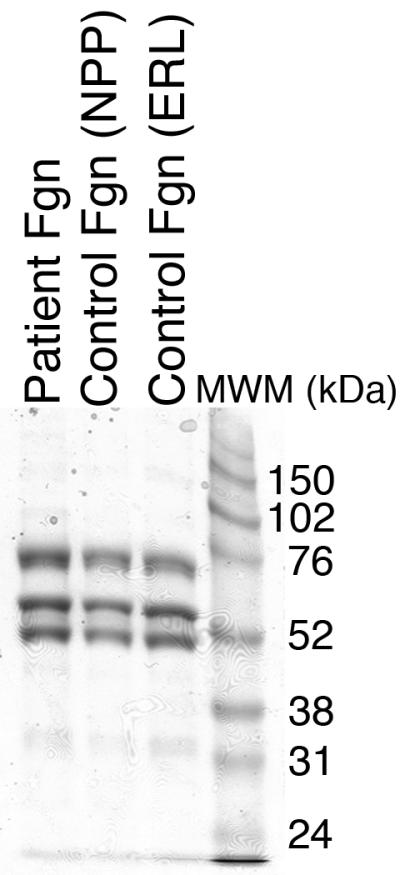
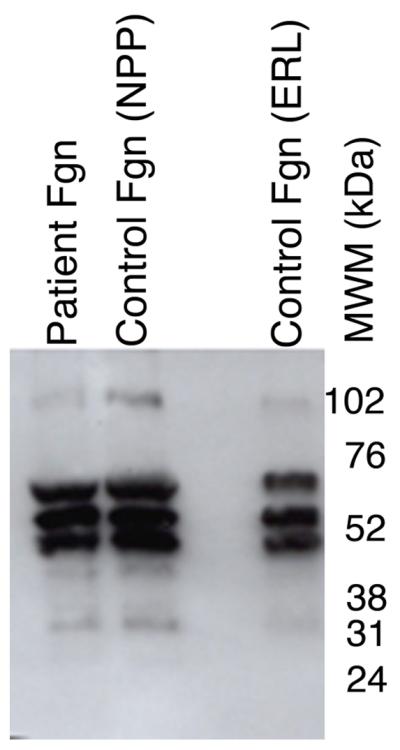
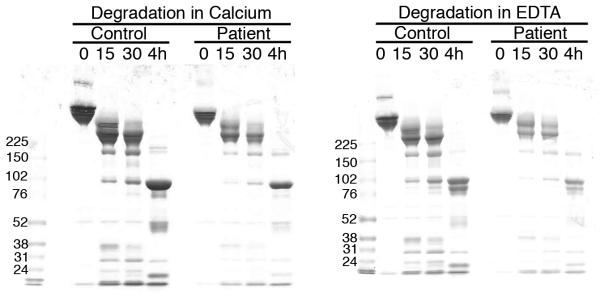
A-B) Fibrinogen was precipitated from plasma, and equivalent amounts (10 μg) were separated by 10% SDS-PAGE under reducing conditions. A) Coomassie Brilliant Blue R250-stained gel. B) Western blot using rabbit anti-human fibrinogen polyclonal antibody. Lanes are: (P) Patient fibrinogen, (N) Fibrinogen precipitated from NPP in-house, and (C) Commercial fibrinogen. Molecular weight markers are indicated. C) Purified fibrinogen (0.5 mg/mL in HBS) was pre-incubated with CaCl2 (5 mM, final) for 1 minute, and clotted by adding thrombin (5 nM, final). Panel C shows mean and standard deviation from three separate reactions performed in triplicate at room temperature and followed by turbidity at 405 nm. Symbols are: NPP (○) and patient plasma (●); note that NPP and patient fibrinogen polymerization curves are identical. (D) Purified fibrinogen was incubated with plasmin in the presence of 1 mM CaCl2 or 5 mM EDTA (final, as indicated) at 37°C. Timed aliquots were quenched with SDS-PAGE loading dye, boiled, separated by non-reducing 4-12% SDS-PAGE, and stained by Coomassie Brilliant Blue R250.
In contrast to findings in plasma clotting assays, clotting of the patient’s purified fibrinogen was indistinguishable from normal fibrinogen at equal concentrations (Figure 2C, Table 2). Furthermore, when purified patient and control fibrinogens were incubated with plasmin in the presence of calcium or EDTA, the appearance and molecular weights of the degradation products were identical by Coomassie Blue staining (Figure 2D) and Western blotting (data not shown). These findings indicate that the patient’s circulating fibrinogen, while low, could be normally activated and degraded.
Circulating fibrinogen contains all three polypeptide chains at the expected molecular weights and charges
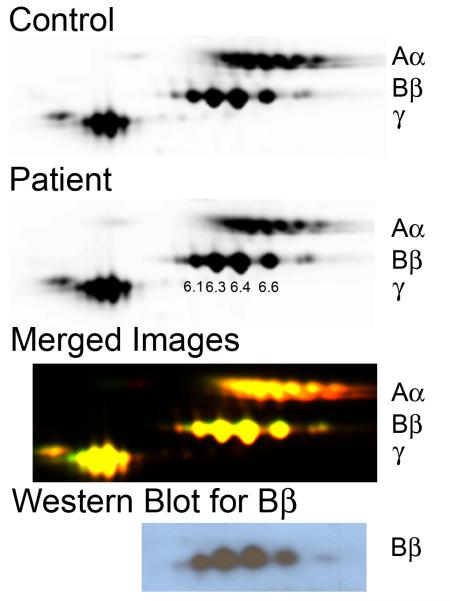
Since findings with purified fibrinogen suggested the patient’s circulating fibrinogen function was normal, we used 2D-DIGE to explicitly determine whether fibrinogen containing the Q189R point mutation was present in the patient’s plasma. This mutation, if present, should introduce a positive charge in the fibrinogen Bβ chain and consequently, shift Bβ chain migration in an isoelectric field. The 2D-DIGE was performed using ampholytes with a pI range of 3-10 and 5-8 in the first dimension; results were better visualized in the pI range of 3-10. Cy5-labeled control and Cy3-labeled patient fibrinogens were mixed and sequentially separated by size and charge. Figure 3 shows fluorescence from control and patient fibrinogens individually and merged. The patient’s Bβ chains had pIs of 6.1, 6.3, 6.4, and 6.6 (left to right), with a mass of approximately 57 kDa, similar to control and that reported in the Expasy database (37). Western blot analysis with anti-fibrin(ogen) antibody 59D8 (specific for the Bβ chain) confirmed the spots migrating at 57 kDa corresponded to the Bβ chains. The membrane was re-probed with anti-fibrinogen antibody Y18 (specific for the N-terminus of the Aα chain), confirming that no degraded Aα chain was present in the Bβ position (data not shown). These data show that fibrinogen isolated from the patient’s plasma had a similar molecular weight and charge as control fibrinogen, indicating the patient had hypo- but not dys-fibrinogenemia.
Figure 3. No abnormal fibrinogen is detected in the patient plasma by 2D-DIGE.
Control and patient samples and SDS-PAGE standards were labeled with Cy5-, Cy3-, and Cy2-, respectively, and separated by 2D-DIGE. Individual images of labeled proteins were obtained using a Typhoon 9410 scanner and compared using DeCyder 2D software (v7.0). Top to bottom: Control and patient samples individually, superimposed images of control and patient, and western blot of the 2D-DIGE using anti-human Bβ chain antibody (59D8). The Bβ chain pIs are indicated in the patient image.
Patient plasma demonstrates increased thrombin generation independent of hypofibrinogenemia
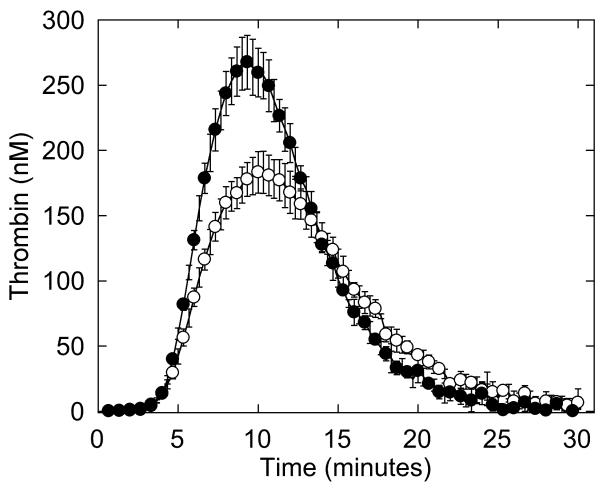
The low levels of fibrinogen and prolonged platelet function test (Table 1) provided rationales for the patient’s bleeding tendency. However, although thrombosis in afibrinogenemic patients may result from absence of “antithrombin I” activity (16, 38), the patient’s fibrinogen level was ~50% of normal, making this explanation unlikely. To determine the mechanism for the patient’s thrombotic tendency, we utilized a “global” assay to measure plasma coagulation potential. We first triggered clotting in NPP and the patient’s plasma with 4 μM phospholipid and 1 or 5 pM TF, and compared thrombin generation by CAT. Interestingly, the patient’s plasma demonstrated higher thrombin generation parameters than NPP, most strikingly with 1.5-fold increased peak thrombin when reactions were triggered with 1 pM TF (Figure 4A, Table 3). When thrombin generation was induced with 5 pM TF, the patient still generated more thrombin compared to NPP, but the difference in peak thrombin was more subtle (data not shown).
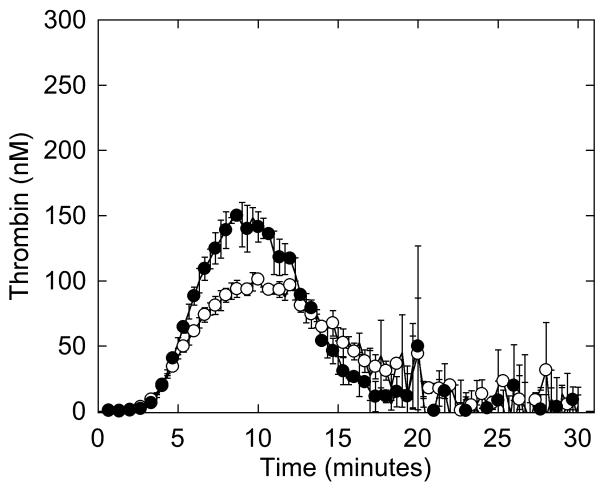
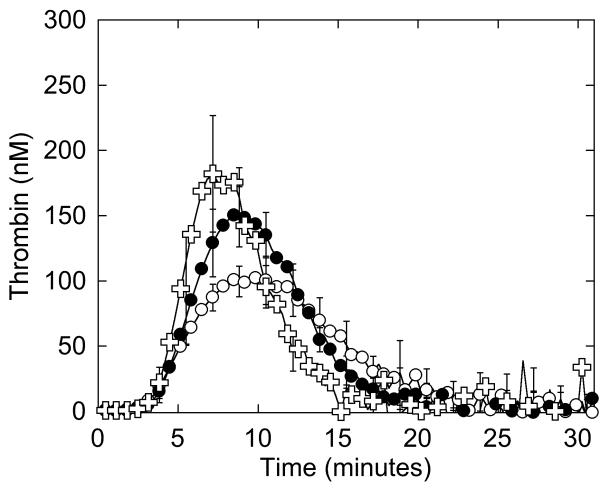
Figure 4. Whole and defibrinated patient plasmas demonstrate abnormal thrombin generation that can be recapitulated by raising the FVIII level in NPP.
Thrombin generation was initiated by adding 4 μM phospholipid and 1 pM TF to whole (A) or defibrinated (B, C) plasmas. CAT detects higher thrombin generation in the presence of fibrinogen than in its absence because fibrin-bound thrombin is protected from inhibition by antithrombin III but can still cleave fluorogenic substrate (3, 56, 57). A, B) Symbols are: NPP (○), patient plasma (●). C) Thrombin generation was initiated by adding 4 μM phospholipid and 1 pM TF to defibrinated NPP (○), defibrinated patient plasma (●), and defibrinated NPP plus FVIII (✞, 225%, final). Data show mean and standard deviations from experiments performed in triplicate in three independent assays for whole plasmas, and in triplicate in two to five independent assays for defibrinated plasmas.
Table 3. Thrombin generation parameters in whole and defibrinated plasmas.
| Whole Plasmaa | Defibrinated Plasmab | ||||
|---|---|---|---|---|---|
| NPP | Patient | NPP | Patient | NPP plus FVIII | |
| Lag Time (min) | 4.4 ± 0.2 | 4.5 ± 0.2 | 3.7 ± 0.4 | 4.0 ± 0.4 | 3.8 ± 0.6 |
| Time to peak (min) | 10.2 ± 0.2 | 9.4 ± 0.2* | 10.4 ± 2.0 | 9.0 ± 0.3 | 7.7 ± 0.5 |
| Peak thrombin (nM) | 183 ± 16 | 267 ± 20* | 107 ± 27 | 158 ± 14# | 181 ± 45# |
| ETPc (nM.min) | 2052 ± 141 | 2343 ± 162 | 1066 ± 216 | 1244 ± 74 | 1146 ± 119 |
Experiments were triggered with 1 pM TF and 4 μM phospholipids.
Mean ± standard deviation from three independent experiments from two separate blood draws, performed in triplicate
Mean ± standard deviation from two to five independent experiments performed in triplicate
ETP, endogenous thrombin potential
p<0.05 versus whole NPP
p<0.01 versus defibrinated NPP
We then defibrinated patient and normal plasmas and compared thrombin generation. Similar to that seen in the presence of fibrinogen, defibrinated patient plasma exhibited 1.5-fold higher peak thrombin than defibrinated NPP (Figure 4B, Table 3), indicating the difference in plasma thrombin generation was not due to the difference in fibrinogen concentration. Accordingly, adding fibrinogen to the patient plasma to reach normal levels (330 mg/dL) further increased peak thrombin 1.4-fold over that seen in patient whole plasma and 2-fold higher than that seen in whole NPP (data not shown). These findings suggested the patient’s thrombosis may have resulted from a plasma hypercoagulability that was independent of the hypofibrinogenemia.
Increased plasma thrombin generation can be attributed to elevated plasma FVIII levels
Given the patient’s increased plasma thrombin generation peak, it was of interest that she had an elevated FVIII level in three separate blood draws spaced over 20 months (Table 1). We previously showed that FVIII increases peak thrombin generation with little to no change in the lag time or time to peak (3). Therefore, we hypothesized that the increased thrombin generation seen in the patient’s plasma was due to increased FVIII. To test this hypothesis, we spiked FVIII (to 163, 225 and 275%, final) into defibrinated NPP and measured thrombin generation. Raising FVIII to 225% produced similar (statistically indistinguishable) thrombin generation in defibrinated NPP as in defibrinated patient plasma in reactions triggered with 4 μM phospholipid and 1 pM TF (Figure 4C, Table 3, results with 163 and 275% are not shown) or 5 pM TF (data not shown). This finding implicated elevated FVIII in the patient’s increased plasma thrombin generation.
Elevated FVIII increases thrombosis in hypofibrinogenemic mice
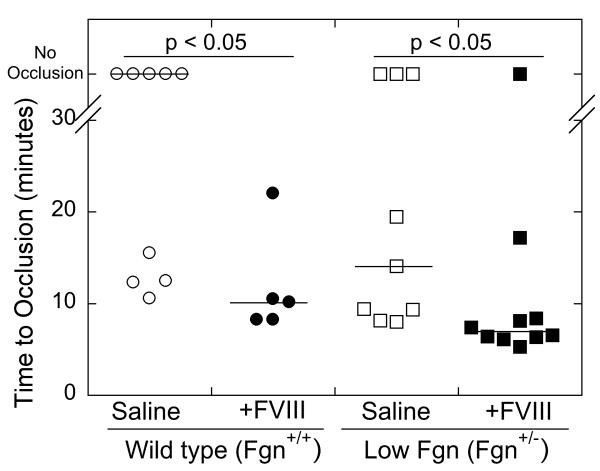
We previously showed that elevated FVIII is prothrombotic in mice with normal fibrinogen levels (8). To determine whether elevated FVIII could be prothrombotic in a background of low fibrinogen, we used a murine model of hypofibrinogenemia (Fgn+/−) (29), expressing 39±2% (mean ± standard deviation, n=2) of the fibrinogen level of wild type (Fgn+/+) littermates, into which we infused factor VIII or saline, as we have described (8). Thrombosis was induced via 2-minutes application of FeCl3 to the carotid artery and the TTO was recorded by Doppler.
Consistent with our previous findings (8), Fgn+/+ mice infused with FVIII exhibited a shorter TTO than saline-infused Fgn+/+ mice. Furthermore, consistent with prior observations that Fgn+/− mice have normal thrombin-induced clotting times (29), the TTO of Fgn+/− mice infused with saline was statistically indistinguishable from wild type (Fgn+/+) littermates (Figure 5). Importantly, Fgn+/− mice infused with FVIII (to ~200% total, endogenous murine plus infused human protein), exhibited a significantly (p<0.05) shorter TTO than Fgn+/− mice infused with saline (Figure 5). These data show that a low fibrinogen level does not mitigate the prothrombotic effect of elevated plasma FVIII.
Figure 5. Elevated FVIII shortens the TTO after FeCl3 injury to the carotid artery of Fgn+/− mice.
Fgn+/+ and Fgn+/− mice were infused with saline or FVIII to 198±1% of normal. Thrombosis was induced by application of 10% FeCl3 to the carotid artery for 2 minutes, and the TTO was determined by Doppler. In vessels that did not occlude, the TTO was censored at 40 minutes. Each point represents a separate mouse. Lines show median values.
DISCUSSION
Diagnosis of patients with complex coagulopathies that include both bleeding and thrombosis is a significant clinical challenge. Fibrinogen abnormalities have been observed in patients with bleeding and/or thrombosis and implicated in the etiology of both coagulopathies (14-23). To our knowledge, prior studies have not included thrombin generation testing to rule out co-existing coagulopathies in these patients. In our patient, the presence of a novel heterozygous mutation in the 656 A>G position in exon 4 of FGB was consistent with the initial diagnosis of hypodysfibrinogenemia. However, this diagnosis was modified following our findings that the mutant fibrinogen chain was not present in plasma and the circulating fibrinogen molecules had normal functional characteristics. Further coagulation testing revealed elevated thrombin generation in the patient’s plasma consistent with her elevated FVIII level, as well as a shortened time to vessel occlusion in an in vivo thrombosis model; these findings demonstrated the prothrombotic potential of this abnormality in spite of the low fibrinogen level. Together, these data suggest a combined etiology involving both hypofibrinogenemia and hypercoagulability.
Hypofibrinogenemia is a quantitative fibrinogen disorder characterized by reduced coagulant activity due to low antigen levels (39). Causative mutations are divided into two main classes: null mutations with no protein production, and mutations producing abnormal protein chains that are retained inside the cell because of impaired hexamer assembly or secretion (40). The most likely mechanism for the hypofibrinogenemia is a lack of secretion due to abnormal fibrinogen assembly. Of the 403 fibrinogen molecular abnormalities reported in the literature, 80 mutations are in the Bβ chain (41). Most FGB gene mutations that cause hypofibrinogenemia are located in the βC domain, some of which result in Bβ chain truncation. The present mutation, c.656 A>G (Bβ Q189R, numbering omits the signal peptide), is located at the end of the second half of the coiled-coil α-helical region, next to the second disulphide ring (42), where Bβ cysteines 193 and 197 form interchain disulphide bonds, and close to the βC domain that encompasses residues 198-461. Studies with recombinant systems using deletion and substitution mutants indicate the coiled-coil region and inter- and intra-chain disulphide bonds are needed to complete chain assembly (11, 43, 44). To date, the g.5157T>A (p.Leu172Gln) (45) is the only other mutation reported in exon 4 of the FGB gene; this missense mutation does not affect protein secretion, but activates a cryptic acceptor splice site in exon 4 that results in Bβ chain truncation. Inspection of the nucleotide sequence surrounding the present patient’s mutation suggests the mutation does not create a typical splice site. Thus, the reason why protein containing a Bβ Q189R mutation is not expressed is currently unknown.
It is challenging to relate thrombosis to fibrinogen abnormalities (23). Although thrombosis in afibrinogenemic patients has been attributed to the absence of “antithrombin I” activity (16, 38), the present patient’s fibrinogen level was ~50% of normal, making this explanation unlikely. The patient did not carry the prothrombin G20210A or factor V Leiden mutations or antiphospholipid antibodies; however, the thrombotic events may be at least partially attributable to elevated FVIII levels, a common hypercoagulable state associated with increased thrombosis risk (4-8). We previously showed that elevated FVIII increases the thrombin generation peak height, with highest sensitivity in reactions utilizing a low TF trigger (3). Our current data are consistent with these findings; the patient’s plasma demonstrated a higher thrombin peak than seen in NPP, and when defibrinated NPP was supplemented with FVIII, similar thrombin peak values were obtained as in the patient’s defibrinated plasma (Figure 4). Importantly, we were able to recapitulate the patient’s situation in an in vivo model of hypofibrinogenemia (Fgn+/− mice) (29) by raising FVIII to the level present in the patient’s plasma and inducing thrombosis in the carotid artery (Figure 5). The prothrombotic effect of elevated FVIII in Fgn+/− mice is consistent with our prior findings in wild type mice with elevated FVIII and a normal fibrinogen level (8). Together, these data suggest a pathogenic role for elevated FVIII in this patient.
It is of interest that Fgn+/− mice expressing ~40% fibrinogen levels had a similar TTO as Fgn+/+ mice (Figure 5). Indeed, neither the γ chain-deleted Fgn+/− mice used in our study, nor hemizygous Aα+/− mice expressing 75% of normal fibrinogen levels, demonstrate a hemorrhagic phenotype or abnormal thrombin times (29, 46). The lack of bleeding in mice with low fibrinogen levels differs from humans, who exhibit prolonged thrombin times and mild to moderate bleeding complications with low fibrinogen.(47-51) Thus, although our study demonstrates the utility of animal models for examining pathogenic mechanisms in humans, the difference in phenotype in humans and mice with low fibrinogen levels suggests additional modifiers influence clotting in these species.
Although our experiments identified likely mechanisms to explain both the bleeding and thrombotic events, additional pathogenic mechanisms may also be present. Virchow’s Triad suggests roles for abnormal blood composition, vascular wall function, and blood flow in the pathogenesis of thrombosis (52). Localization of the patient’s thrombosis to the retinal artery suggests vascular bed-specific pathology also contributes to the phenotype. Currently, experimental means to investigate the contributions of the vessels and local shear in vivo are not feasible. The relative contribution of the patient’s decreased platelet function to the bleeding events is unknown. This abnormality may reflect the decreased fibrinogen levels or stem from an alternate mechanism; we were unable to assess this aspect in the murine model. It is also unknown whether the patient’s low fibrinogen and high FVIII levels are related. Fibrinogen is synthesized in the liver, whereas FVIII is synthesized in the liver and endothelium (53, 54). Both fibrinogen and FVIII levels increase during an acute phase response. Hepatotoxicity related to failure to secrete the mutant fibrinogen chain may induce higher FVIII expression; however, the patient’s alanine transaminase and aspartate aminotransferase levels were normal, suggesting normal liver function.
In conclusion, we present a novel FGB mutation, c.656 A>G, that predicts a p.Q189R change, but is not secreted. This new hypofibrinogenemia case was confounded by a hypercoagulable state related to elevated FVIII levels that increased plasma thrombin generation and accelerated the time to vessel occlusion in a murine thrombosis model. To our knowledge, this is the first characterization of combined congenital hypofibrinogenemia and plasma hypercoagulability in a patient with bleeding and thrombosis. Thrombin generation testing is not usually conducted in patients with suspected fibrinogen abnormalities. Our findings suggest previous cases in which fibrinogen abnormalities have been associated with thrombosis may also be complicated by co-existing hypercoagulability, and therefore, warrant re-investigation.
- What is known on this topic
- Identifying coagulation abnormalities in patients with combined bleeding and thrombosis history is clinically challenging.
- Abnormal levels or function of fibrinogen have been associated with bleeding and/or thrombosis.
- Elevated factor VIII is a risk factor for thrombosis.
- What this paper adds
- Fibrinogen containing a novel FGB mutation – c.656A>G predicting a Q189R mutation in the mature Bβ chain – does not circulate in plasma.
- Low levels of fibrinogen (hypofibrinogenemia) do not protect against plasma hypercoagulability.
- Global plasma testing may be necessary to understand complex coagulopathies.
ACKNOWLEDGEMENTS
We thank Dr. Kellie R. Machlus, Dr. Jian-Guo Wang, and Ms. Laura Gray for their excellent technical assistance and Dr. Francis Castellino for generously providing the mice.
SOURCES OF FUNDING
This study was supported by funding from the National Institutes of Health (R01HL094740 to ASW) and the National Center for Research Resources (TraCS award UL1RR025747 to ASW). BLW was partially supported by Grant #56005708 from the Howard Hughes Medical Institute to the UNC Program in Translational Medicine.
Footnotes
AUTHORSHIP
R.M. and B.L.W. designed and performed experiments, analyzed results and wrote the manuscript. C.S.M. designed and performed experiments and reviewed the manuscript. F.-C.L. performed statistical analysis and reviewed the manuscript. A.D.M. wrote and reviewed the manuscript. R.P. and N.M. provided important reagents and reviewed the manuscript. R.A.C. provided scientific input and reviewed the manuscript. J.D. designed experiments, analyzed results, and reviewed the manuscript. A.S.W. supervised experiments and wrote the manuscript.
DISCLOSURES
The authors declare no competing financial interests.
REFERENCES
- 1.Allen GA, Wolberg AS, Oliver JA, Hoffman M, Roberts HR, Monroe DM. Impact of procoagulant concentration on rate, peak and total thrombin generation in a model system. J Thromb Haemost. 2004 Mar;2(3):402–13. doi: 10.1111/j.1538-7933.2003.00617.x. [DOI] [PubMed] [Google Scholar]
- 2.Butenas S, van’t Veer C, Mann KG. “Normal” thrombin generation. Blood. 1999 Oct 1;94(7):2169–78. [PubMed] [Google Scholar]
- 3.Machlus KR, Colby EA, Wu JR, Koch GG, Key NS, Wolberg AS. Effect of tissue factor, thrombomodulin, and elevated clotting factor levels on thrombin generation in the calibrated automated thrombogram. Thromb Haemost. 2009;102(5):936–44. doi: 10.1160/TH09-03-0180. [DOI] [PMC free article] [PubMed] [Google Scholar]
- 4.Kyrle PA, Minar E, Hirschl M, Bialonczyk C, Stain M, Schneider B, et al. High plasma levels of factor VIII and the risk of recurrent venous thromboembolism. N Engl J Med. 2000 Aug 17;343(7):457–62. doi: 10.1056/NEJM200008173430702. [DOI] [PubMed] [Google Scholar]
- 5.Tracy RP, Arnold AM, Ettinger W, Fried L, Meilahn E, Savage P. The relationship of fibrinogen and factors VII and VIII to incident cardiovascular disease and death in the elderly: results from the cardiovascular health study. Arterioscler Thromb Vasc Biol. 1999 Jul;19(7):1776–83. doi: 10.1161/01.atv.19.7.1776. [DOI] [PubMed] [Google Scholar]
- 6.Kraaijenhagen RA, in’t Anker PS, Koopman MM, Reitsma PH, Prins MH, van den Ende A, et al. High plasma concentration of factor VIIIc is a major risk factor for venous thromboembolism. Thromb Haemost. 2000 Jan;83(1):5–9. [PubMed] [Google Scholar]
- 7.Bank I, Libourel EJ, Middeldorp S, Hamulyak K, van Pampus EC, Koopman MM, et al. Elevated levels of FVIII:C within families are associated with an increased risk for venous and arterial thrombosis. J Thromb Haemost. 2005 Jan;3(1):79–84. doi: 10.1111/j.1538-7836.2004.01033.x. [DOI] [PubMed] [Google Scholar]
- 8.Machlus KR, Lin F-C, Wolberg AS. Procoagulant activity induced by vascular injury determines contribution of elevated factor VIII to thrombosis and thrombus stability in mice. Blood. 2011 Oct 6;118(14):390–8. doi: 10.1182/blood-2011-06-362814. [DOI] [PMC free article] [PubMed] [Google Scholar]
- 9.Kant JA, Fornace AJ, Jr., Saxe D, Simon MI, McBride OW, Crabtree GR. Evolution and organization of the fibrinogen locus on chromosome 4: gene duplication accompanied by transposition and inversion. Proc Natl Acad Sci U S A. 1985 Apr;82(8):2344–8. doi: 10.1073/pnas.82.8.2344. [DOI] [PMC free article] [PubMed] [Google Scholar]
- 10.Henschen A, Lottspeich F, Kehl M, Southan C. Covalent structure of fibrinogen. Ann N Y Acad Sci. 1983 Jun 27;408:28–43. doi: 10.1111/j.1749-6632.1983.tb23232.x. [DOI] [PubMed] [Google Scholar]
- 11.Redman CM, Xia H. Fibrinogen biosynthesis. Assembly, intracellular degradation, and association with lipid synthesis and secretion. Ann N Y Acad Sci. 2001;936:480–95. [PubMed] [Google Scholar]
- 12.Weisel JW. Fibrinogen and fibrin. Adv Protein Chem. 2005;70:247–99. doi: 10.1016/S0065-3233(05)70008-5. [DOI] [PubMed] [Google Scholar]
- 13.Mosesson MW. Update on antithrombin I (fibrin) Thromb Haemost. 2007 Jul;98(1):105–8. [PubMed] [Google Scholar]
- 14.Niwa K, Yaginuma A, Nakanishi M, Wada Y, Sugo T, Asakura S, et al. Fibrinogen Mitaka II: a hereditary dysfibrinogen with defective thrombin binding caused by an A alpha Glu-11 to Gly substitution. Blood. 1993;82(12):3658–63. [PubMed] [Google Scholar]
- 15.Sugo T, Nakamikawa C, Yoshida N, Niwa K, Sameshima M, Mimuro J, et al. End-linked homodimers in fibrinogen Osaka VI with a B beta-chain extension lead to fragile clot structure. Blood. 2000;96(12):3779–85. [PubMed] [Google Scholar]
- 16.Bornikova L, Peyvandi F, Allen G, Bernstein J, Manco-Johnson MJ. Fibrinogen replacement therapy for congenital fibrinogen deficiency. J Thromb Haemost. 2011 Sep;9(9):1687–704. doi: 10.1111/j.1538-7836.2011.04424.x. [DOI] [PubMed] [Google Scholar]
- 17.Carrell N, Gabriel DA, Blatt PM, Carr ME, McDonagh J. Hereditary dysfibrinogenemia in a patient with thrombotic disease. Blood. 1983;62(2):439–47. [PubMed] [Google Scholar]
- 18.Collet J-P, Soria J, Mirshahi M, Hirsch M, Dagonnet FB, Caen J, et al. Dusart syndrome: a new concept of the relationship between fibrin clot architecture and fibrin clot degradability: hypofibrinolysis related to an abnormal clot structure. Blood. 1993;82(8):2462–9. [PubMed] [Google Scholar]
- 19.Tarumi T, Martincic D, Thomas A, Janco R, Hudson M, Baxter P, et al. Familial thrombophilia associated with fibrinogen Paris V: Dusart syndrome. Blood. 2000 Aug 1;96(3):1191–3. [PubMed] [Google Scholar]
- 20.Wada Y, Lord ST. A correlation between thrombotic disease and a specific fibrinogen abnormality (A alpha 554 Arg-->Cys) in two unrelated kindred, Dusart and Chapel Hill III. Blood. 1994;84(11):3709–14. [PubMed] [Google Scholar]
- 21.Koopman J, Haverkate F, Briet E, Lord ST. A congenitally abnormal fibrinogen (Vlissingen) with a 6-base deletion in the gamma-chain gene, causing defective calcium binding and impaired fibrin polymerization. J Biol Chem. 1991;266(20):13456–61. [PubMed] [Google Scholar]
- 22.Marchi R, Lundberg U, Grimbergen J, Koopman J, Torres A, de Bosch NB, et al. Fibrinogen Caracas V, an abnormal fibrinogen with an Aalpha 532 Ser-->Cys substitution associated with thrombosis. Thromb Haemost. 2000 Aug;84(2):263–70. [PubMed] [Google Scholar]
- 23.Haverkate F, Samama M. Familial dysfibrinogenemia and thrombophilia. Report on a study of the SSC Subcommittee on Fibrinogen. Thromb Haemost. 1995 Jan;73(1):151–61. [PubMed] [Google Scholar]
- 24.Dargaud Y, Luddington R, Baglin TP. Elimination of contact factor activation improves measurement of platelet-dependent thrombin generation by calibrated automated thrombography at low-concentration tissue factor. J Thromb Haemost. 2006 May;4(5):1160–1. doi: 10.1111/j.1538-7836.2006.01905.x. [DOI] [PubMed] [Google Scholar]
- 25.Sanger F, Nicklen S, Coulson AR. DNA sequencing with chain-terminating inhibitors. Proc Natl Acad Sci U S A. 1977 Dec;74(12):5463–7. doi: 10.1073/pnas.74.12.5463. [DOI] [PMC free article] [PubMed] [Google Scholar]
- 26.Kazal LA, Amsel S, Miller OP, Tocantins LM. The preparation and some properties of fibrinogen precipitated from human plasma by glycine. Proc Soc Exp Biol Med. 1963 Aug-Sep;113:989–94. doi: 10.3181/00379727-113-28553. [DOI] [PubMed] [Google Scholar]
- 27.Osorio C, Sullivan PM, He DN, Mace BE, Ervin JF, Strittmatter WJ, et al. Mortalin is regulated by APOE in hippocampus of AD patients and by human APOE in TR mice. Neurobiol Aging. 2007 Dec;28(12):1853–62. doi: 10.1016/j.neurobiolaging.2006.08.011. [DOI] [PubMed] [Google Scholar]
- 28.Pratt CW, Monroe DM. Microplate coagulation assays. Biotechniques. 1992;13(3):430–3. [PubMed] [Google Scholar]
- 29.Ploplis VA, Wilberding J, McLennan L, Liang Z, Cornelissen I, DeFord ME, et al. A total fibrinogen deficiency is compatible with the development of pulmonary fibrosis in mice. Am J Pathol. 2000 Sep;157(3):703–8. doi: 10.1016/S0002-9440(10)64582-8. [DOI] [PMC free article] [PubMed] [Google Scholar]
- 30.Machlus KR, Cardenas JC, Church FC, Wolberg AS. Causal relationship between hyperfibrinogenemia, thrombosis, and resistance to thrombolysis in mice. Blood. 2011 May 5;117(18):4953–63. doi: 10.1182/blood-2010-11-316885. [DOI] [PMC free article] [PubMed] [Google Scholar]
- 31.Emeis JJ, Jirouskova M, Muchitsch EM, Shet AS, Smyth SS, Johnson GJ. A guide to murine coagulation factor structure, function, assays, and genetic alterations. J Thromb Haemost. 2007 Apr;5(4):670–9. doi: 10.1111/j.1538-7836.2007.02408.x. [DOI] [PubMed] [Google Scholar]
- 32.Kawasaki T, Kaida T, Arnout J, Vermylen J, Hoylaerts MF. A new animal model of thrombophilia confirms that high plasma factor VIII levels are thrombogenic. Thromb Haemost. 1999 Feb;81(2):306–11. [PubMed] [Google Scholar]
- 33.Neyman M, Gewirtz J, Poncz M. Analysis of the spatial and temporal characteristics of platelet-delivered factor VIII-based clots. Blood. 2008 Aug 15;112(4):1101–8. doi: 10.1182/blood-2008-04-152959. [DOI] [PMC free article] [PubMed] [Google Scholar]
- 34.Shi Q, Fahs SA, Kuether EL, Cooley BC, Weiler H, Montgomery RR. Targeting FVIII expression to endothelial cells regenerates a releasable pool of FVIII and restores hemostasis in a mouse model of hemophilia A. Blood. 2010 Jul 6;116(16):3049–57. doi: 10.1182/blood-2010-03-272419. [DOI] [PMC free article] [PubMed] [Google Scholar]
- 35.Moller F, Tranholm M. A ferric chloride induced arterial injury model used as haemostatic effect model. Haemophilia. 2010 Jan;16(1):e216–22. doi: 10.1111/j.1365-2516.2009.02133.x. [DOI] [PubMed] [Google Scholar]
- 36.Baumgartner B, Jaki T, Wolfsegger MJ, Eder B, Schiviz A, Schwarz HP, et al. Optimization, refinement and reduction of murine in vivo experiments to assess therapeutic approaches for haemophilia A. Lab Anim. 2010 Jul;44(3):211–7. doi: 10.1258/la.2010.009113. [DOI] [PubMed] [Google Scholar]
- 37.ExPASy Proteomics Server. Swiss Institute of Bioinformatics; http://ca.expasy.org/swiss-2dpage?combined=fibrinogen. [Google Scholar]
- 38.de Bosch NB, Mosesson MW, Ruiz-Saez A, Echenagucia M, Rodriquez-Lemoin A. Inhibition of thrombin generation in plasma by fibrin formation (antithrombin 1) Thromb Haemost. 2002;88(2):253–8. [PubMed] [Google Scholar]
- 39.Asselta R, Duga S, Tenchini ML. The molecular basis of quantitative fibrinogen disorders. J Thromb Haemost. 2006 Oct;4(10):2115–29. doi: 10.1111/j.1538-7836.2006.02094.x. [DOI] [PubMed] [Google Scholar]
- 40.Vu D, Neerman-Arbez M. Molecular mechanisms accounting for fibrinogen deficiency: from large deletions to intracellular retention of misfolded proteins. J Thromb Haemost. 2007 Jul;5(Suppl 1):125–31. doi: 10.1111/j.1538-7836.2007.02465.x. [DOI] [PubMed] [Google Scholar]
- 41.Hanss M, Biot F. A database for human fibrinogen variants. Ann N Y Acad Sci. 2001;936:89–90. doi: 10.1111/j.1749-6632.2001.tb03495.x. [DOI] [PubMed] [Google Scholar]
- 42.Doolittle RF, Goldbaum DM, Doolittle LR. Designation of sequences involved in the “coiled-coil” interdomainal connections in fibrinogen: constructions of an atomic scale model. J Mol Biol. 1978 Apr 5;120(2):311–25. doi: 10.1016/0022-2836(78)90070-0. [DOI] [PubMed] [Google Scholar]
- 43.Zhang JZ, Redman CM. Role of interchain disulfide bonds on the assembly and secretion of human fibrinogen. J Biol Chem. 1994 Jan 7;269(1):652–8. [PubMed] [Google Scholar]
- 44.Xu W, Chung DW, Davie EW. The assembly of human fibrinogen. The role of the amino-terminal and coiled-coil regions of the three chains in the formation of the alphagamma and betagamma heterodimers and alphabetagamma half-molecules. J Biol Chem. 1996 Nov 1;271(44):27948–53. [PubMed] [Google Scholar]
- 45.Asselta R, Duga S, Spena S, Peyvandi F, Castaman G, Malcovati M, et al. Missense or splicing mutation? The case of a fibrinogen Bbeta-chain mutation causing severe hypofibrinogenemia. Blood. 2004 Apr 15;103(8):3051–4. doi: 10.1182/blood-2003-10-3725. [DOI] [PubMed] [Google Scholar]
- 46.Suh TT, Holmback K, Jensen NJ, Daugherty CC, Small K, Simon DI, et al. Resolution of spontaneous bleeding events but failure of pregnancy in fibrinogen-deficient mice. Genes & Development. 1995;9(16):2020–33. doi: 10.1101/gad.9.16.2020. [DOI] [PubMed] [Google Scholar]
- 47.Homer VM, Brennan SO, George PM. Novel fibrinogen Bbeta gene mutation causing hypofibrinogenaemia. Thromb Haemost. 2002 Dec;88(6):1066–7. [PubMed] [Google Scholar]
- 48.Homer VM, Brennan SO, Ockelford P, George PM. Novel fibrinogen truncation with deletion of Bbeta chain residues 440-461 causes hypofibrinogenaemia. Thromb Haemost. 2002 Sep;88(3):427–31. [PubMed] [Google Scholar]
- 49.Mimuro J, Hamano A, Tanaka T, Madoiwa KS, Sugo T, Matsuda M, et al. Hypofibrinogenemia caused by a nonsense mutation in the fibrinogen Bbeta chain gene. J Thromb Haemost. 2003 Nov;1(11):2356–9. doi: 10.1046/j.1538-7836.2003.00425.x. [DOI] [PubMed] [Google Scholar]
- 50.Xu X, Wu J, Zhai Z, Zhou R, Wang X, Wang H, et al. A novel fibrinogen Bbeta chain frameshift mutation in a patient with severe congenital hypofibrinogenaemia. Thromb Haemost. 2006 Jun;95(6):931–5. doi: 10.1160/TH06-01-0020. [DOI] [PubMed] [Google Scholar]
- 51.Brennan SO, Fellowes AP, Faed JM, George PM. Hypofibrinogenemia in an individual with 2 coding (gamma82 A-->G and Bbeta235 P-->L) and 2 noncoding mutations. Blood. 2000 Mar 1;95(5):1709–13. [PubMed] [Google Scholar]
- 52.Wolberg AS, Aleman MM, Leiderman K, Machlus KR. Procoagulant Activity in Hemostasis and Thrombosis: Virchow’s Triad Revisited. Anesth Analg. 2012 Feb;114(2):275–85. doi: 10.1213/ANE.0b013e31823a088c. [DOI] [PMC free article] [PubMed] [Google Scholar]
- 53.Madeira CL, Layman ME, de Vera RE, Fontes PA, Ragni MV. Extrahepatic factor VIII production in transplant recipient of hemophilia donor liver. Blood. 2009 May 21;113(21):5364–5. doi: 10.1182/blood-2009-02-206979. [DOI] [PubMed] [Google Scholar]
- 54.Shovlin CL, Angus G, Manning RA, Okoli GN, Govani FS, Elderfield K, et al. Endothelial cell processing and alternatively spliced transcripts of factor VIII: potential implications for coagulation cascades and pulmonary hypertension. PLoS One. 2010;5(2):e9154. doi: 10.1371/journal.pone.0009154. [DOI] [PMC free article] [PubMed] [Google Scholar]
- 55.Ingram IC. The determination of plasma fibrinogen by the clot-weight method. Biochem J. 1952 Aug;51(5):583–5. doi: 10.1042/bj0510583. [DOI] [PMC free article] [PubMed] [Google Scholar]
- 56.Weitz JI, Hudoba M, Massel D, Maraganore J, Hirsh J. Clot-bound thrombin is protected from inhibition by heparin-antithrombin III but is susceptible to inactivation by antithrombin III-independent inhibitors. J Clin Invest. 1990 Aug;86(2):385–91. doi: 10.1172/JCI114723. [DOI] [PMC free article] [PubMed] [Google Scholar]
- 57.Hemker HC, Giesen P, Al Dieri R, Regnault V, de Smedt E, Wagenvoord R, et al. Calibrated automated thrombin generation measurement in clotting plasma. Pathophysiol Haemost Thromb. 2003;33(1):4–15. doi: 10.1159/000071636. [DOI] [PubMed] [Google Scholar]


