

INTRODUCTION
Identification of active gene regulatory elements is a key to understanding transcriptional control governing biological processes like cell-type specificity, differentiation, development, proliferation, and response to the environment. Mapping DNase I hypersensitive (HS) sites has historically been a valuable tool for identifying all different types of regulatory elements, including promoters, enhancers, silencers, insulators and locus control regions. This method utilizes DNase I to selectively digest nucleosome-depleted DNA (presumably by transcription factors), whereas DNA regions tightly wrapped in nucleosome and higher order structures are more resistant. The traditional low-throughput method for identifying DNase I HS sites uses Southern blots. Here, we describe the complete and improved protocol for DNase-seq, a high-throughput method that identifies DNase I HS sites across the whole genome by capturing DNase-digested fragments and sequencing them by high-throughput next generation sequencing. In a single experiment, DNase-seq can identify most active regulatory regions from potentially any cell type from any species with a sequenced genome.
RELATED INFORMATION
This DNase-seq protocol was derived from methodologies originally described by Boyle et al. 2008, and modified to overcome discontinued materials, reduce the amount of no-insert sequences contamination, and increase the signal-to-noise levels. An overview of the procedure is provided in Figure 1.
Figure 1.

Flow chart of DNase-seq protocol. Briefly, cells are lysed with detergent to release nuclei, and the nuclei are digested with optimal concentrations of DNase I. DNase I digested DNA is embedded in low-melt gel agarose plugs to reduce additional random shearing. DNA (while still in the plugs) are then blunt-ended, extracted and ligated to biotinylated linker 1 (represented by red bars in the figure). Excess linker is removed by gel purification, and biotinylated fragments (Linker 1 plus 20 bases of genomic DNA) are digested with MmeI, and captured by streptavidin-coated Dynal beads (represented by brown balls). Linker 2 (represented by the blue bars) is ligated to the 2 base overhang generated by MmeI, and the ditagged 20 bp DNAs are amplified by PCR and sequenced by Illumina/Solexa.
MATERIALS
Linkers and primers
-
Linker 1: annealed oligonucleotides 1a and 1b (Integrated DNA technologies, HPLC purified).
Oligo 1a: 5′-Bio-ACAGGTTCAGAGTTCTACAGTCCGAC -3′
Oligo 1b: 5′-GTCGGACTGTAGAACTCTGAAC-Amm -3′
Stock linkers are at the concentration of 25 pmol/μL. Linkers are annealed in 1X NEB Buffer 2, heat at 95 °C for 5 min and slow cool to room temperature. Store in aliquots at −20 °C.
-
Linker 2: annealed oligonucleotides 2a and 2b (Integrated DNA technologies, HPLC purified), annealed at the same way with Linker 1.
Oligo 2a: 5′-P-TCGTATGCCGTCTTCTGCTTG -3′
Oligo 2b: 5′-CAAGCAGAAGACGGCATACGANN -3′ (N represents any of A, T, G, and C)
Custom Illumina/Solexa sequencing primer: 5′-CCACCGACAGGTTCAGAGTTCTACAGTCCGAC -3′
PCR primer 1: 5′-CAAGCAGAAGACGGCATACGA -3′
PCR primer 2: 5′-AATGATACGGCGACCACCGACAGGTTCAGAGTTCTACAGTCCGA -3′
Reagents
Bovine serum albumin (BSA) (100X, New England Biolabs)
B & W buffer (2X; 10 mM Tris-Cl, pH 8.0, 1 mM EDTA, 2 M NaCl)
CHEF disposable plug mold (Bio-Rad)
Chloroform (J.T. Baker)
DNA ladder (25 bp) (Invitrogen)
DNA Polymerase Buffer (1X; 10 mM Tris-Cl, pH 8.0, 50 mM NaCl, 10 mM MgCl2, 1 mM dithiothreitol)
DNase I recombinant, RNase free (10 U/μL) and incubation Buffer (10X) (Roche Diagnostics)
dNTP, 10 mM (Roche Diagnostics)
Dynal Streptavidin beads (Invitrogen Dynal M-280)
EDTA (50 mM, pH 8.0)
Ethanol (70% and 100%)
Ethidium bromide(10 mg/ml)
Glycogen (20 mg/mL) (Roche Diagnostics)
InCert low melt agarose (1%, melted in sterile 50 mM EDTA pH 8.0 and stored at 4 °C) (Lonza)
LIDS Buffer (10 mM Tris-Cl, pH 8.0,1% Lauryl sulfate lithium salt (Sigma), 100 mM EDTA)
MmeI (2 U/μL, New England Biolabs)
NaOAc (3 M, pH 5.3)
NaOH (0.15 M)
NEB Buffer 2 (10X; New England Biolabs)
NEB Buffer 4 (10X; New England Biolabs)
Igepal CA-630 (Sigma)
Phenol (Invitrogen)
Phenol: chloroform: Isoamyl Alcohol (25:24:1, Invitrogen)
Phosphatase alkaline, shrimp (SAP; 1 U/μL, Roche Diagnostics)
Phosphate Buffered Saline without Mg2+/Ca2+(1X, pH 7.2, GIBCO)
Phusion DNA Polymerase (2 U/μL, Finnzymes) and Phusion HF reaction Buffer (5X)
RSB Buffer (10 mM Tris-Cl, pH 7.4, 10 mM NaCl, 3 mM MgCl2)
S-adenosylmethionine (SAM; 500 μM, New England Biolabs)
Spin-X filter (Fisher)
T4 DNA Polymerase (New England Biolabs)
TBE buffer (0.5X; 40 mM Tris-Cl, pH 8.3, 45 mM Boric Acid, 1 mM EDTA)
TE Buffer (1X; 10 mM Tris-Cl, pH 8.0, 1 mM EDTA)
Tris-HCl buffer (1X, pH8.0)
T4 Ligase (5 U/μL) and ligation buffer (10X) (Roche Diagnostics)
Trypan blue (Gibco)
Ultrapure™ Agarose (Invitrogen)
Ultrapure™ L.M.P. Agarose (Invitrogen)
Yeast Chromosome PFG molecular weight marker (New England Biolabs)
Equipment
Agarose gels (1%), TBE PAGE gels (4–20%, pre-made by Bio-rad) and electrophoresis equipment
-
Centrifuges:
Bench-top centrifuge for 1.5-ml microcentrifuge tubes
Centrifuge with a swing-out bucket rotor with cooling system, for 15-mL and 50-mL polypropylene tubes
Conical tubes, 15- and 50-mL
Eppendorf tubes (1.5-mL)
Green screened caps (Bio-Rad)
Ice & ice box
Dynal Magnetic stand for beads separator (Invitrogen)
Micropipettor and tips
Pulsed-field Gel Electrophoresis (CHEF) equipment (Bio-rad)
Razor blade (VWR Scientific)
Rotator
Shaker
Thermal cycler
Vortex mixer
Water baths or heating blocks preset to 37°C, 55°C, 75°C
METHOD
Nuclei isolation & DNase I digestion of nuclei to isolate high molecular weight DNase-treated DNA
Isolation of nuclei
-
1
Spin down 50 million human or mammalian cells in single-cell suspension at 900 rpm x 5 minutes; use vacuum or pipet (do not pour off liquid) to carefully remove the supernatant. Since the pellet is loose, leave a 1 mm-thick supernatant layer over the pellet during washes to reduce cell loss. Flick to resuspend the cell pellet in residual liquid.
-
2
Wash the cells twice with cold 1X PBS (50 mL PBS for each washing). If start with two or more than two tubes of cell culture, combine cells into one tube for the 1st wash. Resuspend final cell pellet in 500 μL cold RSB by gentle flicking and transfer to 15-mL conical tube (keep on ice). Rinse the 50-mL tube with 500 μL cold RSB to collect any remaining cells, and combine it with the first 500 μL cell suspension.
-
3
Slowly pour 14 mL of lysis buffer (cold RSB buffer + 0.1% IGEPAL CA-630 ) into the 15-mL tube that contains 1 mL cell suspension. Invert 5–10 times and look to make sure there is no detectable precipitatation at this step. Check cells after lysis with trypan blue under the microscope. Cells with good lysis should be 99% trypan blue stained.
-
4
Spin down immediately at 500g for 10 min at 4 °C to pellet nuclei, and remove supernatant completely. Do not leave any supernatant on the pellet.
DNase I digestion & embedding DNA into agarose plugs
In the following steps the word “flick” or “invert” is important, can not be replaced by “vortex” or pipet”.
-
5
During spin in Step 4, use 1X DNase incubation buffer to make various concentrations (0.01, 0.03, 0.1, 0.3, 1 U/μL) of recombinant DNase I in 5 Eppendorf tubes (1.5 mL) and keep on ice. When diluting DNase, make sure dilutions are extensively mixed. Pipet 12μL of diluted DNase into each of #3-#7 tubes, to make #3 (0.12U), #4 (0.4 U), #5 (1.2 U), #6 (4.0 U) and #7 (12U). Keep #1 and #2 empty.
-
6
Suspend nuclei (lysed cells) in 840 μL cold 1X DNase incubation buffer and mix by flicking. Pellet should appear white and fluffy and should be suspended completely.
-
7
Slowly pipet 120 μL of nuclei suspension into tubes #1-7 by using wide bore tips (tips clipped off with razor or scissors). Gently swirl to resuspend nuclei before each transfer.
-
8
Keep #1 tube on ice, and incubate #2-7 with 37 °C water bath for 15 min.
-
9
Prepare Melt InCert low melt gel agarose (1% in 50 mM EDTA) before the experiment starts. Melt a few tubes of agarose at 75 °C and after completely melted switch to 55 °C.
-
10
Slowly pipet 330 μL of 50 mM EDTA into each tube of #1-7 to stop the reaction, and invert tubes for 5 times to mix. Keep tubes at room temperature, and equilibrate at 55°C for 1 min.
-
11
Slowly pipet 450 μL/tube of low melt gel agarose into tubes #1-7. Invert 4 times to mix. Pipet mixture into Bio-Rad plug molds using wide bore pipets. Let set at 4 °C for approximately 5 min to solidify. The volume of each plug is ~80 μl. Low melt gel agarose plugs are used to stabilize high molecular weight DNA and protect against random shearing.
-
12
Carefully release plugs into in 50 mL LIDS buffer (50-mL conical tube), place the green screened plug caps (for washing plugs) between the tube and cap, and shake horizontally at 50–60 rpm for 1–2 hours at room temp. Keep plugs with different DNase1 concentrations in separate conical tubes.
-
13
Replace with fresh LIDS buffer and incubate tubes overnight at 37 °C horizontal without shaking.
-
14
Wash plugs for 5 times, with 50 mL of 50 mM EDTA per tube, 1 hour each, shaking at 60 rpm at room temperature,). Wash the filters and lids with distilled water for twice at the 4th and 5th washing to remove residual detergent from filter and lid threads. Make sure that no detergent-caused bubbles left in tubes after 5th washing.
-
15
Store the plugs indefinitely at 4 °C in 50 mM EDTA.
Identifying optimal DNase digestion by pulsed field gel (PFG) electrophoresis
-
16
Make 1% Agarose in 0.5X TBE. Load 1/3 of one plug from each DNase concentration into each lane by sliding the plug into each well using two metal spatulas. Use NEB yeast chromosome PFG marker to size smearing patterns. Keep 0.5X TBE running buffer chilled at 16 °C. Set up parameters as following:
20–60 second switch time
18 hours running time
6 Volts/cm (180 volts total)
-
17
See Figure 2. Optimal concentrations for DNase-chip are in bold. The smearing patterns (50–100kb to 1Mb in size) similar to that of 0.4 U, 1.2 U and 4.0 U DNase concentrations are usually ideal for making DNase-seq libraries from mammalian cells. Since DNase HS sites are not binary, but instead represent a continuum of signal intensities, the optimal size should include multiple DNase concentrations patterns to capture both the strongest and the weaker DNase sites. The smear size ranging from about 1 MB to 50–100 KB typically generates high quality DNase data. We have found that using more heavily digested DNA results in lower signal to noise. DNase concentrations to achieve optimal smearing sizes may differ for each cell line and therefore has to be determined empirically for each cell type. Use of this protocol on smaller eukaryotic genomes (such as yeast) may require different optimal smearing patterns.
Figure 2.

Pulsed field gel picture of DNaseI digested DNA isolated from Human Umbilical Vein Endothelial cells (HUVEC). Ideal PFG displays gradual and consistent changes in high molecular weight DNA fragment sizes as DNase I concentrations increase.
Blunt ending DNase-digested ends
Since DNase I nicks DNA and leaves single-strand overhangs, these overhangs need to be blunt ended by T4 DNA polymerase before ligating to blunt-ended Linker 1.
-
18
Wash the EDTA-soaked plugs twice with 1X T4 DNA polymerase buffer to remove EDTA, with 50 ml buffer per tube, one hour each time, shaking at 60 rpm at room temperature.
-
19
Remove all traces of liquid from 50-mL conical tubes and push plugs to the bottom of the tubes.
-
20
Mix the plugs with T4 DNA polymerase/buffer as following to polish ends in the 50-mL conical tubes, for 4 hours at room temp. Do not mix plugs from different optimal DNase concentrations (they will be combined in step 26) Shake the reactions occasionally.
DNA plug 80 μL
NEB Buffer 2 (10X) 12 μL
dNTPs (10 mM) 5 μL
T4 DNA Polymerase 6 μL
Water 99.2 μL
BSA (100X) 2 μL
Total volume: 204.2 μL
-
21
Do a quick rinse with 1X TE buffer to remove residual enzyme.
-
22
Transfer plugs to 1.5-ml Eppendorf tubes. Add 500 μl of 1X TE buffer. Heat at 65°C for 15 min to melt. Flick every 5 min to make sure agarose is dissolving. Extract with phenol, phenol: chloroform, and chloroform. Precipitate DNA with 1 μL of glycogen, 50μL of 3 M NaOAc and 1.0 mL of ethanol.
-
23
Pellet DNA at 4 °C, wash the pellet with 70% ETOH, spin and remove all residual liquid. Let dry for less than 4 min. Longer drying times may cause difficulty in dissolving the DNA pellet.
-
24
Resuspend DNA pellet in 40 μL of 10 mM Tris-Cl buffer (pH 8.0).
DNase-seq Library Construction
-
25
Anneal oligos to make Linker 1 and Linker 2 before the following steps start.
-
26
Ligation of DNase-treated ends to Linker 1:
Blunt-ended DNA (3 μg) (combine equal amount from each DNA concentration)
Ligation buffer (10X) 5 μL
T4 DNA ligase (10 U) 2 μL
Linker 1 (150 pmole) 6 μL of 25 pmol/μL
Add water to bring up total volume to 50 μL.
Incubate tubes in PCR machine, 20 °C, overnight.
-
27
Remove unligated linkers by gel purification. Make 0.8% Ultrapure L.M.P. low melt gel with 10 mM EDTA and 1X TBE. Run the above reactions for 30–50 min at 80 V in 10 mM EDTA and 1X TBE running buffer.
-
28
Cut out high molecular weight smear (leave linker-only band behind), put the gel into 500 μL of 1X TE buffer, heat at 65 °C for 15 min to melt. Gently flick every few minutes to make sure agarose is dissolving. Extract with phenol, phenol: chloroform, and chloroform. Precipitate DNA with 1 μL of glycogen, 50 μL of 3 M NaOAc, and 1 mL of ethanol. Wash the DNA pellet with 70% ethanol. Dry the pellet and resuspend DNA in 75 μL of water.
-
29
Digest ligated DNA with MmeI:
DNA 75 μL
NEB Buffer 4 (10X) 10 μL
SAM (500 μM) 10 μL
Mmel 5 μL
Total volume: 100 μL
Incubate the reaction at 37°C for 1.5 hour, and then add 3 μL of SAP (to prevent ligation of MmeI ends to each other), incubate 37°C for additional one hour.
-
30
Extract digestion with phenol: chloroform and chloroform. Precipitate DNA by using 1 μL of glycogen, 10 μL of 3 M NaOAc and 325 μL of ethanol. Wash the pellet with 70% ethanol. Dry the pellet and dissolve it with 50 μL of water.
-
31
Prepare 100 μL of Invitrogen Dynal M-280 beads for each sample. Wash the beads twice with 1ml of 1X TE, and once with 1mL of 1X B & W buffer. Use magnetic column and vacuum for all wash steps. Remove wash buffer before beginning next step.
-
32
Suspend the washed Dynal beads with the mixture of 50 μL of MmeI digested DNA and 50 μL of 2X B & W buffer. Incubate at 30 °C for 30 min, flick the tubes every 5 min to resuspend beads. Remove supernatant, and wash beads with 1mL of 1X TE for 5 times, followed by washing with 100 μL of 1X ligation buffer once. Remove wash buffer before next step.
-
33
Ligation to phosphorylated Linker 2 to dephosphorylated MmeI ends. Add the following to the Dynal beads (approximately 10 μL in volume):
Linker 2 (25 pmol/μL) 6 μL
Ligation buffer (10X) 10 μL
T4 ligase 2 μL
Water 72 μL
Total volume: 100 μL
Rotate the tube at room temperature for 4 hours.
-
34
Wash the beads once with 1 ml of 1X TE. Add 500 μL of 0.15 M NaOH directly to beads. This step denatures double-stranded DNA template on the beads and removes the non-biotinylated strand to eliminate false-positive sequencing signals from mismatched base pairs at the end of Linker 2. Rotate the tube at room temperature for 5 min, and wash the beads 5 times with 1mL of 1X TE. Resuspend the beads with 25 μL of 10 mM Tris-Cl buffer (pH 8.0).
-
35
Amplify the DNase-seq product by following PCR reactions:
10 μL of Dynal bead suspension
10 μL 5X Phusion HF reaction buffer
0.5 μL of PCR primer 1 (25 μM)
0.5 μL of PCR primer 2 (25 μM)
1.25 μL of 10 mM dNTP
0.5 μL of Phusion DNA polymerase
28 μL of water
Total volume: 50 μL
Denature at 98°C for 30 sec, followed by 12 amplification cycles (98°C, 10 sec; 60°C, 30 sec; 72°C, 15 sec.), extend at 72 °C for 7 min.
-
36
Load 1 μL of 25 bp DNA marker into one well and 50 μL of PCR products into 2 adjoining wells of 4–20% TBE PAGE gel. Perform electrophoresis for 2 hours at 120 V. Pry apart cassette and stain the gel in 1X TE/ethidium bromide in a clean container for 2–3 min. A Representative example of amplification is shown in Figure 3.
-
37
Cut out the 86 bp band (containing linkers + insert) with a clean razor blade, and place gel slice into a 0.5-mL Eppendorf tube whose bottom has been punctured by a 21-gauge needle. Set this tube into a 1.5-mL round-bottom Eppendorf tube, and spin the gel slice through the hole into the 1.5-mL tube, with full speed in a microfuge for 2 min.
-
38
Add 100 μL of 1X NEB Buffer 2 to the gel, and elute the DNA by rotating the tube gently at room temperature for 2 hours. Transfer the eluate and the gel debris onto the top of a Spin-X filter, and spin the filter in a microfuge for 2 min at full speed to remove traces of gel.
-
39
Add 1 μL of glycogen, 10 μL of 3 M NaOAc and 325 μL of ethanol, precipitate DNA at −20 °C for 30 min. Dry the DNA pellet in the air for 5 min, and resuspend in 10 μL of 1X TE buffer.
-
40
Run 1 μL of recovered DNA on 4–20% TBE gel and stain with Ethidium Bromide, to check the purity of recovered DNA.
-
41
Sequence libraries on Solexa/Illumina sequencers by using the custom sequencing primer.
Figure 3.
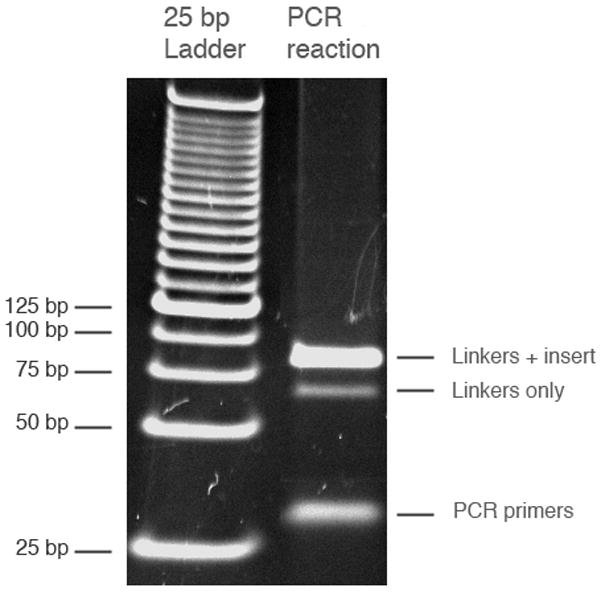
Gel picture of PCR reactions. 1 μL of 25 bp ladder and 30 μL of PCR reaction were loaded on a 4–20% TBE-PAGE gel. The linkers with insert band is 86 bp, the linker-only band is 66 bp, and the PCR primers are 20–30 bases.
TROUBLESHOOTING
Problem: Have less than 50 million cells.
[Step 1]
Solution: This protocol has been successfully applied to lower cell numbers. Volumes of buffers, DNase concentration, and final numbers of plugs can be reduced in proportion to the number of cells, but actual proportions need to be determined empirically for each cell type and cell number.
Problem: Cells are not lysed enough (trypan blue-stained cells are < 90 % under the microscope) or are overlysed, which often results in precipitation and clumping at the IGEPAL CA-630 lysis step.
[Step 3]
Solution: Some cell lines are more sensitive to IGEPAL CA-630 lysis than the others. Typically, we use a small amount of cells (5 million) to test different concentrations of IGEPAL CA-630 (0.5%, 0.1%, 0.05%, 0.025% and 0.01%).
Problem: the pulsed field gel electrophoresis shows that genomic DNA is not digested ideally by DNase I.
[Steps 16 and 17]
Solution: The typical DNase I concentrations that we use for digestion is 0.12 U, 0.4 U, 1.2 U, 4.0 U, and 12 U, which usually create good digestion patterns. For situations where samples are not digested enough, we recommend adding higher concentrations of DNase I, using less cells, or increasing digestion time. For samples over-digested, we recommend less DNase, more cells, or shorter digestion times.
Problem: the 86 bp DNA band does not appear after PCR amplification.
[Steps 35, 36 and 37]
Solution: The 86 bp DNA band contains linkers + 20 bases of insert sequence adjacent to the DNaseI cleavage site, while the 66 bp band contains only linkers. The absence of the 86 bp band may be due to a variety of reasons, such as efficiency of blunt ending, ligation, and MmeI digestion. Often the problem can be solved by repeating the blunt-ending steps [Steps 19–24], starting with larger amount of DNA (5 μg, [Step 26]), testing MmeI activity [Step 29], removing all traces of ethanol from precipitated DNA [Steps 23, 28, 30, 39], and avoiding losing the pellets.
DISCUSSION
Early studies support that nucleosome disrupted regions are hypersensitive to DNase I, and those regions are associated with gene activation in eukaryotes organisms. (Wu et al. 1979; Wu 1980; Keene et al. 1981; Levy et al. 1981 and Gross et al. 1988). In the last 25 years, hundreds of DNase I HS sites have been identified by the traditional Southern blotting method, and found to be highly correlated with a variety of active regulatory elements, including promoters, enhancers, silencers, insulators, and locus control regions. This makes DNase I HS sites identification an ideal tool for detecting all types of gene regulatory elements with a single assay. The low throughput Southern blotting assay is very informative, but is not suitable for whole genome analysis.
We and others have developed multiple high throughput techniques to assay large numbers of DNase HS sites using tiled arrays (DNase-chip) or high-throughput sequencing (DNase-seq). Both methods follow the basic technique of the traditional method of digesting nuclei with optimal concentrations of DNase I to preferentially cut at open chromatin sites. For DNase-chip and DNase-seq, DNase-digested ends are enriched and either hybridized to tiled arrays or sequenced by using next generation sequencing technologies such as Solexa/Illumina (Crawford et al. 2006; Sabo et al. 2006; Boyle 2008; Shibata et al. 2009; Hesselberth et al. 2009).
Although our data analysis has shown that DNase-seq is highly correlated with DNase-chip and both methods are highly correlated with an independent qPCR strategy (Boyle et al. 2008), they are distinct at many aspects. For example, DNase-seq has single base-pair resolution of digestion sites, has a high dynamic range, can only be applied genome-wide (unless an array capture-method is utilized), and analysis software is still relatively immature. In contrast, DNase-chip has lower resolution (300–700 bases due to shearing size), can be flexibly applied to either a local region or the entire genome based on the array design, and has a more mature set of analysis tools. Therefore, researchers need consider a few factors when they choose between DNase-seq and DNase-chip, including what specific genome portion they are interested in, the cost of sequencing versus tiled arrays, and resolution and sequencing depth required for their experimental purposes.
DNase-seq is a straightforward method that can be performed on potentially any cell type from any species with a sequenced genome. No prior knowledge is required with regards to histone modifications, transcription factor binding sites, gene annotation, or relative degree of sequence conservation between species. DNase-seq provides a good first step for identifying the location of most active gene regulatory elements. However, it does not directly disclose biological functions of these elements. Follow-up studies, such as chromatin immunoprecipitation and/or functional assays are needed to determine the precise function and activity associated with each regulatory region.
Acknowledgments
We would like to thank Shujun Luo and Gary Schroth (Illumina) for initial design of the DNase-seq library preparation, and Robin Hatton (University of Alabama, Birmingham) for help with optimizing DNase I digestion conditions of this protocol. Development and optimizations of the DNase-seq protocol were supported by NHGRI grant HG003169 to GEC.
References
- Boyle AP, Davis S, Shulha HP, Meltzer P, Margulies EH, Weng Z, Furey TS, Crawford GE. High -resolution mapping and characterization of open chromatin across the genome. Cell. 2008;132:311–22. doi: 10.1016/j.cell.2007.12.014. [DOI] [PMC free article] [PubMed] [Google Scholar]
- Crawford GE, Davis S, Scacheri PC, Renaud G, Green R, Meltzer PS, Wolfsberg TG, Collins FS. DNase-chip: a high-resolution method to identify DNase I hypersensitive sites using tiled microarrays. Nat Methods. 2006;3:503–9. doi: 10.1038/NMETH888. [DOI] [PMC free article] [PubMed] [Google Scholar]
- The ENCODE Project Consortium. Identification and analysis of functional elements in 1% of the human genome by the ENCODE pilot project. Nature. 2007;447:799–816. doi: 10.1038/nature05874. [DOI] [PMC free article] [PubMed] [Google Scholar]
- Gross DS, Garrard WT. Nuclease hypersensitive sites in chromatin. Annu Rev Biochem. 1988;57:159–97. doi: 10.1146/annurev.bi.57.070188.001111. [DOI] [PubMed] [Google Scholar]
- Hesselberth JR, Chen X, Zhang Z, Sabo PJ, Sandstrom R, Reynolds AP, Thurman RE, Neph S, Kuehn MS, Noble WS, et al. Global mapping of protein-DNA interactions in vivo by digital genomic footprinting. Nat Methods. 2009;6:283–9. doi: 10.1038/nmeth.1313. [DOI] [PMC free article] [PubMed] [Google Scholar]
- Keene MA, Corces V, Lowenhaupt K, Elgin SC. DNase I hypersensitive sites in Drosophila chromatin occur at the 5′ ends of regions of transcription. Proc Natl Acad Sci USA. 1981;78:143–6. doi: 10.1073/pnas.78.1.143. [DOI] [PMC free article] [PubMed] [Google Scholar]
- Levy A, Noll M. Chromatin fine structure of active and repressed genes. Nature. 1981;289:198–203. doi: 10.1038/289198a0. [DOI] [PubMed] [Google Scholar]
- Sabo PJ, Kuehn MS, Thurman R, Johnson BE, Johnson EM, Cao H, Yu M, Rosenzweig E, Goldy J, Haydock A, et al. Genome-scale mapping of DNase I sensitivity in vivo using tiling DNA microarrays. Nat Methods. 2006;3:511–8. doi: 10.1038/nmeth890. [DOI] [PubMed] [Google Scholar]
- Shibata Y, Crawford GE. Mapping Regulatory Elements by DNase I Hypersensitivity Chip (DNase-Chip) Methods in molecular biology. 2009;556:177–90. doi: 10.1007/978-1-60327-192-9_13. [DOI] [PubMed] [Google Scholar]
- Wu C. The 5′ ends of Drosophila heat shock genes in chromatin are hypersensitive to DNase I. Nature. 1980;286:854–60. doi: 10.1038/286854a0. [DOI] [PubMed] [Google Scholar]
- Wu C, Wong YC, Elgin SC. The chromatin structure of specific genes: II. Disruption of chromatin structure during gene activity. Cell. 1979;16:807–14. doi: 10.1016/0092-8674(79)90096-5. [DOI] [PubMed] [Google Scholar]
- Xi H, Shulha HP, Lin JM, Vales TR, Fu Y, Bodine DM, McKay RDG, Chenoweth JG, Tesar PJ, Furey TS, Ren B, Weng Z, Crawford GE. Identification and characterization of cell type-specific and ubiquitous chromatin regulatory structures in the human genome. PLoS Genet. 2007;3:1377–88. doi: 10.1371/journal.pgen.0030136. [DOI] [PMC free article] [PubMed] [Google Scholar]