

Abstract
AIM: To evaluate the potential interference of trunk fat (TF) mass on metabolic and skeletal metabolism.
METHODS: In this cross-sectional study, 340 obese women (mean age: 44.8 ± 14 years; body mass index: 36.0 ± 5.9 kg/m2) were included. Patients were evaluated for serum vitamin D, osteocalcin (OSCA), inflammatory markers, lipids, glucose and insulin (homeostasis model assessment of insulin resistance, HOMA-IR) levels, and hormones profile. Moreover, all patients underwent measurements of bone mineral density (BMD; at lumbar and hip site) and body composition (lean mass, total and trunk fat mass) by dual-energy X-ray absorptiometry.
RESULTS: Data showed that: (1) high TF mass was inversely correlated with low BMD both at lumbar (P < 0.001) and hip (P < 0.01) sites and with serum vitamin D (P < 0.0005), OSCA (P < 0.0001) and insulin-like growth factor-1 (IGF-1; P < 0.0001) levels; (2) a positive correlation was found between TF and HOMA-IR (P < 0.01), fibrinogen (P < 0.0001) and erythrocyte sedimentation rate (P < 0.0001); (3) vitamin D levels were directly correlated with IGF-1 (P < 0.0005), lumbar (P < 0.006) and hip (P < 0.01) BMD; and (4) inversely with HOMA-IR (P < 0.001) and fibrinogen (P < 0.0005).Multivariate analysis demonstrated that only vitamin D was independent of TF variable.
CONCLUSION: In obese women, TF negatively correlates with BMD independently from vitamin D levels. Reduced IGF-1 and increased inflammatory markers might be some important determinants that account for this relationship.
Keywords: Obesity, Skeleton, Vitamin D, Osteocalcin, Insulin resistance, Trunk fat, Inflammation
Core tip: Recent studies have shown that high fat mass content might be a risk factor for osteoporosis and fragility fractures. We evaluated obese women for vitamin D, osteocalcin, inflammatory markers, metabolic and hormones profile, bone mineral density (BMD) and body composition by dual-energy X-ray absorptiometry. Our results show that in obese women trunk fat negatively correlates with BMD independently from vitamin D levels, likely as consequence of reduced insulin-like growth factor-1 and increased inflammatory markers. These data indicate that obesity cannot be considered a protective factor for osteoporosis and suggest that obese postmenopausal women should be investigated for possible alterations of skeletal metabolism.
INTRODUCTION
Obesity and osteoporosis are two important global health problems with an increasing prevalence and high impact on both mortality and morbidity[1-4]. Interestingly, during the last decades both diseases have become a major health threat around the world, with age and female status increasing the risk of developing both obesity and osteoporosis[1-4].
Obesity has been considered a protection factor against the development of bone loss and osteoporosis, likely for increased androgen aromatization to estrogens in postmenopausal obese women[5,6]. Additionally, mechanical loading appears to stimulate bone formation by decreasing apoptosis and increasing proliferation and differentiation of both osteoblasts and osteocytes[7] by an activation of the intracellular signalling Wnt/β-catenin[8-10]. Therefore, the mechanical loading conferred by body weight justified the assumption of a protective role of obesity in the prevention of osteoporosis[5].
More recently, however, the belief that obesity is protective against osteoporosis has been questioned. In fact, epidemiologic and clinical studies have suggested that high level of fat mass might be a risk factor for osteoporosis and fragility fractures[11-13]. Indeed, adipose tissue not only stores excess triacylglycerols, but functions as an endocrine organ by releasing several adipokines, which appear to modulate glucose and lipid metabolism, inflammation, appetite and insulin resistance[14-16]. Additionally, the physiological relevance of adipose tissue for skeletal health likely resides in the role that some of these adipokines, such as interleukin (IL)-6 and tumor necrosis factor-α (TNF-α), might play by interfering with bone cells homeostasis[17-20]. Moreover, bone has started to be considered an endocrine organ itself affecting both body weight control and glucose homeostasis through the action of bone-derived factors such as osteocalcin and osteopontin[21,22]. This cross-talk between fat and bone seems to play an important role as homeostatic feedback system in which adipokines and molecules secreted by bone cells might represent the link of an active and functional bone-adipose-glucoseaxis[23-25], by mechanism(s) not fully clarified yet.
Recent evidences suggest that obesity is also associated with a chronic low-grade inflammation as depicted by increased plasma levels of C-reactive protein (CRP), pro-inflammatory cytokines such as TNF-α, IL-6, and osteopontin[26-30]. Few reports also depict an association between obesity and circulating low levels of vitamin D[31-33]. Nevertheless to date, few and conflicting data exist about possible correlation among vitamin D, total intact osteocalcin (OSCA), inflammatory markers[32-35] and bone mineral density (BMD) in obese women.
Since our group has recently demonstrated that a subpopulation of adult obese subjects had significant skeletal alterations, and that different levels of adiposity could differently affect skeletal health[12], the aim of the present study was to evaluate potential detrimental correlations between obesity, vitamin D levels, inflammation and BMD in obese female subjects.
MATERIALS AND METHODS
Patients
In this study, 340 women [mean age: 44.8 ± 14 years; mean body mass index (BMI): 36.0 ± 5.9 kg/m2] were selected from a cohort of patients admitted to the day hospital of Department of Experimental Medicine, Section of Medical Pathophysiology, Endocrinology and Nutrition, Policlinico Umberto I, Sapienza University of Rome, for the diagnosis and therapy of obesity.
The study received the approval of the Internal Review Board of our Institution. Exclusion criteria were chronic medical conditions or the use of medications affecting bone metabolism, hormonal and nutritional status, vitamin D supplementation, recent weight loss, and prior bariatric surgery interventions. Patients underwent complete medical history and clinical examination. Anthropometric measurements included weight and height; body weight was measured as the subjects were fasting overnight and wearing underwear. BMI was calculated as weight (kg)/height (m2).
Biochemical analysis
Hormones, lipid profile, glucose, insulin levels, fibrinogen, CRP, calciotropic hormones were evaluated. Additionally, OSCA, the well known most abundant non-collagenicbone matrix protein, marker of bone turnover, was measured by standard methods. Measurements of glucose, total cholesterol, high-density lipoprotein cholesterol, low-density lipoprotein cholesterol, triglycerides and fibrinogen concentrations were assessed by standard immune-enzymatic methods, while insulin and vitamin D levels were measured by radioimmunoassay. Serum parathyroid hormone was measured by a two-site immunoradiometric assay, and CRP circulating levels were measured by latex agglutination. Homeostasis model assessment of insulin resistance (HOMA-IR) was calculated from fasting plasma insulin and glucose levels using the formula: insulin × glucose/22.5 (mU/L × mmol/L).
Dual-energy-X-ray absorptiometry measurement
Body fat mass, fat-free mass (kg) and both lumbar and femoral BMD were measured by dual-energy-X-ray absorptiometry (DEXA) (Hologic 4500 RDR), with coefficient of variation of < 1% for bone density and < 1.5% for fat mass[12]. Amount of trunk fat mass was distinguished from peripheral and appendicular fat mass as a measure of abdominal adiposity. In particular, trunk fat was defined as the adipose tissue localized within the region below the chin, delineated by vertical lines within the left and right glenoid fossae bordering laterally to the ribs, and by the oblique lines that cross the femoral necks and converge below the pubic symphysis.
Statistical analysis
Results are expressed as mean ± SD and compared by means of analysis of variance for repeated measures. Pearson correlations were used to examine associations between variables, and multiple regression analyses were used to determine the influence of TF and vitamin D on the different variables. P < 0.05 defined differences statistically significant as described elsewhere[12]. Multivariate linear regression analysis was carried out to identify the independent relations of TF by including the parameters which were related with TF on bivariate analysis by using SPSS/4.0 (SPSS, Chicago, IL, United States) and SAS/6.4 (SAS Institute, Cary, NC, United States).
RESULTS
A total of 340 obese women were observed and clinical characteristics are shown in Table 1, which shows the presence of obesity.
Table 1.
Baseline demographics of the study population (mean ± SD)
| Characteristics | n = 340 |
| Mean age (yr) | 44.8 ± 14 |
| BMI (kg/m2) | 36 ± 5.9 |
| Total cholesterol (mg/dL) | 196 ± 41 |
| HDL-cholesterol (mg/dL) | 49 ± 11 |
| Triglycerides (mg/dL) | 120 ± 68 |
| HOMA-IR | 4.7 ± 3 |
| SHBG (nmol/L) | 42 ± 58.5 |
| PTH (pg/mL) | 45 ± 21 |
| Leptin (nmol/L) | 75 ± 30 |
| Vitamin D | 20.5 ± 9.8 |
| 17β-estradiol | 70 ± 54 |
BMI: Body mass index; HOMA-IR: Homeostasis model assessment of insulin resistance; Vitamin D: 25-hydroxyvitamin D; PTH: Parathyroid hormone; HDL: High-density lipoprotein; SHBG: Sex hormone binding globulin.
Initial analysis of the obese subjects showed a positive correlation between body weight and lumbar and femoral BMD (data not shown) as previously reported in the literature[6,36]. However, further evaluation to characterize potential relationship between fat tissue distribution and skeleton alteration showed a significant inverse relationship between TF and BMD at both lumbar and femoral sites (Figure 1), suggesting a detrimental role of abdominal fat on skeletal mass.
Figure 1.
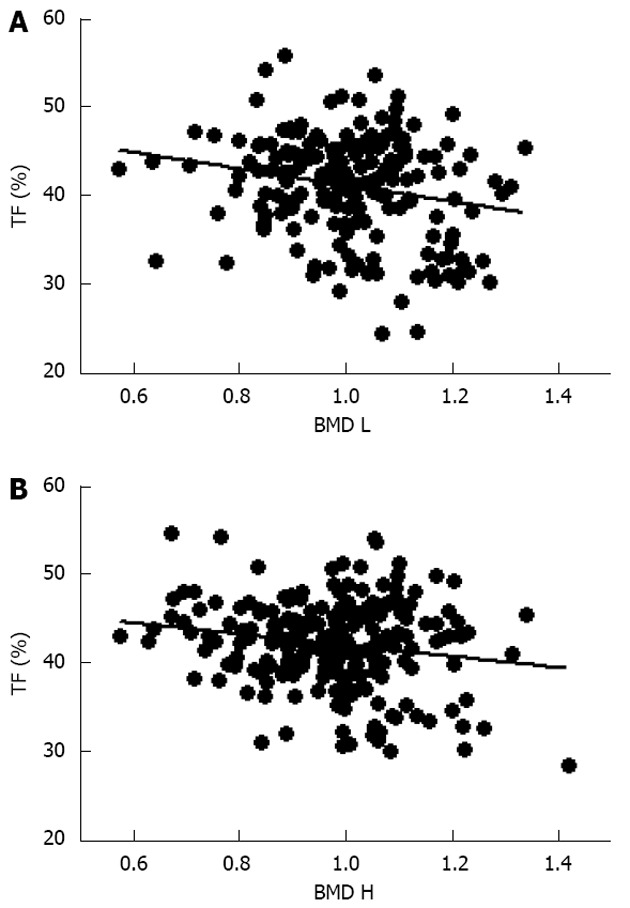
Correlation between trunk fat and bone mineral density at both lumbar and femoral sites. A: Trunk fat (TF) percentage and bone mineral density at the lumbar (BMD L; r = -0.22, P < 0.001); B: Bone mineral density at the hip (BMD H, r = -0.22, P < 0.01).
Further evaluation of these obese women demonstrated that vitamin D levels were significant lower than normal range, and these values were inversely correlated to either BMI (data not shown) and trunk adiposity (Figure 2A). Additionally, to correlate obesity with alteration of bone markers, OSCA levels were evaluated in these female subjects and correlated to adipose tissue. As shown in Figure 2B, OSCA levels were inversely correlated with TF mass suggesting that adipose tissue might have a detrimental effect on this specific osteoblast-specific hormone. Also insulin-like growth factor-1 (IGF-1) serum levels were inversely correlated with TF (Figure 2C). Moreover a strong direct correlation was found between vitamin D and OSCA levels (data not shown). Further, a direct relationship between TF and HOMA-IR index (Figure 3A), and inflammatory markers such as fibrinogen (Figure 3B) and erythrocyte sedimentation rate (Figure 3C) was found in these obese adult female subjects indicating, as suggested by others[21,22], a potential role of TF in glucose homeostasis. Analysis carried out to investigate possible relationship between IGF-1 levels and vitamin D status showed a strong direct relationship (Figure 4A). Also, vitamin D levels were directly correlated with BMD at the femoral (Figure 4B) and lumbar (Figure 4C) sites and inversely correlated with HOMA-IR (Figure 5A) and fibrinogen levels (Figure 5B). Since it is known that obesity is associated with a low-grade inflammation[37,38], specific markers were also investigated. As expected, inflammatory markers were significantly elevated in obese women (Table 2) with a strong correlation with degree of obesity. Multivariate analysis demonstrated that only vitamin D was the only parameter that resulted to be independent from TF (Table 3).
Figure 2.
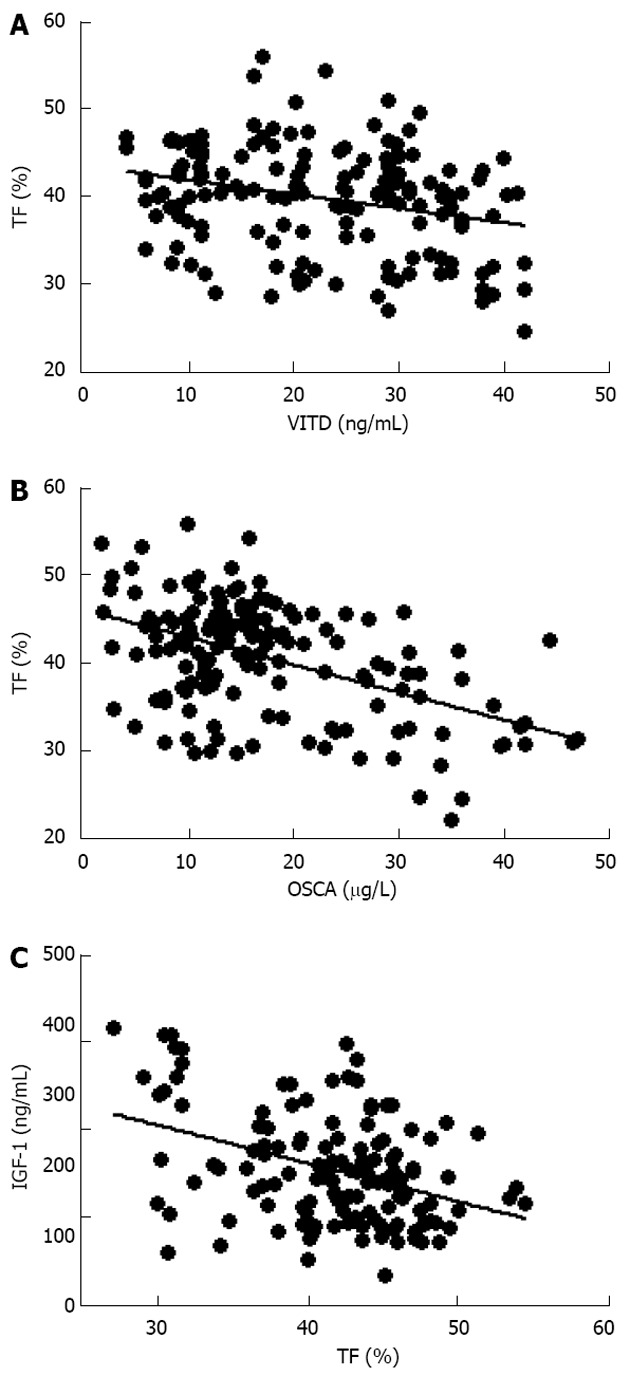
Inverse relationship between trunk fat percentage and vitamin D (A; r = -0.27, P < 0.0005), osteocalcin (B; r = -0.49, P < 0.0001) and insulin-like growth factor-1 (C; r = -0.31, P < 0.0001) plasma levels in obese women. VITD: Vitamin D; OSCA: Osteocalcin; IGF-1: Insulin-like growth factor-1; TF: Trunk fat.
Figure 3.
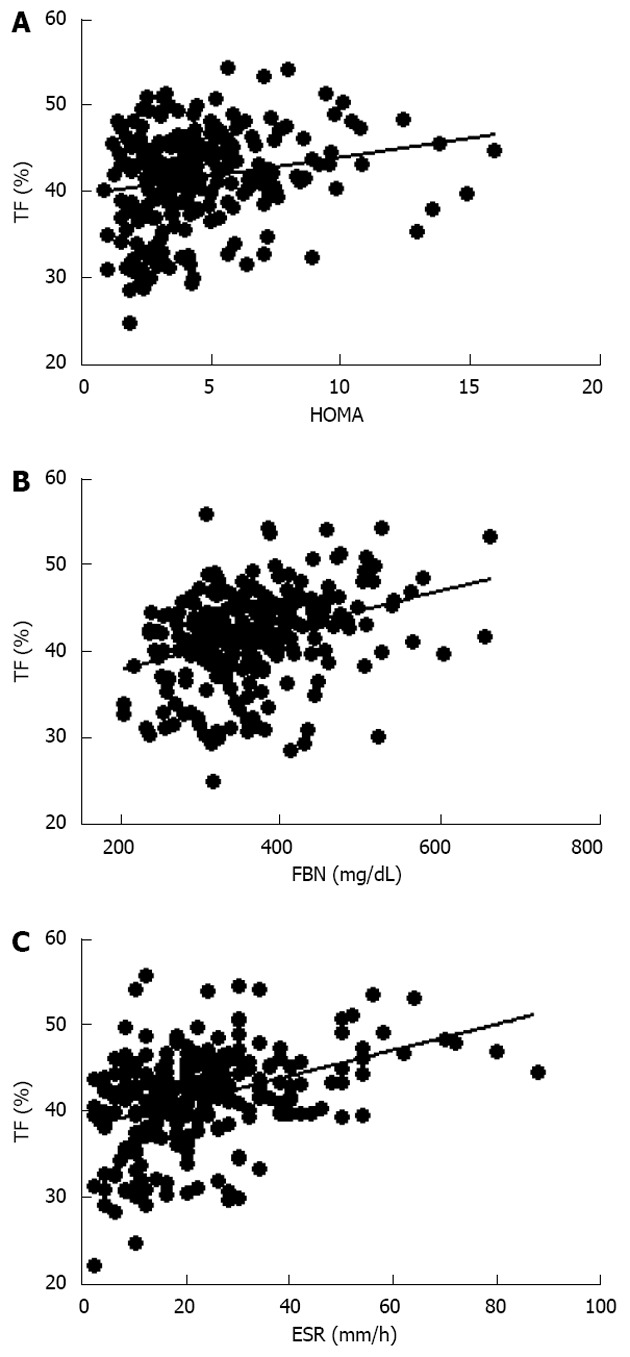
Direct relationship between trunk fat percentage, homeostasis model assessment index (A; r = 0.18, P < 0.01), fibrinogen (B; r = 0.44, P < 0.0001) and erythrocyte sedimentation rate (C; r = 0.29, P < 0.0001) in obese women. HOMA: Homeostasis model assessment; FBN: Fibrinogen; ESR: Erythrocyte sedimentation rate; TF: Trunk fat.
Figure 4.
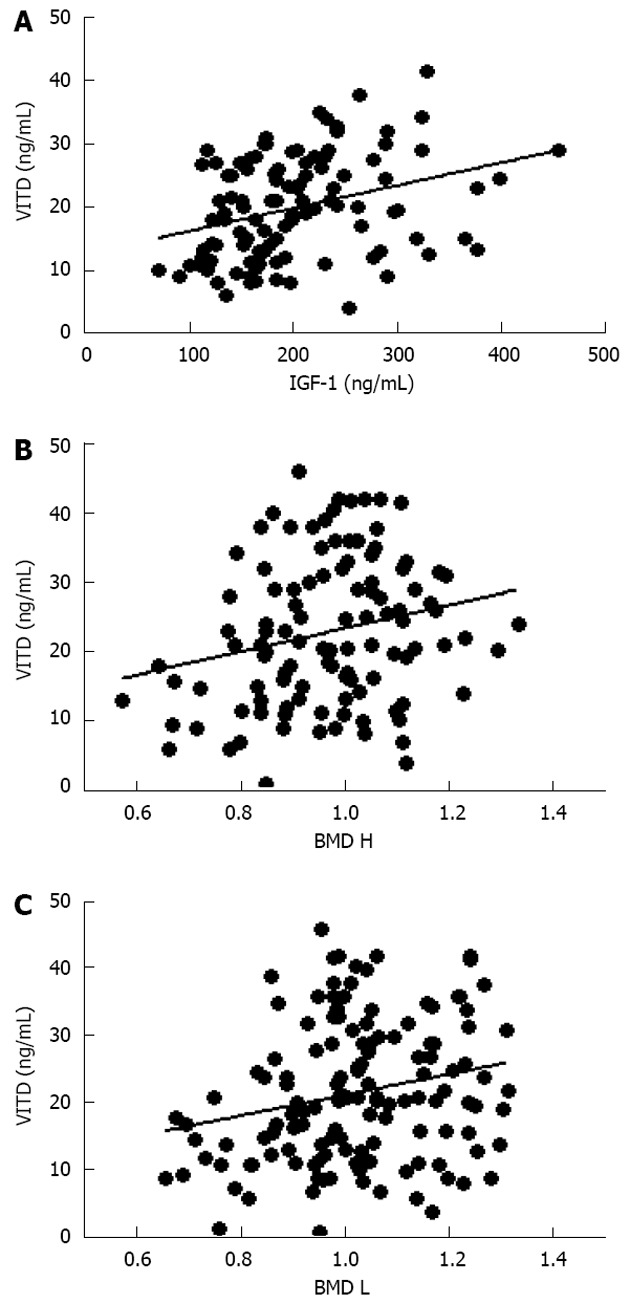
Direct relationship between vitamin D, insulin-like growth factor-1 (A; r = 0.32, P < 0.0005), hip (B; r = 0.23, P < 0.01) and lumbar bone mineral density (C; r = 0.19, P < 0.005) in obese women. VITD: Vitamin D; IGF-1: Insulin-like growth factor-1; BMD H: Bone mineral density at the hip; BMD L: Bone mineral density at the lumbar; TF: Trunk fat.
Figure 5.
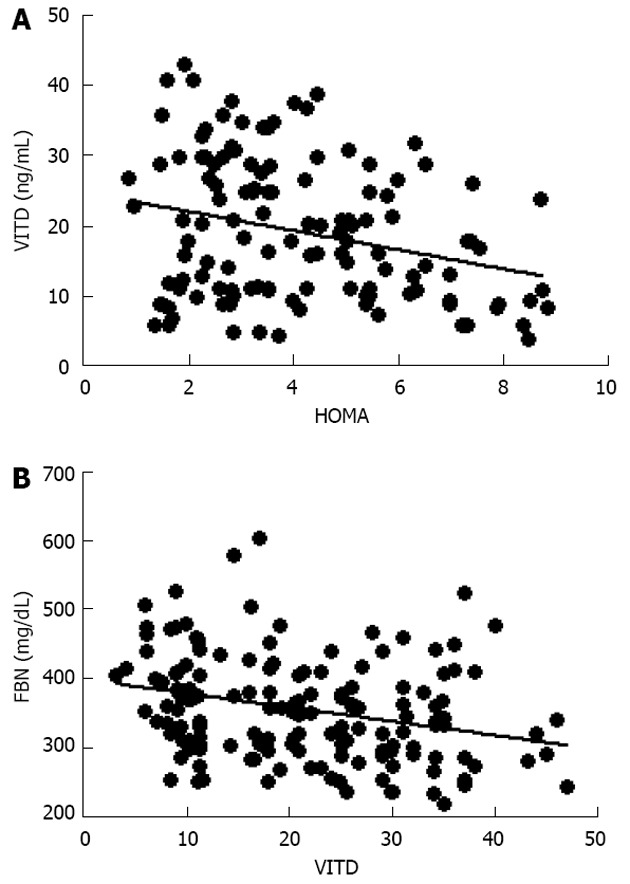
Inverse relationship between vitamin D levels with homeostasis model assessment (A; r = -0.27, P < 0.001) and with fibrinogen (B; r = -0.28, P < 0.0005). VITD: Vitamin D; HOMA: Homeostasis model assessment; FBN: Fibrinogen.
Table 2.
Biochemical and hormonal characteristics of the study population according to different body mass index
| BMI < 30 kg/m2 | BMI 30-35 kg/m2 | BMI 35-40 kg/m2 | BMI > 40 kg/m2 | |
| (n = 80) | (n = 100) | (n = 80) | (n = 80) | |
| BMI | 27 ± 1.2 | 32.5 ± 1b | 37 ± 1.5b | 44 ± 2b |
| Mean age (yr) | 46.5 ± 15 | 45 ± 14 | 46 ± 13 | 43 ± 14 |
| Total-cholesterol (mg/dL) | 199 ± 54 | 198 ± 41 | 204 ± 40 | 190 ± 32 |
| HDL-cholesterol (mg/dL) | 52 ± 13 | 50 ± 11 | 50 ± 10 | 46 ± 10 |
| Triglycerides (mg/dL) | 114 ± 79 | 117 ± 61 | 130 ± 72 | 122 ± 68 |
| Fibrinogen (mg/dL) | 346 ± 102 | 341 ± 63 | 368 ± 85 | 421 ± 86b |
| C-reactive protein (ng/mL) | 2 ± 0.9 | 2.8 ± 0.9 | 5.0 ± 1.4b | 5.5 ± 2.1b |
| HOMA-IR | 2.8 ± 0.9 | 3.1 ± 0.8 | 5.0 ± 2.6b | 6.4 ± 2.2b |
| PTH (pg/mL) | 40 ± 15 | 42 ± 20 | 46 ± 23 | 48 ± 19 |
| Vitamin D | 26 ± 9 | 20 ± 10b | 16 ± 8b | 15 ± 10b |
P < 0.01 vs BMI < 30 kg/m2. BMI: Body mass index; HOMA-IR: Homeostasis model assessment of insulin resistance; Vitamin D: 25-hydroxyvitamin D; PTH: Parathyroid hormone; HDL: High-density lipoprotein.
Table 3.
Multivariate analysis showing that vitamin D is the only parameter that is independently associated with trunk fat percentage
| Unstandardized coefficients1 | Standardized coefficients1 | ||||
| Model | B | SE | Beta | t | P value |
| 1 (constant) | 52.054 | 8.498 | 6.125 | 0.000 | |
| Lumbar BMD | 6.570 | 8.121 | 0.167 | 0.809 | 0.437 |
| Hip BMD | -9.971 | 7.687 | -0.259 | -1.029 | 0.224 |
| Vitamin D | -0.359 | 0.077 | -1.029 | -4.666 | 0.001 |
| Osteocalcin | 0.134 | 0.111 | 0.255 | 1.208 | 0.255 |
| IGF-1 | -0.002 | 0.014 | -0.022 | -0.114 | 0.916 |
Dependent variable of trunk fat. IGF-1: Insulin-like growth factor-1; BMD: Bone mineral density.
DISCUSSION
The results presented herein show for the first time that in obese women, the amount of TF is negatively correlated with BMD, vitamin D, osteocalcin and IGF-1 levels, whereas it is directly correlated with insulin insensitivity and inflammation markers. Also, vitamin D status was directly correlated with IGF-1 levels and multivariate analysis showed that it was the only parameter that was independently associated with TF. This represents a novel finding in obese women, suggesting that vitamin D and IGF-1 levels might be considered a sensitive predictor and indicator of skeletal health, as bone mineral density alteration itself.
Fat tissue is present throughout the body and, in cases of obesity, can cover up to 50% or more of the entire body mass. White adipose tissue (WAT) is the most abundant form, found in both subcutaneous and intra-abdominal regions. WAT was first regarded only as an energy reservoir, however it is now well recognized as an endocrine organ due to its secretion of circulating adipokines and pro-inflammatory factors[14-20]. Obesity, defined as an abundance of WAT, has always been depicted as a protective factor against the development of bone loss and osteoporosis[5,6], nevertheless several groups, including ours[11-13], have recently demonstrated that high amounts of adipose tissue accumulation might not be considered a protective factor against the development of osteoporosis and fracture risk.
Thus, the main objective of our study was to evaluate the relationship between obesity (BMI > 30 kg/m2) and BMD modifications. Interestingly, while BMD was correlated to BMI, body weight appeared to be a protective factor against low bone mass (data not shown), as previously reported in the literature[5,6], which led to claim a protective role of obesity against bone loss and osteoporosis. However, data were re-analyzed to evaluate potential detrimental role of body fat distribution on skeletal health. This evaluation demonstrated that higher level of TF correlated with lower bone mass, strongly suggesting that BMI might not be considered the unique parameter to evaluate potential detrimental effect of fat tissue as risk factors for cardiovascular, metabolic or skeletal disorders[1-2,23,39-42]. Indeed, recent data indicate that TF might correlate with skeletal damages in young population as well[43].
Moreover, although obese subjects have greater calories intake than subjects with normal body weight, they often show nutritional deficiencies or alterations in hormonal or metabolic parameters. For instance, obese women show very low concentrations of vitamin D, as descirbed by others[33-35], as well as the osteoblast-produced OSCA, which were inversely correlated to TF mass, suggesting that alteration of biochemical and hormonal parameters might be an indicator of skeletal damage and decreased density as diagnosed by DEXA. As previously shown by others, we also observed an inverse relationship between vitamin D and BMI, likely due to the amount of adipose tissue, which, in individuals who are not obese, is inversely associated with its blood concentrations[44,45]. As described in the literature,we confirmed a positive correlation between low vitamin D circulating levels and low BMD also in obese women, but we found a new direct relationship between vitamin D, IGF-1 and TF; this highlights the fact that bone tissue might indeed play a pivotal role in the recently described feedback among fat, bone and glucose metabolism[25,46,47].
In the last years, potential association between obesity, cardiovascular and metabolic diseases such osteoporosis, has been actively investigated and common pathogenic links have been proposed since all are influenced by genetic and environmental factors, or by the interaction of such factors. Aging is associated with these chronic diseases and with a high incidence of bone loss and bone marrow adiposity; in turn, bone remodeling and adiposity are regulated through a complex concert of adipokines and hormone interactions. Indeed, adipocytes and osteoblasts derive from a common progenitor cell, that is the mesenchymal stem cell[23,48], and several potential mechanisms have been proposed to explain the complex relationship between adipose and bone tissues[47-50].
Adipose tissue was long viewed as a passive energy reservoir, but since the discovery of leptin, and other adipose tissue-derived factors[28,49,50], fat has been considered an active endocrine organ. Indeed, it (TF) secretes inflammatory cytokines, such as IL-6 and TNF-α[51], which appear to play a pivotal role in the maintenance of the low-grade inflammatory status of obesity, leading to the development of adverse metabolic and cardiovascular consequences and, likely, contributing to the detrimental effect of fat tissue on the skeleton[20].
Evidences suggest that an inflammatory status might be involved in the pathogenesis of osteoporosis promoting osteoclasts differentiation and activity and maintaining an altered bone remodeling[52-57]. Recently, CRP, an inflammatory marker, has been identified as an independent risk factor for cardiovascular events in healthy postmenopausal women[52-57] and high serum levels of CRP are also associated with lower BMD, higher levels of bone turnover markers and, more recently, greater risk of fracture[52-57], further suggesting a role of inflammation in bone loss pathogenesis. At the present time it is unknown whether CRP plays a pivotal role as mediator of bone loss similarly to its role in atherosclerosis[57] or whether is only a marker of systemic inflammation, linked to bone health alterations[53]. In the present study we found an association between inflammatory markers, i.e., of erythrocyte sedimentation rate and fibrinogen, vitamin D levels and insulin resistance, thus suggesting that a higher degree of inflammation might be in part responsible for deterioration of bone health.
Finally, we also found a negative correlation between high degree of obesity and IGF-1 level (inversely related to lean mass, data not shown) which also correlated with lower BMD in obese women. The importance of this factor in bone tissue homeostasis is well known[57] both during infancy and adulthood, but our data further indicate that a complex metabolic and hormonal pattern alteration exist in obesity which is linked to bone homeostasis alteration.
In conclusion, our data show that TF plays a detrimental role in skeletal metabolism both in term of low BMD, bone markers and systemic factors influencing skeletal tissue. Finally, alteration of vitamin D levels, and inflammation status, in association with low OSCA, altered insulin sensitivity might indicate the existence of an important interplay between bone tissue, energy metabolism and inflammations, which might suggest a common pathogenic mechanism in the development of metabolic, cardiovascular and skeletal diseases. Further studies are however needed to fully clarify and characterize the mechanism(s) underlying the role of trunk fat in the development effect of chronic diseases, such diabetes, cardiovascular disease and osteoporosis.
COMMENTS
Background
Obesity and osteoporosis are two important global health problems with an increasing prevalence and high impact on both mortality and morbidity. The belief that obesity is protective against osteoporosis has been questioned. In fact, epidemiologic and clinical studies have suggested that high level of fat mass might be a risk factor for osteoporosis and fragility fractures
Research frontiers
Recent evidences suggest that obesity is also associated with a chronic low-grade inflammation as depicted by increased plasma levels of C-reactive protein, pro-inflammatory cytokines. Few reports also depict an association between obesity and circulating low levels of vitamin D.
Innovations and breakthroughs
The results presented herein show for the first time that in obese women, the amount of trunk fat (TF) is negatively correlated with bone mineral density (BMD), vitamin D, osteocalcin and insulin-like growth factor-1 (IGF-1) levels, whereas it is directly correlated with insulin insensitivity and inflammation markers.
Applications
This data show that TF plays a detrimental role in skeletal metabolism both in term of low BMD, bone markers and systemic factors influencing skeletal tissue.
Peer review
This is an interesting article on the associations of trunk fat with inflammation biomarkers, IGF-1 and bone density in severe obese women.
Footnotes
P- Reviewers Andrei S, Kanda T S- Editor Zhai HH L- Editor A E- Editor Li JY
References
- 1.Hu FB. Overweight and obesity in women: health risks and consequences. J Womens Health (Larchmt) 2003;12:163–172. doi: 10.1089/154099903321576565. [DOI] [PubMed] [Google Scholar]
- 2.McTigue K, Larson JC, Valoski A, Burke G, Kotchen J, Lewis CE, Stefanick ML, Van Horn L, Kuller L. Mortality and cardiac and vascular outcomes in extremely obese women. JAMA. 2006;296:79–86. doi: 10.1001/jama.296.1.79. [DOI] [PubMed] [Google Scholar]
- 3.Rössner S. Obesity: the disease of the twenty-first century. Int J Obes Relat Metab Disord. 2002;26 Suppl 4:S2–S4. doi: 10.1038/sj.ijo.0802209. [DOI] [PubMed] [Google Scholar]
- 4.NIH Consensus Development Panel on Osteoporosis Prevention, Diagnosis, and Therapy. Osteoporosis prevention, diagnosis, and therapy. JAMA. 2001;285:785–795. [Google Scholar]
- 5.Felson DT, Zhang Y, Hannan MT, Anderson JJ. Effects of weight and body mass index on bone mineral density in men and women: the Framingham study. J Bone Miner Res. 1993;8:567–573. doi: 10.1002/jbmr.5650080507. [DOI] [PubMed] [Google Scholar]
- 6.Albala C, Yáñez M, Devoto E, Sostin C, Zeballos L, Santos JL. Obesity as a protective factor for postmenopausal osteoporosis. Int J Obes Relat Metab Disord. 1996;20:1027–1032. [PubMed] [Google Scholar]
- 7.Ehrlich PJ, Lanyon LE. Mechanical strain and bone cell function: a review. Osteoporos Int. 2002;13:688–700. doi: 10.1007/s001980200095. [DOI] [PubMed] [Google Scholar]
- 8.Jensen LB, Kollerup G, Quaade F, Sørensen OH. Bone minerals changes in obese women during a moderate weight loss with and without calcium supplementation. J Bone Miner Res. 2001;16:141–147. doi: 10.1359/jbmr.2001.16.1.141. [DOI] [PubMed] [Google Scholar]
- 9.Bonewald LF, Johnson ML. Osteocytes, mechanosensing and Wnt signaling. Bone. 2008;42:606–615. doi: 10.1016/j.bone.2007.12.224. [DOI] [PMC free article] [PubMed] [Google Scholar]
- 10.Sawakami K, Robling AG, Ai M, Pitner ND, Liu D, Warden SJ, Li J, Maye P, Rowe DW, Duncan RL, et al. The Wnt co-receptor LRP5 is essential for skeletal mechanotransduction but not for the anabolic bone response to parathyroid hormone treatment. J Biol Chem. 2006;281:23698–23711. doi: 10.1074/jbc.M601000200. [DOI] [PubMed] [Google Scholar]
- 11.Premaor MO, Pilbrow L, Tonkin C, Parker RA, Compston J. Obesity and fractures in postmenopausal women. J Bone Miner Res. 2010;25:292–297. doi: 10.1359/jbmr.091004. [DOI] [PubMed] [Google Scholar]
- 12.Greco EA, Fornari R, Rossi F, Santiemma V, Prossomariti G, Annoscia C, Aversa A, Brama M, Marini M, Donini LM, et al. Is obesity protective for osteoporosis? Evaluation of bone mineral density in individuals with high body mass index. Int J Clin Pract. 2010;64:817–820. doi: 10.1111/j.1742-1241.2009.02301.x. [DOI] [PubMed] [Google Scholar]
- 13.Kim KC, Shin DH, Lee SY, Im JA, Lee DC. Relation between obesity and bone mineral density and vertebral fractures in Korean postmenopausal women. Yonsei Med J. 2010;51:857–863. doi: 10.3349/ymj.2010.51.6.857. [DOI] [PMC free article] [PubMed] [Google Scholar]
- 14.Cinti S. The adipose organ: endocrine aspects and insights from transgenic models. Eat Weight Disord. 2001;6:4–8. [PubMed] [Google Scholar]
- 15.Attie AD, Scherer PE. Adipocyte metabolism and obesity. J Lipid Res. 2009;50 Suppl:S395–S399. doi: 10.1194/jlr.R800057-JLR200. [DOI] [PMC free article] [PubMed] [Google Scholar]
- 16.Klein J, Perwitz N, Kraus D, Fasshauer M. Adipose tissue as source and target for novel therapies. Trends Endocrinol Metab. 2006;17:26–32. doi: 10.1016/j.tem.2005.11.008. [DOI] [PubMed] [Google Scholar]
- 17.Gómez-Ambrosi J, Rodríguez A, Catalán V, Frühbeck G. The bone-adipose axis in obesity and weight loss. Obes Surg. 2008;18:1134–1143. doi: 10.1007/s11695-008-9548-1. [DOI] [PubMed] [Google Scholar]
- 18.Gimble JM, Zvonic S, Floyd ZE, Kassem M, Nuttall ME. Playing with bone and fat. J Cell Biochem. 2006;98:251–266. doi: 10.1002/jcb.20777. [DOI] [PubMed] [Google Scholar]
- 19.Kershaw EE, Flier JS. Adipose tissue as an endocrine organ. J Clin Endocrinol Metab. 2004;89:2548–2556. doi: 10.1210/jc.2004-0395. [DOI] [PubMed] [Google Scholar]
- 20.Magni P, Dozio E, Galliera E, Ruscica M, Corsi MM. Molecular aspects of adipokine-bone interactions. Curr Mol Med. 2010;10:522–532. doi: 10.2174/1566524011009060522. [DOI] [PubMed] [Google Scholar]
- 21.Clemens TL, Karsenty G. The osteoblast: an insulin target cell controlling glucose homeostasis. J Bone Miner Res. 2011;26:677–680. doi: 10.1002/jbmr.321. [DOI] [PubMed] [Google Scholar]
- 22.Ferron M, McKee MD, Levine RL, Ducy P, Karsenty G. Intermittent injections of osteocalcin improve glucose metabolism and prevent type 2 diabetes in mice. Bone. 2012;50:568–575. doi: 10.1016/j.bone.2011.04.017. [DOI] [PMC free article] [PubMed] [Google Scholar]
- 23.Migliaccio S, Greco EA, Fornari R, Donini LM, Lenzi A. Is obesity in women protective against osteoporosis? Diabetes Metab Syndr Obes. 2011;4:273–282. doi: 10.2147/DMSO.S11920. [DOI] [PMC free article] [PubMed] [Google Scholar]
- 24.Zaidi M, Buettner C, Sun L, Iqbal J. Minireview: The link between fat and bone: does mass beget mass? Endocrinology. 2012;153:2070–2075. doi: 10.1210/en.2012-1022. [DOI] [PMC free article] [PubMed] [Google Scholar]
- 25.Schwetz V, Pieber T, Obermayer-Pietsch B. The endocrine role of the skeleton: background and clinical evidence. Eur J Endocrinol. 2012;166:959–967. doi: 10.1530/EJE-12-0030. [DOI] [PubMed] [Google Scholar]
- 26.Kaptoge S, White IR, Thompson SG, Wood AM, Lewington S, Lowe GD, Danesh J. Associations of plasma fibrinogen levels with established cardiovascular disease risk factors, inflammatory markers, and other characteristics: individual participant meta-analysis of 154,211 adults in 31 prospective studies: the fibrinogen studies collaboration. Am J Epidemiol. 2007;166:867–879. doi: 10.1093/aje/kwm191. [DOI] [PubMed] [Google Scholar]
- 27.Kiefer FW, Zeyda M, Todoric J, Huber J, Geyeregger R, Weichhart T, Aszmann O, Ludvik B, Silberhumer GR, Prager G, et al. Osteopontin expression in human and murine obesity: extensive local up-regulation in adipose tissue but minimal systemic alterations. Endocrinology. 2008;149:1350–1357. doi: 10.1210/en.2007-1312. [DOI] [PubMed] [Google Scholar]
- 28.Vendrell J, Broch M, Vilarrasa N, Molina A, Gómez JM, Gutiérrez C, Simón I, Soler J, Richart C. Resistin, adiponectin, ghrelin, leptin, and proinflammatory cytokines: relationships in obesity. Obes Res. 2004;12:962–971. doi: 10.1038/oby.2004.118. [DOI] [PubMed] [Google Scholar]
- 29.Ye J, Keller JN. Regulation of energy metabolism by inflammation: a feedback response in obesity and calorie restriction. Aging (Albany NY) 2010;2:361–368. doi: 10.18632/aging.100155. [DOI] [PMC free article] [PubMed] [Google Scholar]
- 30.Calder PC, Ahluwalia N, Brouns F, Buetler T, Clement K, Cunningham K, Esposito K, Jönsson LS, Kolb H, Lansink M, et al. Dietary factors and low-grade inflammation in relation to overweight and obesity. Br J Nutr. 2011;106 Suppl 3:S5–78. doi: 10.1017/S0007114511005460. [DOI] [PubMed] [Google Scholar]
- 31.Wortsman J, Matsuoka LY, Chen TC, Lu Z, Holick MF. Decreased bioavailability of vitamin D in obesity. Am J Clin Nutr. 2000;72:690–693. doi: 10.1093/ajcn/72.3.690. [DOI] [PubMed] [Google Scholar]
- 32.Earthman CP, Beckman LM, Masodkar K, Sibley SD. The link between obesity and low circulating 25-hydroxyvitamin D concentrations: considerations and implications. Int J Obes (Lond) 2012;36:387–396. doi: 10.1038/ijo.2011.119. [DOI] [PubMed] [Google Scholar]
- 33.Bellia A, Garcovich C, D’Adamo M, Lombardo M, Tesauro M, Donadel G, Gentileschi P, Lauro D, Federici M, Lauro R, et al. Serum 25-hydroxyvitamin D levels are inversely associated with systemic inflammation in severe obese subjects. Intern Emerg Med. 2013;8:33–40. doi: 10.1007/s11739-011-0559-x. [DOI] [PubMed] [Google Scholar]
- 34.Vilarrasa N, Vendrell J, Maravall J, Elío I, Solano E, San José P, García I, Virgili N, Soler J, Gómez JM. Is plasma 25(OH) D related to adipokines, inflammatory cytokines and insulin resistance in both a healthy and morbidly obese population? Endocrine. 2010;38:235–242. doi: 10.1007/s12020-010-9379-4. [DOI] [PubMed] [Google Scholar]
- 35.Lamendola CA, Ariel D, Feldman D, Reaven GM. Relations between obesity, insulin resistance, and 25-hydroxyvitamin D. Am J Clin Nutr. 2012;95:1055–1059. doi: 10.3945/ajcn.111.032060. [DOI] [PMC free article] [PubMed] [Google Scholar]
- 36.Wardlaw GM. Putting body weight and osteoporosis into perspective. Am J Clin Nutr. 1996;63:433S–436S. doi: 10.1093/ajcn/63.3.433. [DOI] [PubMed] [Google Scholar]
- 37.Harford KA, Reynolds CM, McGillicuddy FC, Roche HM. Fats, inflammation and insulin resistance: insights to the role of macrophage and T-cell accumulation in adipose tissue. Proc Nutr Soc. 2011;70:408–417. doi: 10.1017/S0029665111000565. [DOI] [PubMed] [Google Scholar]
- 38.Sell H, Habich C, Eckel J. Adaptive immunity in obesity and insulin resistance. Nat Rev Endocrinol. 2012;8:709–716. doi: 10.1038/nrendo.2012.114. [DOI] [PubMed] [Google Scholar]
- 39.Gimble JM, Nuttall ME. The relationship between adipose tissue and bone metabolism. Clin Biochem. 2012;45:874–879. doi: 10.1016/j.clinbiochem.2012.03.006. [DOI] [PubMed] [Google Scholar]
- 40.Zhao LJ, Jiang H, Papasian CJ, Maulik D, Drees B, Hamilton J, Deng HW. Correlation of obesity and osteoporosis: effect of fat mass on the determination of osteoporosis. J Bone Miner Res. 2008;23:17–29. doi: 10.1359/JBMR.070813. [DOI] [PMC free article] [PubMed] [Google Scholar]
- 41.Schouten F, Twisk JW, de Boer MR, Stehouwer CD, Serné EH, Smulders YM, Ferreira I. Increases in central fat mass and decreases in peripheral fat mass are associated with accelerated arterial stiffening in healthy adults: the Amsterdam Growth and Health Longitudinal Study. Am J Clin Nutr. 2011;94:40–48. doi: 10.3945/ajcn.111.013532. [DOI] [PubMed] [Google Scholar]
- 42.Barton M. Childhood obesity: a life-long health risk. Acta Pharmacol Sin. 2012;33:189–193. doi: 10.1038/aps.2011.204. [DOI] [PMC free article] [PubMed] [Google Scholar]
- 43.Russell M, Mendes N, Miller KK, Rosen CJ, Lee H, Klibanski A, Misra M. Visceral fat is a negative predictor of bone density measures in obese adolescent girls. J Clin Endocrinol Metab. 2010;95:1247–1255. doi: 10.1210/jc.2009-1475. [DOI] [PMC free article] [PubMed] [Google Scholar]
- 44.Verma N, Arunabh S, Brady TM, Charytan C. Acute interstitial nephritis secondary to infectious mononucleosis. Clin Nephrol. 2002;58:151–154. doi: 10.5414/cnp58151. [DOI] [PubMed] [Google Scholar]
- 45.Blum M, Dolnikowski G, Seyoum E, Harris SS, Booth SL, Peterson J, Saltzman E, Dawson-Hughes B. Vitamin D(3) in fat tissue. Endocrine. 2008;33:90–94. doi: 10.1007/s12020-008-9051-4. [DOI] [PMC free article] [PubMed] [Google Scholar]
- 46.Lee NK, Karsenty G. Reciprocal regulation of bone and energy metabolism. J Musculoskelet Neuronal Interact. 2008;8:351. [PubMed] [Google Scholar]
- 47.Kawai M, de Paula FJ, Rosen CJ. New insights into osteoporosis: the bone-fat connection. J Intern Med. 2012;272:317–329. doi: 10.1111/j.1365-2796.2012.02564.x. [DOI] [PMC free article] [PubMed] [Google Scholar]
- 48.Kadowaki T, Yamauchi T. Adiponectin and adiponectin receptors. Endocr Rev. 2005;26:439–451. doi: 10.1210/er.2005-0005. [DOI] [PubMed] [Google Scholar]
- 49.Steppan CM, Crawford DT, Chidsey-Frink KL, Ke H, Swick AG. Leptin is a potent stimulator of bone growth in ob/ob mice. Regul Pept. 2000;92:73–78. doi: 10.1016/s0167-0115(00)00152-x. [DOI] [PubMed] [Google Scholar]
- 50.Tilg H, Moschen AR. Inflammatory mechanisms in the regulation of insulin resistance. Mol Med. 2008;14:222–231. doi: 10.2119/2007-00119.Tilg. [DOI] [PMC free article] [PubMed] [Google Scholar]
- 51.Abrahamsen B, Bonnevie-Nielsen V, Ebbesen EN, Gram J, Beck-Nielsen H. Cytokines and bone loss in a 5-year longitudinal study--hormone replacement therapy suppresses serum soluble interleukin-6 receptor and increases interleukin-1-receptor antagonist: the Danish Osteoporosis Prevention Study. J Bone Miner Res. 2000;15:1545–1554. doi: 10.1359/jbmr.2000.15.8.1545. [DOI] [PubMed] [Google Scholar]
- 52.Ganesan K, Teklehaimanot S, Tran TH, Asuncion M, Norris K. Relationship of C-reactive protein and bone mineral density in community-dwelling elderly females. J Natl Med Assoc. 2005;97:329–333. [PMC free article] [PubMed] [Google Scholar]
- 53.Khosla S, Peterson JM, Egan K, Jones JD, Riggs BL. Circulating cytokine levels in osteoporotic and normal women. J Clin Endocrinol Metab. 1994;79:707–711. doi: 10.1210/jcem.79.3.8077350. [DOI] [PubMed] [Google Scholar]
- 54.Kim BJ, Yu YM, Kim EN, Chung YE, Koh JM, Kim GS. Relationship between serum hsCRP concentration and biochemical bone turnover markers in healthy pre- and postmenopausal women. Clin Endocrinol (Oxf) 2007;67:152–158. doi: 10.1111/j.1365-2265.2007.02853.x. [DOI] [PubMed] [Google Scholar]
- 55.Gallagher TC, Geling O, Comite F. Use of multiple providers for regular care and women’s receipt of hormone replacement therapy counseling. Med Care. 2001;39:1086–1096. doi: 10.1097/00005650-200110000-00006. [DOI] [PubMed] [Google Scholar]
- 56.Scheidt-Nave C, Bismar H, Leidig-Bruckner G, Woitge H, Seibel MJ, Ziegler R, Pfeilschifter J. Serum interleukin 6 is a major predictor of bone loss in women specific to the first decade past menopause. J Clin Endocrinol Metab. 2001;86:2032–2042. doi: 10.1210/jcem.86.5.7445. [DOI] [PubMed] [Google Scholar]
- 57.Yakar S, Rosen CJ, Beamer WG, Ackert-Bicknell CL, Wu Y, Liu JL, Ooi GT, Setser J, Frystyk J, Boisclair YR, et al. Circulating levels of IGF-1 directly regulate bone growth and density. J Clin Invest. 2002;110:771–781. doi: 10.1172/JCI15463. [DOI] [PMC free article] [PubMed] [Google Scholar]