

INTRODUCTION
Several methods have become available in the last few years for monitoring specific cellular immune responses in HIV-infected individuals. The enzyme-linked immunospot (ELISPOT) assay is considered by many to be a gold standard for immune monitoring. The ELISPOT assay can detect virus-specific T cells secreting cytokine at a single cell level (Czerkinsky et al., 1988; Lalvani et al., 1997; Larsson et al., 1999; Currier et al., 2002b). This assay is highly sensitive, quantitative, easy to use and amenable to high throughput (Hernandez-Fuentes et al., 2003).
Typically associated with Th1 immune responses, IFN-γ is the cytokine most frequently used to detect the antigen-specificity of Th1 T cells partly because other cytokines secreted by Th1 cells such as IL-2 are produced by a much lower percentage of specific T cells (Letsch and Scheibenbogen, 2003). In addition, IFN-γ secretion by T cells is linked to their cytotoxic capacity (Horton et al., 2004). Comprehensive screening strategies based on ELISPOT assays detecting IFN-γ secretion have been used extensively to evaluate the breadth, magnitude and specificity of HIV-specific responses in several cohorts of HIV infected individuals (Currier et al., 2002a; Cao et al., 2003; Addo et al., 2003; Feeney et al., 2003; Kaufmann et al., 2004; Peretz et al., 2005; Frahm et al., 2004).
However, studies aimed at correlating the breadth and magnitude of HIV-specific IFN-γ secretion with viral load control or rate or CD4 decline have frequently failed to detect such an association (Addo et al., 2003; Peretz et al., 2005; Frahm et al., 2004). One possible reason is that IFN-γ secretion per se may not be the function of CD8+ T cells that mediates viral control. Another possibility is that some HIV-specific responses are able to control viral replication but represent a subset of all the responses detectable by comprehensive IFN-γ ELISPOT screening, such that their effect on viral control is diluted out (Klenerman et al., 2002). Several studies suggest that in HIV-infected individuals the presence of polyfunctional HIV-specific cells able to proliferate and secrete IL-2 in addition to IFN-γ is associated with more effective control of viremia (Migueles et al., 2002; Younes et al., 2003; Harari et al., 2005; Lichterfeld et al., 2004). In chronic viral infections characterized by high viral load such as HIV in humans and clone 13 lymphocytic choriomeningitis virus in mice, antigen specific IL-2 secretion is one of the first cytokine secretion functions of memory T cells lost whereas IFN-γ secretion is resistant to functional exhaustion (Wherry et al., 2003; Wherry and Ahmed, 2004; Harari et al., 2006). Therefore, a dual cytokine ELISPOT assay able to capture information IFN-γ and IL-2 secretion has potential relevance for studies on immune responsiveness in the context of viral infections such as HIV where disease outcome is associated with the antigen specific IFN-γ/IL-2 secretion profile.
In order to capture information on both IL-2 and IFN-γ secretion by HIV-specific cells simultaneously and to obtain a more complete picture of the HIV-specific immune response in HIV infection we designed a dual color ELISPOT assay. This assay can be used to screen all expressed HIV genes using a peptide pool matrix array. An advantage to using a dual color assay for detecting polyfunctional cellular responses is the requirement for half the number of cells to measure both cytokines together than would be needed to detect either cytokine alone, a factor that is not negligible in human studies where blood volume restriction often limits cell availability. In addition this assay allows a better description of the immune response through the detection at once of three immunologically distinct T cell populations: IL-2 and IFN-γ single secretors and dual cytokine secretors. We propose that comprehensive screening with a dual color ELISPOT could be used as an initial screening tool for HIV-specific immune responses to identify specificities that could be characterized more fully phenotypically and functionally by multiparametic flow cytometry.
MATERIAL AND METHODS
Study Population
Peripheral blood mononuclear cells (PBMC) were obtained by leukapheresis as previously reported (Boulassel et al., 2003). A total of six HIV individuals were enrolled including two long-term nonprogressors (LTNP; LTNP 004 and LTNP 009), two elite viral load (VL) controllers (NB 001 and LTNP HTM 001) and two HIV-infected subjects undergoing HIV primary infection (PI; HDM 011 and HTM 375). All subjects studied were naïve to antiretroviral therapy (ART) at the time of testing. LTNP were infected for at least 7 years and their CD4 count/μl blood was above 500. Elite controllers had undetectable viremia (<50 copies/ml). PI subjects were tested at time points 53 and 134 days from infection respectively. Date of infection was estimated using criteria agreed upon by the Acute HIV Infection Early Disease Research Program sponsored by the National Institutes of Health (Martro et al., 2005). The research was approved by the research ethics board of all participating institutions and all study subjects provided signed informed consent.
Cell Preparation
PBMCs were isolated by density gradient centrifugation (Ficoll-Paque; Pharmacia, Uppsala, Sweden) and cryopreserved in 10% dimethyl sulfoxide (DMSO; Sigma-Aldrich, St Louis, Mo.); 90% fetal bovine serum (FBS; Medicorp, Montreal, Quebec, Canada). For the experiments presented here frozen cells were thawed and rested overnight at 37°C in a 5% CO2 incubator before resuspending in R10 medium consisting of RPMI 1640 (Gibco Invitrogen Corporation Burlington, Ontario, Canada); 10% fetal bovine serum (FBS, Medicorp); 2 mM L-glutamine (ICN Biomedicals, Costa Mesa, CA); 50 IU of penicillin/ml, and 50μg/ml of streptomycin (ICN Biomedicals); 20mM HEPES (Sigma-Aldrich). Cell recovery after resting was greater than 50% and cell viability after resting exceeded 85%.
Peptides
The peptides used were from the NIH AIDS Research and Reference Reagent Program (NARRRP, Rockville, MD). In this report the peptides used are designated according to the catalog number assigned to them by the NARRRP. All except 1 were consensus clade B HIV-specific 15mer peptides; 1 was a 20-mer pol peptide corresponding to HIV HXB2 sequence. Peptides used at a final concentration of 4 μg/ml. Stimulatory peptides were identified by screening PBMC with peptide pool matrices corresponding to all expressed HIV genes and verifying candidate responses individually in a second ELISPOT experiment.
Single and dual color ELISPOT assay for detection of IFN-γ and IL-2 secreting cells
Ninety-six-well polyvinylidene difluoride-backed microtiter plates (MSIP, Millipore, Bedford, MA) were treated with 100μl of 90% methanol (American Chemicals LTD, Montreal, Quebec, Canada) for 45 seconds and washed 5 times with sterile phosphate buffer saline (PBS, Hyclone, Logan, Utah). Plates were coated with 100μl of capture antibodies (Abs) in PBS at the concentrations specified below for each Ab and incubated overnight at 4°C. The optimal Ab concentration for single and dual color assays was established by titration experiments. In dual color assays both capture antibodies were added simultaneously. In order to set parameters for reading red, blue and dual color spots in dual color assays, some positive control wells were coated with anti-human IFN-γ or anti-human IL-2 capture monoclonal antibody (mAb) alone or with both capture mAbs together. Plates were blocked with 100 μl/well of 1% bovine serum albumin (BSA, Sigma-Aldrich) in PBS for 1 hr and then washed 6x with PBS. PBMC were plated in R10 at 2 × 10⁵ cells/well (unless otherwise specified) in a final volume of 100 μl/well. Peptides were added at a final concentration of 4 μg/ml. For the positive control wells anti-CD3 mAb (Clone CLB-T3/4.E; Research Diagnostics, Flanders, NJ) was added at a final concentration of 0.3 μg/ml. Wells treated with anti-CD3 mAb were consistently positive. Negative controls included 6 wells containing unstimulated PBMC. Plates were cultured in an incubator at 37°C in a 5% CO2 humidified atmosphere for 28 hrs, an incubation time determined to be optimal for single and dual cytokine secretion using the conditions described in this report. Plates were washed 3x with PBS and 3x with PBS; 0.05% Tween-20 (PBST; Bio-Rad Laboratories, Hercules, CA) to remove cells. The detection Abs were added at 100 μl/well in PBST; 1% BSA (Sigma-Aldrich) at the concentrations specified below optimized in titration experiments overnight at 4°C. For dual color assays the antibodies were added simultaneously at the same concentration as for single color ELISPOT assays. After washing 6x with PBST, plates were incubated for 2 hrs at RT with 100μl/well of a mixture of enzymatic conjugates described below. To develop spots, plates were washed 4x with PBST 3x with PBS and one time with H2O. Vector Blue substrate solution (Vector Laboratories, Burlingame, CA) was added to each well first at 100 μl/well for 5 min. The plates were then washed 4x with PBS before adding 100μl/well of amino ethyl carbazole (AEC, Sigma-Aldrich) substrate at 0.33 mg/ml prepared fresh. Briefly, a 10 mg/ml solution of AEC dissolved in N,N,-Dimethyl Formamide (DMF; Fisher Scientific Limited, Ontario, Canada) was diluted 1:30 in 0.03M acetic acid (American Chemicals); 0.07M sodium acetate (Fisher Scientific Limited); 0.015% hydrogen peroxide (Sigma-Aldrich). The filtered AEC solution (100 μl/well) was added to the wells for 10 minutes before rinsing with water and air-drying. Digitized images were analyzed for red, blue and double-colored spots using the CTL ImmunoSpot reader (Cellular Technology Limited, Cleveland, OH) with version 3.2 of software supplied by the manufacturer. Sensitivity and compensation thresholds were established using at least two positive control wells (stimulated with CEF or α-CD3); one coated with single IL-2 capture antibody (red color spots) and the other with IFN-γ capture antibody (blue color spots). Sensitivity was first set for each color separately such that the threshold selected could detect a maximal amount of spots. Detection of blue colored-spots in IFN-γ only and of red colored-spots in IL-2 only coated wells was then compensated out using the software’s imbedded algorithms. A dual spot was determined as the intersection of two single color thresholds. Counts obtained from the software were then audited well by well. Results are expressed as spot forming cell per million PBMC (SFC/106 PBMC). For this report, results are presented as total IL-2 and IFN-γ total secreting PBMCs (i.e. total IL-2 secretors = single IL-2 secretors + dual secretors) to reflect results that would be obtained in a conventional single colored ELISPOT assay. Values for single cytokine secretion are obtained by subtracting the magnitude of dual secretors from total IL-2 or IFN-γ secretors.
Coating Abs were: IL-2 capture Ab from BD ELISPOT Reagent Pairs for human IL-2 (Becton Dickinson [BD] Pharmingen, San Diego, CA) at 3 μg/ml; IFN-γ mAb, (clone NIB42; BD Pharmingen) at 3 μg/ml. Detection Abs were IL-2-biotin-conjugated detection Ab from BD ELISPOT Reagent Pairs for human IL-2 (BD Pharmingen) at 0.5μg/ml and FITC-conjugated anti-IFN-γ mAb (1-D1K, Mabtech, Nacka Strand, Sweden.) at 0.5μg/ml. Enzymatic conjugates were: horseradish peroxidase conjugated anti-FITC mAb (Jackson ImmunoResearch Laboratories, Ltd, West Grove PA) at 0.5μg/ml and streptavidin alkaline phosphatase (Jackson ImmunoResearch Laboratories, Ltd.) at 0.5μg/ml.
To establish the threshold of detection of positive responses in the single and dual color assays, PBMCs from 8 HIV seronegative individuals were subjected to stimulation with a peptide pool matrices corresponding to HIV consensus clade B sequence for all expressed HIV genes. With a cell/well input of 2 × 10⁵, the average number of SFC/106 PBMCs from these control subjects generated in response to HIV peptide stimuli was 11.5 ± 16.99 for IFN-γ, 21.89 ± 20.11 for IL-2 and 4.73 ± 10.71 for dual secreting cells. The cutoff for a positive response was set at 3 standard deviations (SD) above the average of the response in control individuals: 62 SFC/106 PBMC for IFN-γ, 82 SFC/106 PBMC for IL-2 and 37 SFC/106 PBMC for dual secreting cells. In addition, a positive response had to be over 3-fold the number of SFC/106 PBMC in unstimulated autologous control wells.
CD4 and CD8 cell depletion
PBMC were depleted of CD4 or CD8 T cell populations using immunomagnetic beads (Stem Cell Technologies Inc, Vancouver BC, Canada.) according to the manufacturer’s recommendations. At least 98.5% of the CD4 or CD8 T cells were depleted by anti-CD4 or anti-CD8 immunomagnetic beads as determined by flow cytometry. The depleted cells were used to determine the phenotype of the cell population responsible for each cytokine secretion pattern induced by a peptide stimulus.
Statistical analysis
Statistical analysis and graphical presentation were performed using GraphPad InStat 3.05 and GraphPad Prism 4.01. Two-tailed Wilcoxon matched pairs test was used to compare differences in SFC/106 PBMC magnitudes for each cytokine secretion pattern induced to peptide stimuli generated by 2 different cells input numbers per well as well as to assess differences in SFC/106 PBMC magnitude in experiments comparing single versus dual antibody coating. A Friedman test was used to compare SFC/106 PBMC magnitudes generated by three or more cell input numbers per well. A Wilcoxon paired test was used to compare the magnitude of SFC/106 PBMC generated in wells coated with a single anti-Il-2 or IFN-γ capture Ab versus both together. p-values of less than 0.05 was considered significant.
RESULTS
To determine the cell input number for the dual color ELISPOT format that would minimize the number of cells required while maximizing the responses detected for all three cytokine secretion patterns (IL-2, IFN-γ, dual), PBMCs from 4 subjects (HDM 011, HTM 375, LTNP 009 and NB 001) were plated at cell input numbers ranging from 0 to 8.0 × 10⁵ cells/well and stimulated with HIV peptides containing epitopes previously identified as stimulatory in single-color IFN-γ and IL-2 and dual cytokine ELISPOT assays. Figure 1 shows an example of a cell input titration for subject NB 001 stimulated with 2 peptides and a negative control stimulus. Table 1 shows responses normalized to SFC/106 PBMC for all stimuli and cell combinations at cell/well input numbers of 1.5 × 10⁵, 2 × 10⁵ and 3 × 10⁵. As shown in Figure 1 for all cytokine secretion patterns, the responses (normalized to SFC/106 PBMC) increased linearly with the cell input until an upper limit was achieved. Beyond this upper cell input limit peptide specific responses either decreased or stabilized. Although IFN-γ responses were detected at cell input numbers as low as 0.25 × 10⁵ cells/well, IL-2 and dual color responses generally required higher cell input numbers to consistently produce spot numbers meeting the criteria for a positive response because IL-2 responses are usually of a lower frequency than IFN-γ responses (Fig 1 and Table 1).
Figure 1.
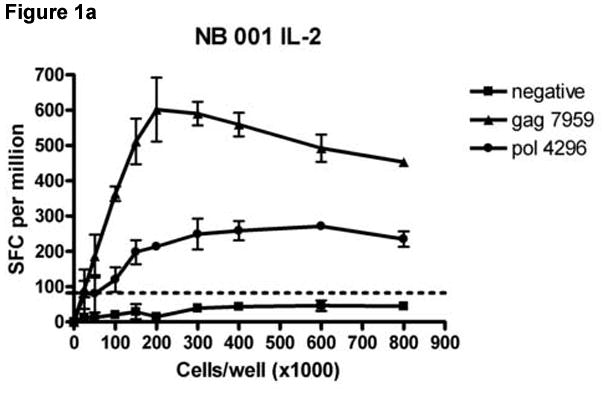
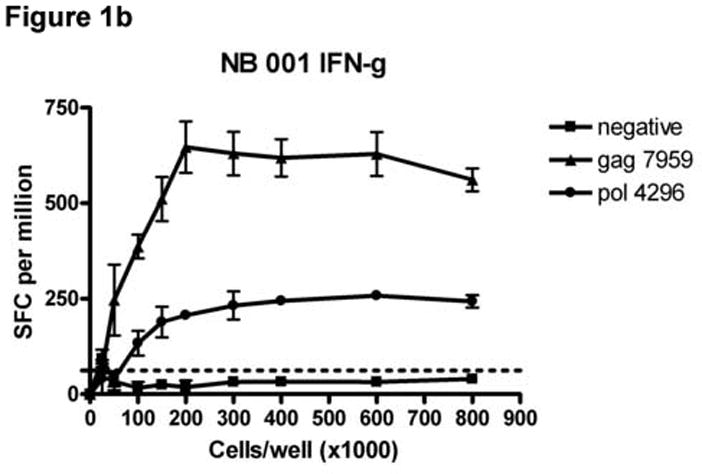
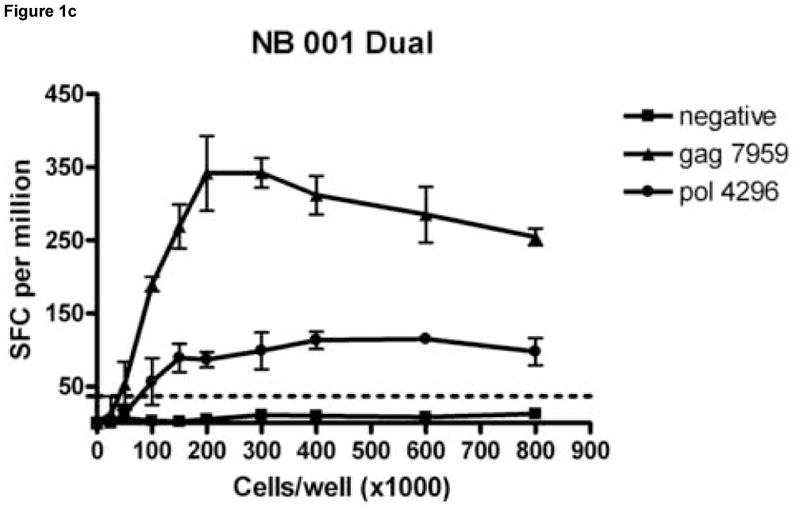
Titration of cell numbers per well. Dilutions of cryopreserved peripheral blood mononuclear cells (PBMC) ranging from 0 – 8 × 10⁵ cells/well were obtained from HIV-infected donor NB 001 and stimulated in triplicate with 2 peptides containing a major histocompatibility complex class I restricted HIV epitope identified in previous experiments. The mean total of IL-2 (Panel A), IFN-γ (Panel B) and PBMC secreting both cytokines (Panel C) spot forming cells per million PBMC are graphed for each cell concentration. Error bars represent standard deviation of the mean. Dotted lines represent cutoff values for a positive response for each cytokine as described in the Methods section.
Table 1. Effect of cell per well input on SFC/106 PBMC.
Cryopreserved peripheral blood mononuclear cells (PBMC) obtained from 4 HIV-infected donors were stimulated in triplicate with 2 peptides each containing a major histocompatibility complex class I restricted HIV epitope identified in previous experiments.
| Cytokine measured | Patient ID | Peptides testeda | Cell input (x10)
|
||
|---|---|---|---|---|---|
| 1.5 | 2.0 | 3.0 | |||
|
| |||||
| IL-2 | HDM 011 | Nef 5164 | 797.8 ± 76.9 b | 933.3 ± 64.1 | 930.0 ± 58.4 |
| Env 8957 | 551.1 ± 184.9 | 562.2 ± 7.63 | 506.7 ± 43.6 | ||
| HTM 375 | Pol 5543 | 111.1 ± 30.8 | 161.7 ± 39.7 | 245.6 ± 28.5 | |
| Nef 5186 | 228.9 ± 37.1 | 242.0 ± 32.8 | 314.4 ± 6.9 | ||
| LTNP 009 | Pol 5623 | 288.9 ± 36.7 | 346.7 ± 57.5 | 340 ± 28.0 | |
| Vif 6022 | 73.3 ± 11.5 | 133.3 ± 16.1 | 103.3 ± 33.6 | ||
| NB 001 | Gag 7959 | 482.2 ± 64.8 | 586.7 ± 90.2 | 551.1 ± 33.3 | |
| Pol 4296 | 168.9 ± 34.2 | 198.3 ± 2.9 | 210.0 ± 43.4 | ||
|
| |||||
| IFN-γ | HDM 011 | Nef 5164 | 1735.6 ± 83.4 | 1825.2 ± 94.9 | 1628.9 ± 62.0 |
| Env 8957 | 1375.6 ± 524.5 | 1420.9 ± 65.1 | 1063.3 ± 34.0 | ||
| HTM 375 | Pol 5543 | 364.4 ± 63.6 | 455.0 ± 28.9 | 584.4 ± 18.6 | |
| Nef 5186 | 937.8 ± 54.6 | 863.9 ± 71.5 | 966.7 ± 38.3 | ||
| LTNP 009 | Pol 5623 | 591.1 ± 65.7 | 750 ± 70.1 | 728.9 ± 24.0 | |
| Vif 6022 | 177.8 ± 40.0 | 281.7 ± 10.0 | 246.7 ± 16.8 | ||
| NB 001 | Gag 7959 | 486.7 ± 57.5 | 628.3 ± 67.1 | 597.8 ± 57.0 | |
| Pol 4296 | 164.4 ± 40.2 | 188.3 ± 2.9 | 200.0 ± 36.9 | ||
|
| |||||
| Dual | HDM 011 | Nef 5164 | 624.4 ± 76.7 | 779.3 ± 43.8 | 828.9 ± 45.1 |
| Env 8957 | 428.9 ± 165.6 | 457.4 ± 22.5 | 425.6 ± 40.6 | ||
| HTM 375 | Pol 5543 | 73.3 ± 13.3 | 103.3 ± 26.5 | 161.1 ± 22.2 | |
| Nef 5186 | 171.1 ± 33.6 | 173.1 ± 21.0 | 234.4 ± 1.9 | ||
| LTNP 009 | Pol 5623 | 128.9 ± 10.2 | 200.0 ± 27.5 | 183.3 ± 20.1 | |
| Vif 6022 | 40.0 ± 13.3 | 85.0 ± 20.2 | 65.6 ± 23.3 | ||
| NB 001 | Gag 7959 | 266.7 ± 30.1 | 336.7 ± 51.3 | 331.1 ± 20.4 | |
| Pol 4296 | 86.7 ± 19.2 | 81.6 ± 10.4 | 87.7 ± 25.0 | ||
Input number of cells per well.
Mean ± standard deviation of spot forming cells generated in response to each stimulus normalized to spot forming cells per million PBMC (SFC/106 PBMC).
Stimulatory peptides. Codes refer to catalog numbers assigned to individual peptides available from the National Institutes of Health AIDS Research and Reference Reagent Program.
To identify the optimal cell input number for the dual color ELISPOT assay we compared all observations (4 subjects tested with 2 peptides each for 3 cytokine secretion patterns) for cell input numbers normalized to SFC/106 PBMC. Response magnitudes were similar for cell input numbers of 2 × 10⁵, 3 × 10⁵, and 4 × 10⁵ (Friedman test, p = n.s.). All other cell input numbers per well produced lower SFC/106 PBMC values compared to those generated from those between 2 and 4 × 10⁵ cells per well (Wilcoxon matched pairs test, p < 0.05 for all comparisons). This phenomenon could be due to limitations in antigen presenting cells at low cell input numbers or to crowding at cell input numbers greater than 4 × 10⁵ per well. Partial cell input titration data is presented in Table 1 where SFC/106 PBMC obtained for the optimal cell input of 2 × 10⁵ is shown along with those obtained for the closest lower and higher cell input number tested: i.e. 1.5 × 10⁵, which generated SFC/106 PBMC values significantly lower than that those from wells with 2 × 10⁵ cells and 3 × 10⁵, which produced SFC/106 PBMC not significantly different than those from wells with 2 × 10⁵ cells. In summary a cell input of 2 × 10⁵ cells per well provided a balance between minimizing the number of cells needed to perform the assay and the plateau effect often seen when higher cell input numbers are used with the number of cells needed to detect lower frequency IL-2 and dual color SFC in a dual color format.
Figure 2 shows an example of results obtained using the dual color ELISPOT assay in which PBMC from LTNP 004 were stimulated with the stimulatory peptide pol 5565. Conditions used to develop all wells were identical except that the well in panel A was coated with anti- IL-2 coating Ab alone, the well in panel B was coated with anti-IFN-γ coating Ab alone and the well in panel C was coated with both coating antibodies together. IL-2 secreting cells generate blue, IFN-γ secreting cells generate red and dual cytokine secreting cells generate purple spots.
Figure 2.
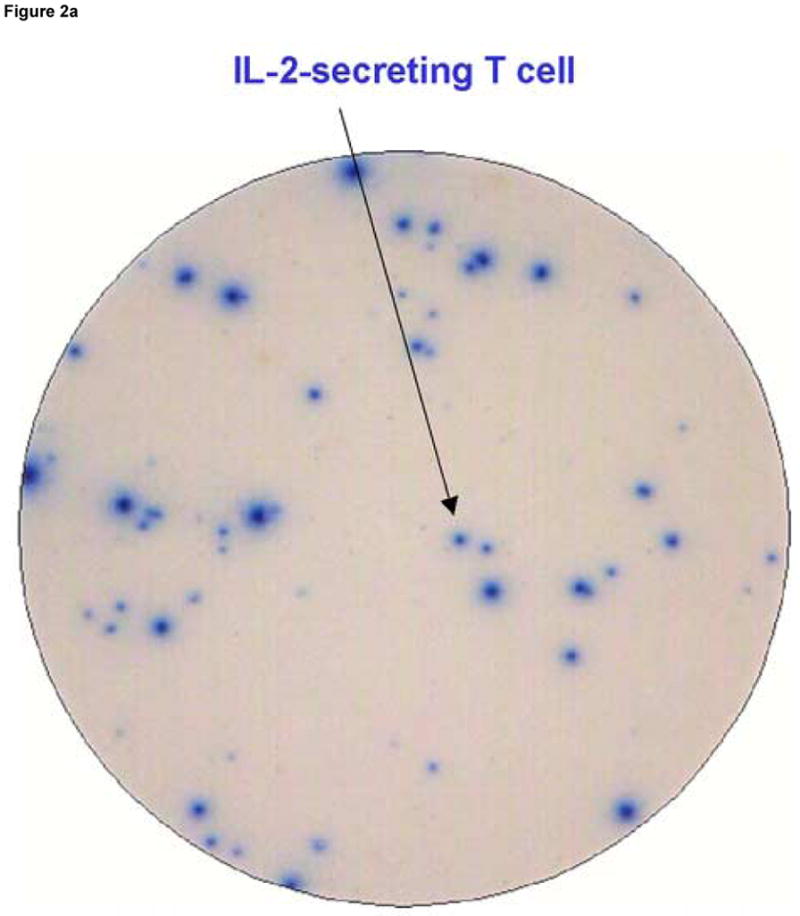
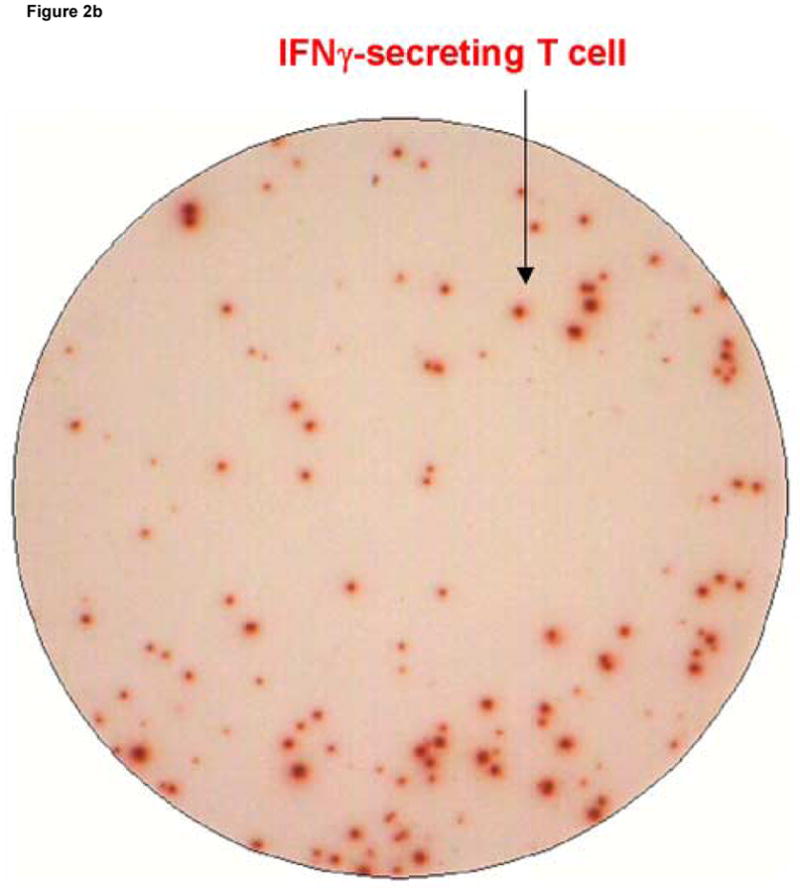
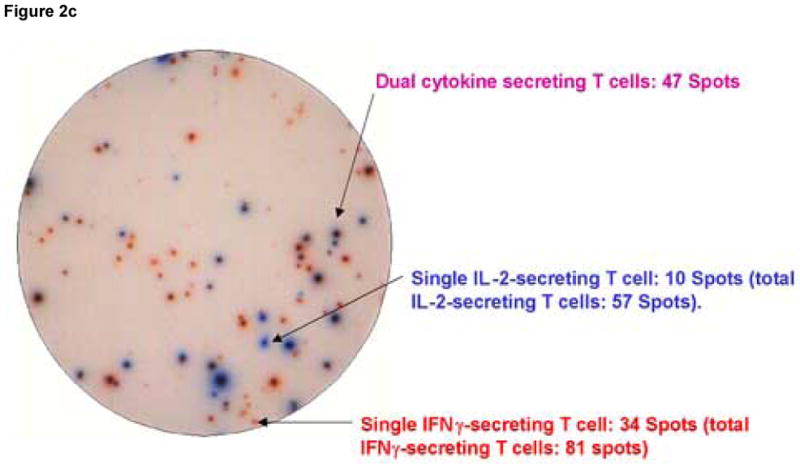
Spot morphology of spot forming cells (SFC) developed under conditions detecting cells secreting only IL-2 (Panel A), only IFN-γ (Panel B) and both cytokines (Panel C). Peripheral blood mononuclear cells, obtained from an HIV infected donor (LTNP 004), were stimulated as described in the Methods section with pol 5565, a 15-mer peptide containing a major histocompatibility complex class I restricted epitope identified in previous experiments as stimulatory. Arrows point to red (IFN-γ), blue (IL-2) and purple (IL-2 and IFN-γ) spots distinguished by the ELISPOT reader instrument.
To examine whether the simultaneous detection of IFN-γ and IL-2 affected the number of SFCs detected compared with ELISPOT assays detecting either of these cytokines alone, the response of LTNP 004 to three HIV stimulatory peptides (gag 7937, pol 5565 and vpr 6071) as well as no stimulus as a negative control and a positive stimulus (α-CD3) were measured in replicates of 6 in wells coated with IFN-γ capture Ab only, IL-2 capture Ab only or both. As shown in Figure 3A, coating with both capture Abs did not affect the magnitude of IL-2 responses. The median and range of SFC/106 PBMC representing IL-2 secreting cells generated in wells coated with both capture Abs versus anti-IL-2 Ab only was 510.8 (100.8 to 885.8) and 496.7 (146.7 to 1006.7), respectively (p= n.s., Wilcoxon matched pairs test). However, the presence of both capture Abs reduced the magnitude of IFN-γ responses (Fig. 3B) detected compared to wells coated with anti-IFN-γ alone. The median and range of SFC/106 PBMC representing IFN-γ secreting cells generated in wells coated with both capture Abs versus anti-IFN-γ capture Ab alone was 2613.3 (358.3 to 3168.3) and 1940 (310 to 2530), respectively (p=0.0007, Wilcoxon matched pairs test). On average, the IFN-γ peptide response decreased by 21.7% in wells coated with both capture antibodies compared with anti-IFN-γ capture Abs only. Specifically the gag 7937 IFN-γ response decreased by an average ± SD of 25.6% ± 20.0%, pol 5565 by 16.2% ± 22.1% and vpr 6071 by 23.4% ± 8.4%. Despite this decrease, all responses remained above cutoff for positive response and were detectable, including the response to pol 5565, which is of lower magnitude than the other two. This experiment was repeated on 2 other occasions and the overall average IFN-γ decrease for all peptides in dual coated wells for all three experiments was 16.3% ± 8.5%.
Figure 3.
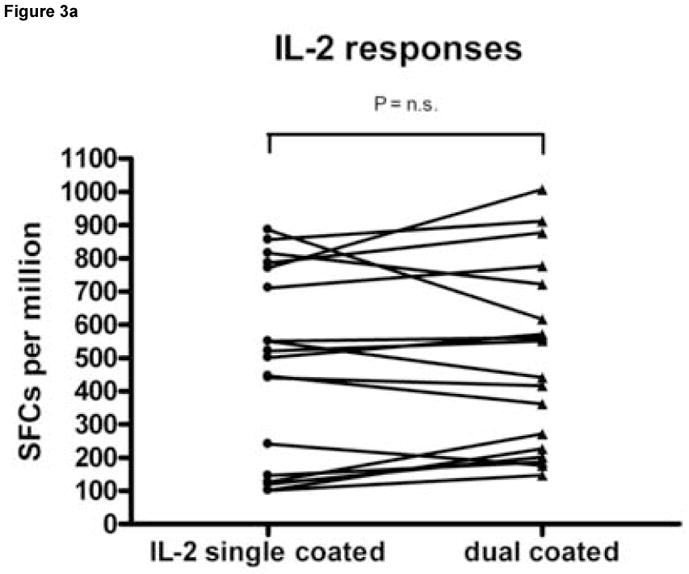
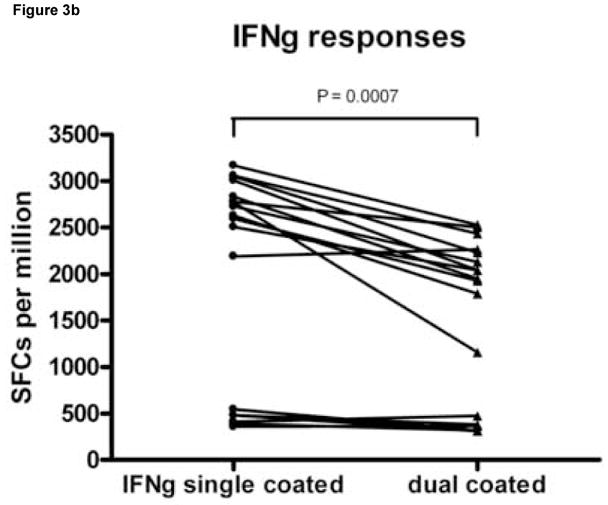
Wells coated with capture antibodies for both IFN-γ and IL-2 produce lower numbers of IFN-γ spot forming cells (SFC) than wells coated with capture antibody for IFN-γ only under similar ELISPOT conditions. Peripheral blood mononuclear cells (PBMC) from an HIV infected donor (LTNP 004), were stimulated in replicates of 6 with peptides gag 7937, pol 5565 and vpr 6071 identified in previous experiments as stimulatory. PBMC (2 × 10⁵ cells per well) were plated into wells coated anti-IL-2 capture antibody (Ab) alone, anti-IFN-γ capture Ab alone or both capture Abs together. Panel A shows the number of SFC per million PBMC (SFC/106 PBMC) generated to each stimulus in wells coated with anti-IL-2 alone (filled circles) versus both coating Abs (filled triangles); Panel B shows the number of SFC per million PBMC (SFC/106 PBMC) generated to each stimulus in wells coated with anti-IFN-γ (filled circles) alone versus both coating Abs (filled triangles). Dots on the scatter plot represent a peptide-specific response after subtraction of background. The significance of differences in the magnitude of responses was tested using a paired t test. n.s.= not significant..
Reproducibility of the assay was assessed by calculating the coefficient of variation (CV) within and between assays, for each cytokine, in wells coated with both capture antibodies (Fig. 4). The average intra-assay CV calculated on 6 replicates per assay was 16.4% for IL-2, 10.8% for IFN-γ responses and 17% for dual cytokines secretion. The between-assay CV calculated using the same frozen cell samples tested on three separate occasions were 13.9%, 11.1%, and 12.8% for IL-2, IFN-γ and dual cytokine secretion respectively. Figure 4 also demonstrates that lower magnitude responses to pol 5565 are reproducible and remain consistently detectable in the dual color assay.
Figure 4.
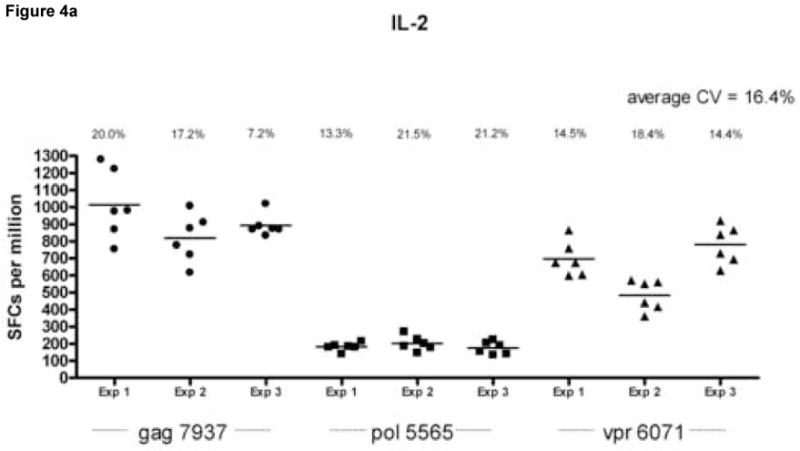
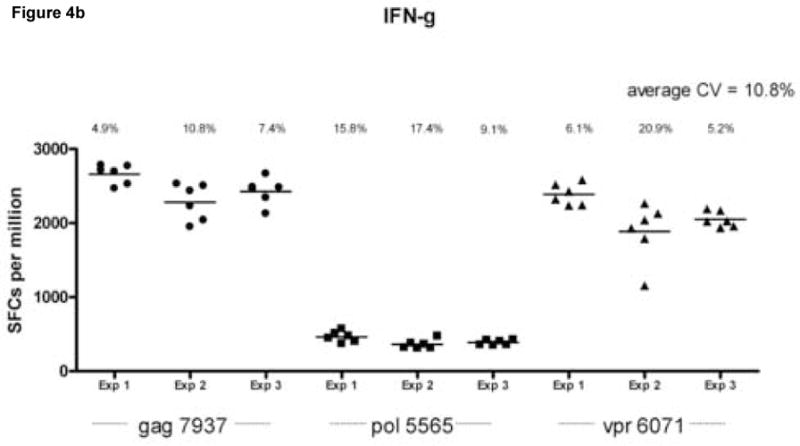
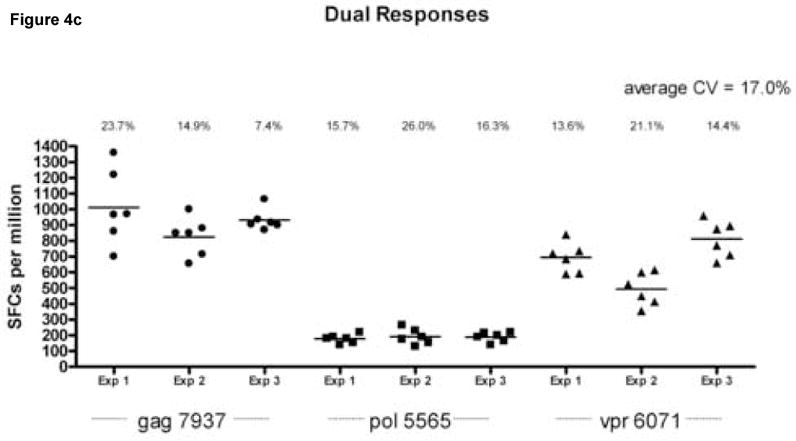
Assessment of intra- and inter-assay variability. Peripheral blood mononuclear cells (PBMC) from an HIV infected donor (LTNP 004) were stimulated in replicates of 6 with peptides gag 7937 (filled circles), pol 5565 (filled squares) and vpr 6071 (filled triangles) identified in previous experiments as stimulatory. Experiments were done on the same cell samples on 3 separate occasions. The cell per well input for these experiments was 2 × 10⁵ cells per well. Data is shown for IL-2 spot forming cells per million PBMC (SFC/106 PBMC obtained from wells coated with anti-IL-2 capture antibody (Ab) only (Panel A), IFN-γ SFC/106 PBMC from wells coated with anti-IFN-γ capture only (Panel B) and dual cytokine IL-2/IFN-γ SFC/106 PBMC from wells coated with anti-IL-2 and anti IFN-γ capture Abs together (Panel C) after subtraction of background. The calculated coefficient of variation (CV) for each experiment (Exp 1, Exp 2 and Exp 3) is represented above each data set. The average CV for all experiments is found at the top right corner of each panel.
To determine whether CD4+ and CD8+ T cells mediated differential cytokine secretion patterns, PBMC from 3 subjects, with 11 known HIV peptide specific responses were depleted of CD4+ or CD8+ T cell before peptide stimulation (Fig. 5). In all but one instance, CD8+ T cell depletion resulted in a greater than 90% decrease in the response magnitude whereas the response was largely maintained when CD4+ T cells were depleted. Therefore, CD8+ T cells mediated most of the IFN-γ, IL-2 and dual cytokine responses detected. However, one IL-2 response was reduced by 44.3% when the CD8+ T cells were depleted and by 13.6% when CD4+ T cells were depleted. Therefore this assay has the potential to detect cytokine secretion by both CD8+ and CD4+ T cells.
Figure 5.
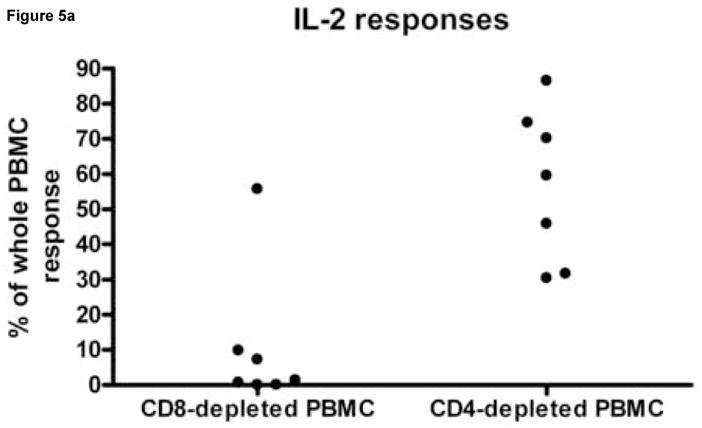
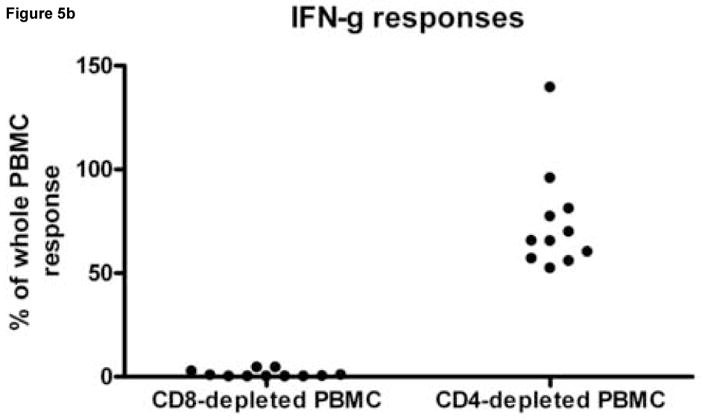
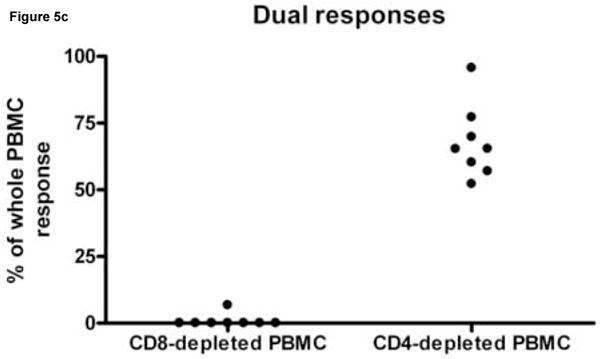
The effect of CD8+ and CD4+ T cell depletion IL-2, IFN-γ and dual cytokine spot forming cell numbers. Peripheral blood mononuclear cells (PBMC) from HIV infected donors HDM 011, LTNP 009 and LTNP HTM 001 were stimulated in replicates of 3 with 4, 5 and 2 HIV peptides, respectively, previously identified as stimulatory. Panel A shows for IL-2 responses, Panel B for IFN-γ responses and Panel C for dual cytokine IL-2/IFN-γ responses the percentage of response remaining after depleting PBMC of CD4+ and CD8+ cells compared to that observed following a sham depletion of the same PBMC population. Each dot on the scatter plot represents the average peptide-specific response of triplicates after subtraction of background. Note that not all peptides induced a response in all secretion patterns.
DISCUSSION
In this study, a dual color ELISPOT assay capable of detecting both IL-2 and IFN-γ secreting cells simultaneously in response to HIV antigens was developed. Our results show that the dual color ELISPOT assay is sensitive, reproducible and capable of detecting both CD4+ and CD8+ T cell responses. We have demonstrated that all functional responses to HIV can be detected at an optimal input of 200 000 cells/well. Because IL-2 secreting cells are less frequent than IFN-γ secreting cells, they seem to be the limiting factor for the lower end of the cell input number. Nevertheless, with an input of 200 000 cells/well in comprehensive screening for HIV-specific responses to all expressed HIV genes using a peptide pool matrix approach (Addo et al., 2003; Peretz et al., 2005), between 20–25 million PBMCs would be needed for the initial screen. In addition, the within- and between-assay variations were both within range reported by others for single color ELISPOT assay (Kumar et al., 2001; Mwau et al., 2002b). Moreover, depletion experiments demonstrated that although the majority of responses detected were CD8+ T cell dependent, we were also able to detect a response by CD4+ T cell secreting IL-2 alone.
Chronic infections such as HIV and HCV where the virus persists at high levels are characterized by defective virus specific responses. HIV infected individuals who spontaneously control their infection and maintain low VLs such as LTNPs, are more likely to maintain a CD4 IL-2 response (Harari et al., 2004) and a CD8 dual IFN-γ and IL-2 response (Zimmerli et al., 2005) than HIV disease progressors. In contrast, the typical response in HIV disease progressors by both T cell compartments is HIV-specific IFN-γ secretion only. Betts et al. extended these studies by measuring additional functions such as secretion of MIP-1β, CD107a as a marker for lytic activity and TNF-α. They demonstrated that T cell responses to HIV can be polyfunctional and that LTNPs are more likely to have polyfunctional responses than subjects exhibiting HIV disease progression(Betts et al., 2006). Although the IFN-γ ELISPOT has been considered the gold standard for many years for measuring antigen specific responses in several disease settings, measurement of IL-2 secretion in addition to IFN-γ detects the subpopulation likely to maintain the greatest functionality in the setting of HIV infection. Furthermore, the high throughput qualities of the ELISPOT assay make it a good choice for screening PBMC for repertoire specificity, magnitude, breadth and how these parameters change with time or following interventions.
Other groups have designed multiple-color ELISPOT (Okamoto et al., 1998; Karulin et al., 2000) or FLUOROSPOT assays (Gazagne et al., 2003). The assay developed by Gazagne et al. is dependent on fluorescent antibodies and results are viewed on an instrument equipped with fluorescent reading capability. Although having advantages, this system requires access to specialized instrumentation able to detect different fluorescent signals simultaneously and fluorescent Ab reagents are not presently commercially available. A colorimetric system could be more flexible and adaptable to different laboratory settings. Although, Okamoto et al. and Karulin et al. also reported the development of a dual cytokine ELISPOT assay they focused on its application for evaluation of Th1/Th2 cytokine balance. We optimized the assay for use in infectious disease studies, providing information on cell input requirement, intra- and inter- assay variability, and the effect of CD4/CD8 depletion. In addition, the developed assay by Okamoto et al. was for dual IL-2 and IL-4 detection, but few dual color spots were reported. This could have resulted from the cytokine pair selected or in difficulties in interpretation of mixed color spots. The interpretation of mixed color spots in our assay was feasible with an automated ELISPOT reader. Finally, Karulin et al used NBT/BCIP (nitroblue tetrazolium/5-bromo-4-chloro-3-indolyl phosphate) as a substrate for alkaline phosphatase conjugated Abs. In our hands this substrate produces dark blue/purple spots that when combined in a dual color ELISPOT format with red spots developed by AEC, make it difficult to distinguish spots from cell secreting both cytokines, i.e. the red color is hidden by the dark blue/purple color.
Although the detection of IL-2 was not affected by capture of both cytokines in a single well, we have shown that when capturing both IL-2 and IFN-γ the magnitude of IFN-γ was decreased. This phenomenon has been reported by others and may result from the sequestration of IL-2 (which is known to induce IFN-γ production) by capture antibodies rather than biochemical interference in the test system such as competition of capture antibody binding to the membrane (Quast et al., 2005; Cox et al., 2006). Inclusion of anti-CD28 in the dual color IFN-γ/IL-2 ELISPOT wells during antigen stimulation can rescue optimal IFN-γ secretion and produce numbers of antigen specific IFN-γ SFC equivalent to that seen in single color IFN-γ assay without affecting spot number in negative control wells (Quast et al., 2005). However, exposing PBMCs to anti-CD28 provides a costimulatory signal to T cells, which may itself modify the activation potential of T cells. In such a case, depending on the type of study undertaken, it will be necessary to evaluate if the information gained from detecting both cytokines may outweigh the cost of losing an average of 16.3% of the magnitude of the IFN-γ response.
The experiments described in this report used frozen PBMCs rather than freshly isolated PBMCs. For longitudinal experiments the ability to batch ELISPOT assessments on cells from several time points to reduce inter-assay variability concerns is an obvious advantage. Working with frozen cells also permits two step screening approaches involving initial screening with peptide pool matrices and second step verification of individual candidate responses as well as the possibility of repeating assays if needed (Addo et al., 2003). In addition, Kreher et al. demonstrated that human cryopreserved cells had similar recall antigen induced cytokine production when compared to freshly isolated PBMCs (Kreher et al., 2003). This contradicts other reports (Mwau et al., 2002a; Russell et al., 2003) but could be explained by different freezing techniques.
In conclusion, we have developed and optimized a dual color ELISPOT for the simultaneous detection of HIV-specific IFN-γ and IL-2 secreting cells. This method can be adapted to detect other cytokine combinations, detecting responses to other pathogens, is amenable to comprehensive immune monitoring in large-scale clinical trials.
Acknowledgments
This work was funded by the Canadian Vaccines and Immunotherapeutics Network and the Réseau du Sida et Maladies Infectieuses du Fonds de la Recherche en Santé du Québec (FRSQ) and by a grant from the National Institutes of Health #AI043261-04. Y.P is the recipient of a scholarship from the FRSQ. J-P.R is the recipient of a Chercheur Boursier scholarship from the FRSQ. We wish to acknowledge Ms. Chantal Grignon for nursing support for the leukapheresis infrastructure, Mr. Mario Legault and Ms. Linda Racicot, coordinators of the Primary Infection and LTNP cohorts, respectively and Ms. Nancy Simic for expert technical assistance. We are also grateful to participants in the LTNP and PI cohorts. We also wish to thanks Mr. Tameem Ansari at Cellular Technology Ltd. for help with troubleshooting the reading and analysis of dual color ELISPOTs with the CTL ImmunoSpot Instrument.
Abbreviations
- HIV
human immunodeficiency virus
- SIV
simian immunodeficiency virus
- HCV
hepatitis C virus
- VL
viral load
- CTL
cytotoxic T lymphocytes
- Th cells
T helper cells
- PBMC
peripheral blood mononuclear cells
- NK cells
natural killer cells
- IFN
interferon
- IL
interleukin
- MIP
macrophage inflammatory proteins
- TNF
tumor necrosis factor
- MHC
major histocompatibility complex
- LTNP
long-term non-progressor
- PI
primary infection
- SFC
spot forming cells
- SD
standard deviation
- CV
coefficient of variation
- ICS
intracellular cytokine staining
- BSA
bovine serum albumin
- mAb
monoclonal antibody
- AEC
amino ethyl carbazole
- DMF
N,N,-Dimethyl Formamide
- FITC
fluorescein isothiocyanate
- DMSO
dimethly sulfoxide
- FBS
fetal bovine serum
- PBS
phosphate buffer saline
- NBT/BCIP
nitroblue tetrazolium/5-bromo-4-chloro-3-indolyl phosphate
Footnotes
Publisher's Disclaimer: This is a PDF file of an unedited manuscript that has been accepted for publication. As a service to our customers we are providing this early version of the manuscript. The manuscript will undergo copyediting, typesetting, and review of the resulting proof before it is published in its final citable form. Please note that during the production process errors may be discovered which could affect the content, and all legal disclaimers that apply to the journal pertain.
REFERENCE LIST
- Addo MM, Yu XG, Rathod A, Cohen D, Eldridge RL, Strick D, Johnston MN, Corcoran C, Wurcel AG, Fitzpatrick CA, Feeney ME, Rodriguez WR, Basgoz N, Draenert R, Stone DR, Brander C, Goulder PJ, Rosenberg ES, Altfeld M, Walker BD. Comprehensive epitope analysis of human immunodeficiency virus type 1 (HIV-1)-specific T-cell responses directed against the entire expressed HIV-1 genome demonstrate broadly directed responses, but no correlation to viral load. J Virol. 2003;77:2081–2092. doi: 10.1128/JVI.77.3.2081-2092.2003. [DOI] [PMC free article] [PubMed] [Google Scholar]
- Betts MR, Nason MC, West SM, De Rosa SC, Migueles SA, Abraham J, Lederman MM, Benito JM, Goepfert PA, Connors M, Roederer M, Koup RA. HIV nonprogressors preferentially maintain highly functional HIV-specific CD8+ T-cells. Blood. 2006 doi: 10.1182/blood-2005-12-4818. [DOI] [PMC free article] [PubMed] [Google Scholar]
- Boulassel MR, Spurll G, Rouleau D, Tremblay C, Edwardes M, Sekaly RP, Lalonde R, Routy JP. Changes in immunological and virological parameters in HIV-1 infected subjects following leukapheresis. J Clin Apher. 2003;18:55–60. doi: 10.1002/jca.10051. [DOI] [PubMed] [Google Scholar]
- Cao J, McNevin J, Holte S, Fink L, Corey L, McElrath MJ. Comprehensive analysis of human immunodeficiency virus type 1 (HIV-1)-specific gamma interferon-secreting CD8+ T cells in primary HIV-1 infection. J Virol. 2003;77:6867–6878. doi: 10.1128/JVI.77.12.6867-6878.2003. [DOI] [PMC free article] [PubMed] [Google Scholar]
- Cox JH, Ferrari G, Janetzki S. Measurement of cytokine release at the single cell level using the ELISPOT assay. Methods. 2006;38:274–282. doi: 10.1016/j.ymeth.2005.11.006. [DOI] [PubMed] [Google Scholar]
- Currier JR, deSouza M, Chanbancherd P, Bernstein W, Birx DL, Cox JH. Comprehensive screening for human immunodeficiency virus type 1 subtype-specific CD8 cytotoxic T lymphocytes and definition of degenerate epitopes restricted by HLA-A0207 and -C(W)0304 alleles. J Virol. 2002a;76:4971–4986. doi: 10.1128/JVI.76.10.4971-4986.2002. [DOI] [PMC free article] [PubMed] [Google Scholar]
- Currier JR, Kuta EG, Turk E, Earhart LB, Loomis-Price L, Janetzki S, Ferrari G, Birx DL, Cox JH. A panel of MHC class I restricted viral peptides for use as a quality control for vaccine trial ELISPOT assays. J Immunol Methods. 2002b;260:157–172. doi: 10.1016/s0022-1759(01)00535-x. [DOI] [PubMed] [Google Scholar]
- Czerkinsky C, Andersson G, Ekre HP, Nilsson LA, Klareskog L, Ouchterlony O. Reverse ELISPOT assay for clonal analysis of cytokine production. I Enumeration of gamma-interferon-secreting cells. J Immunol Methods. 1988;110:29–36. doi: 10.1016/0022-1759(88)90079-8. [DOI] [PubMed] [Google Scholar]
- Feeney ME, Roosevelt KA, Tang Y, Pfafferott KJ, McIntosh K, Burchett SK, Mao C, Walker BD, Goulder PJ. Comprehensive screening reveals strong and broadly directed human immunodeficiency virus type 1-specific CD8 responses in perinatally infected children. J Virol. 2003;77:7492–7501. doi: 10.1128/JVI.77.13.7492-7501.2003. [DOI] [PMC free article] [PubMed] [Google Scholar]
- Frahm N, Korber BT, Adams CM, Szinger JJ, Draenert R, Addo MM, Feeney ME, Yusim K, Sango K, Brown NV, SenGupta D, Piechocka-Trocha A, Simonis T, Marincola FM, Wurcel AG, Stone DR, Russell CJ, Adolf P, Cohen D, Roach T, StJohn A, Khatri A, Davis K, Mullins J, Goulder PJ, Walker BD, Brander C. Consistent cytotoxic-T-lymphocyte targeting of immunodominant regions in human immunodeficiency virus across multiple ethnicities. J Virol. 2004;78:2187–2200. doi: 10.1128/JVI.78.5.2187-2200.2004. [DOI] [PMC free article] [PubMed] [Google Scholar]
- Gazagne A, Claret E, Wijdenes J, Yssel H, Bousquet F, Levy E, Vielh P, Scotte F, Goupil TL, Fridman WH, Tartour E. A Fluorospot assay to detect single T lymphocytes simultaneously producing multiple cytokines. J Immunol Methods. 2003;283:91–98. doi: 10.1016/j.jim.2003.08.013. [DOI] [PubMed] [Google Scholar]
- Harari A, Dutoit V, Cellerai C, Bart PA, Du Pasquier RA, Pantaleo G. Functional signatures of protective antiviral T-cell immunity in human virus infections. Immunol Rev. 2006;211:236–254. doi: 10.1111/j.0105-2896.2006.00395.x. [DOI] [PubMed] [Google Scholar]
- Harari A, Petitpierre S, Vallelian F, Pantaleo G. Skewed representation of functionally distinct populations of virus-specific CD4 T cells in HIV-1-infected subjects with progressive disease: changes after antiretroviral therapy. Blood. 2004;103:966–972. doi: 10.1182/blood-2003-04-1203. [DOI] [PubMed] [Google Scholar]
- Harari A, Vallelian F, Meylan PR, Pantaleo G. Functional heterogeneity of memory CD4 T cell responses in different conditions of antigen exposure and persistence. J Immunol. 2005;174:1037–1045. doi: 10.4049/jimmunol.174.2.1037. [DOI] [PubMed] [Google Scholar]
- Hernandez-Fuentes MP, Warrens AN, Lechler RI. Immunologic monitoring. Immunol Rev. 2003;196:247–264. doi: 10.1046/j.1600-065x.2003.00092.x. [DOI] [PubMed] [Google Scholar]
- Horton H, Russell N, Moore E, Frank I, Baydo R, Havenar-Daughton C, Lee D, Deers M, Hudgens M, Weinhold K, McElrath MJ. Correlation between interferon- gamma secretion and cytotoxicity, in virus-specific memory T cells. J Infect Dis. 2004;190:1692–1696. doi: 10.1086/424490. [DOI] [PubMed] [Google Scholar]
- Karulin AY, Hesse MD, Tary-Lehmann M, Lehmann PV. Single-cytokine-producing CD4 memory cells predominate in type 1 and type 2 immunity. J Immunol. 2000;164:1862–1872. doi: 10.4049/jimmunol.164.4.1862. [DOI] [PubMed] [Google Scholar]
- Kaufmann DE, Bailey PM, Sidney J, Wagner B, Norris PJ, Johnston MN, Cosimi LA, Addo MM, Lichterfeld M, Altfeld M, Frahm N, Brander C, Sette A, Walker BD, Rosenberg ES. Comprehensive analysis of human immunodeficiency virus type 1-specific CD4 responses reveals marked immunodominance of gag and nef and the presence of broadly recognized peptides. J Virol. 2004;78:4463–4477. doi: 10.1128/JVI.78.9.4463-4477.2004. [DOI] [PMC free article] [PubMed] [Google Scholar]
- Klenerman P, Wu Y, Phillips R. HIV: current opinion in escapology. Curr Opin Microbiol. 2002;5:408–413. doi: 10.1016/s1369-5274(02)00339-9. [DOI] [PubMed] [Google Scholar]
- Kreher CR, Dittrich MT, Guerkov R, Boehm BO, Tary-Lehmann M. CD4+ and CD8+ cells in cryopreserved human PBMC maintain full functionality in cytokine ELISPOT assays. J Immunol Methods. 2003;278:79–93. doi: 10.1016/s0022-1759(03)00226-6. [DOI] [PubMed] [Google Scholar]
- Kumar A, Weiss W, Tine JA, Hoffman SL, Rogers WO. ELISPOT assay for detection of peptide specific interferon-gamma secreting cells in rhesus macaques. J Immunol Methods. 2001;247:49–60. doi: 10.1016/s0022-1759(00)00310-0. [DOI] [PubMed] [Google Scholar]
- Lalvani A, Brookes R, Hambleton S, Britton WJ, Hill AV, McMichael AJ. Rapid effector function in CD8+ memory T cells. J Exp Med. 1997;186:859–865. doi: 10.1084/jem.186.6.859. [DOI] [PMC free article] [PubMed] [Google Scholar]
- Larsson M, Jin X, Ramratnam B, Ogg GS, Engelmayer J, Demoitie MA, McMichael AJ, Cox WI, Steinman RM, Nixon D, Bhardwaj N. A recombinant vaccinia virus based ELISPOT assay detects high frequencies of Pol-specific CD8 T cells in HIV-1-positive individuals. AIDS. 1999;13:767–777. doi: 10.1097/00002030-199905070-00005. [DOI] [PubMed] [Google Scholar]
- Letsch A, Scheibenbogen C. Quantification and characterization of specific T-cells by antigen-specific cytokine production using ELISPOT assay or intracellular cytokine staining. Methods. 2003;31:143–149. doi: 10.1016/s1046-2023(03)00124-5. [DOI] [PubMed] [Google Scholar]
- Lichterfeld M, Kaufmann DE, Yu XG, Mui SK, Addo MM, Johnston MN, Cohen D, Robbins GK, Pae E, Alter G, Wurcel A, Stone D, Rosenberg ES, Walker BD, Altfeld M. Loss of HIV-1-specific CD8+ T cell proliferation after acute HIV-1 infection and restoration by vaccine-induced HIV-1-specific CD4+ T cells. J Exp Med. 2004;200:701–712. doi: 10.1084/jem.20041270. [DOI] [PMC free article] [PubMed] [Google Scholar]
- Martro E, Suligoi B, Gonzalez V, Bossi V, Esteve A, Mei J, Ausina V. Comparison of the avidity index method and the serologic testing algorithm for recent human immunodeficiency virus (HIV) seroconversion, two methods using a single serum sample for identification of recent HIV infections. J Clin Microbiol. 2005;43:6197–6199. doi: 10.1128/JCM.43.12.6197-6199.2005. [DOI] [PMC free article] [PubMed] [Google Scholar]
- Migueles SA, Laborico AC, Shupert WL, Sabbaghian MS, Rabin R, Hallahan CW, Van Baarle D, Kostense S, Miedema F, McLaughlin M, Ehler L, Metcalf J, Liu S, Connors M. HIV-specific CD8+ T cell proliferation is coupled to perforin expression and is maintained in nonprogressors. Nat Immunol. 2002;3:1061–1068. doi: 10.1038/ni845. [DOI] [PubMed] [Google Scholar]
- Mwau M, McMichael AJ, Hanke T. Design and validation of an enzyme-linked immunospot assay for use in clinical trials of candidate HIV vaccines. AIDS Res Hum Retroviruses. 2002b;18:611–618. doi: 10.1089/088922202760019301. [DOI] [PubMed] [Google Scholar]
- Mwau M, McMichael AJ, Hanke T. Design and validation of an enzyme-linked immunospot assay for use in clinical trials of candidate HIV vaccines. AIDS Res Hum Retroviruses. 2002a;18:611–618. doi: 10.1089/088922202760019301. [DOI] [PubMed] [Google Scholar]
- Okamoto Y, Abe T, Niwa T, Mizuhashi S, Nishida M. Development of a dual color enzyme-linked immunospot assay for simultaneous detection of murine T helper type 1- and T helper type 2-cells. Immunopharmacology. 1998;39:107–116. doi: 10.1016/s0162-3109(98)00007-1. [DOI] [PubMed] [Google Scholar]
- Peretz Y, Alter G, Boisvert MP, Hatzakis G, Tsoukas CM, Bernard NF. Human immunodeficiency virus (HIV)-specific gamma interferon secretion directed against all expressed HIV genes: relationship to rate of CD4 decline. J Virol. 2005;79:4908–4917. doi: 10.1128/JVI.79.8.4908-4917.2005. [DOI] [PMC free article] [PubMed] [Google Scholar]
- Quast S, Zhang W, Shive C, Kovalovski D, Ott PA, Herzog BA, Boehm BO, Tary-Lehmann M, Karulin AY, Lehmann PV. IL-2 absorption affects IFN-gamma and IL-5, but not IL-4 producing memory T cells in double color cytokine ELISPOT assays. Cell Immunol. 2005;237:28–36. doi: 10.1016/j.cellimm.2005.09.002. [DOI] [PubMed] [Google Scholar]
- Russell ND, Hudgens MG, Ha R, Havenar-Daughton C, McElrath MJ. Moving to human immunodeficiency virus type 1 vaccine efficacy trials: defining T cell responses as potential correlates of immunity. J Infect Dis. 2003;187:226–242. doi: 10.1086/367702. [DOI] [PubMed] [Google Scholar]
- Wherry EJ, Ahmed R. Memory CD8 T-cell differentiation during viral infection. J Virol. 2004;78:5535–5545. doi: 10.1128/JVI.78.11.5535-5545.2004. [DOI] [PMC free article] [PubMed] [Google Scholar]
- Wherry EJ, Blattman JN, Murali-Krishna K, van der MR, Ahmed R. Viral persistence alters CD8 T-cell immunodominance and tissue distribution and results in distinct stages of functional impairment. J Virol. 2003;77:4911–4927. doi: 10.1128/JVI.77.8.4911-4927.2003. [DOI] [PMC free article] [PubMed] [Google Scholar]
- Younes SA, Yassine-Diab B, Dumont AR, Boulassel MR, Grossman Z, Routy JP, Sekaly RP. HIV-1 viremia prevents the establishment of interleukin 2-producing HIV-specific memory CD4+ T cells endowed with proliferative capacity. J Exp Med. 2003;198:1909–1922. doi: 10.1084/jem.20031598. [DOI] [PMC free article] [PubMed] [Google Scholar]
- Zimmerli SC, Harari A, Cellerai C, Vallelian F, Bart PA, Pantaleo G. HIV-1-specific IFN-gamma/IL-2-secreting CD8 T cells support CD4-independent proliferation of HIV-1-specific CD8 T cells. Proc Natl Acad Sci U S A. 2005;102:7239–7244. doi: 10.1073/pnas.0502393102. [DOI] [PMC free article] [PubMed] [Google Scholar]