Abstract
Research and outcomes with cochlear implants (CIs) have revealed a dichotomy in the cues necessary for speech and music recognition. CI devices typically transmit 16–22 spectral channels, each modulated slowly in time. This coarse representation provides enough information to support speech understanding in quiet and rhythmic perception in music, but not enough to support speech understanding in noise or melody recognition. Melody recognition requires some capacity for complex pitch perception, which in turn depends strongly on access to spectral fine structure cues. Thus, temporal envelope cues are adequate for speech perception under optimal listening conditions, while spectral fine structure cues are needed for music perception. In this paper, we present recent experiments that directly measure CI users’ melodic pitch perception using a melodic contour identification (MCI) task. While normal-hearing (NH) listeners’ performance was consistently high across experiments, MCI performance was highly variable across CI users. CI users’ MCI performance was significantly affected by instrument timbre, as well as by the presence of a competing instrument. In general, CI users had great difficulty extracting melodic pitch from complex stimuli. However, musically-experienced CI users often performed as well as NH listeners, and MCI training in less experienced subjects greatly improved performance. With fixed constraints on spectral resolution, such as it occurs with hearing loss or an auditory prosthesis, training and experience can provide a considerable improvements in music perception and appreciation.
Keywords: cochlear implant, music perception, melodic contour identification
1. INTRODUCTION
In the 1970s most auditory researchers thought that cochlear implants (CIs) could never provide sufficient information to allow high levels of speech recognition. The hydromechanics of the cochlea is highly specialized and the pattern of nerve firing in the auditory nerve is highly complex. Replacing this complex natural system with a small number of electrodes was thought to be impossible. However, even the early multi-channel CIs allowed some degree of open set speech recognition by deaf patients, and the average performance level has increased steadily over the years. At the present time, the average CI listener can recognize about 95% of words in sentences using only the sound from the implant (see Shannon et al., 2004).
However, music recognition with CIs remains problematic. It is now apparent that different cues are required for speech recognition and music perception. High levels of speech recognition can be attained only a few bands of noise, each modulated by the temporal envelope of speech from that spectral region (Shannon et al., 1995). Speech pattern recognition is possible even when the signal is missing most of the spectral and temporal fine structure information. In contrast to speech, melody recognition requires considerably more spectral and temporal fine structure cues, and so is not well supported by the representation of the CI (Smith et al., 2002).
In general, pitch can be conveyed by cochlear location, temporal repetition, and harmonics of a fundamental frequency (Rosen, 1992). CI listeners receive temporal pitch up to about 300–500 Hz, similar to pitch reception by normal hearing (NH) listeners when all spectral cues are removed (Burns and Viemeister, 1976, 1981). CI listeners also can detect changes in pitch as a function of the electrode location in the cochlea, with apical electrodes sounding lower in pitch than electrodes near the base of the cochlea. It is possible that this qualitative change with electrode location is more of a timbral cue rather than a pitch cue. The most salient cue for pitch, the one that is most important for musical pitch, is the pitch arising from harmonics of a fundamental frequency (F0). Models of harmonic pitch have variously used the spectral and/or temporal information from a harmonic stimulus to extract F0. It remains unclear what biological mechanism may be responsible for the perception of harmonic pitch. Currently, CIs do not provide sufficient spectral or temporal fine structure information to support harmonic pitch, due to the limited number of implanted electrodes and the lack of channel selectivity associated with electrical stimulation. As a consequence, CI listeners are poor at detecting and discriminating harmonic pitch.
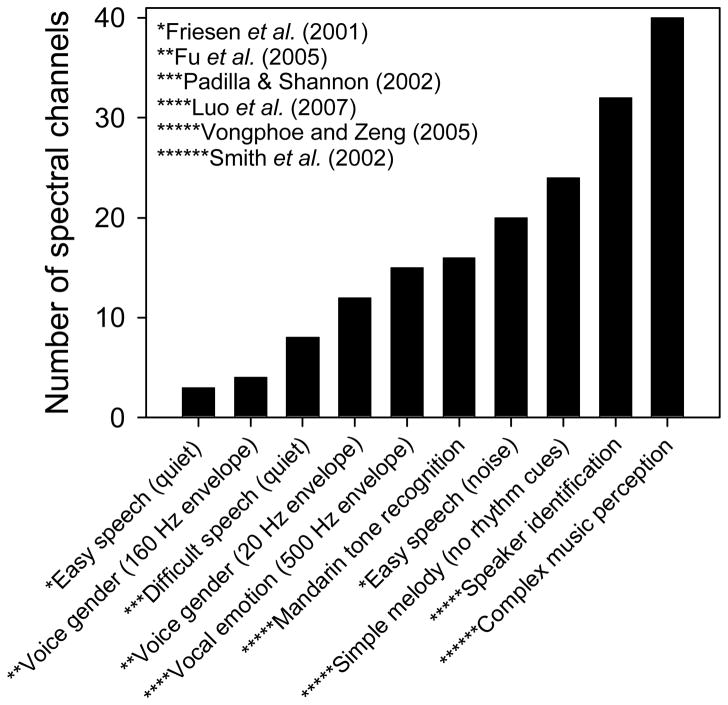
Let us examine the number of spectral channels of information that are necessary for speech and music recognition. Figure 1 shows the estimated number of spectral channels needed to support good (>80% correct) performance for a variety of listening tasks. Data was extracted from previous CI simulation studies with NH listeners (Friesen et al. 2001; Fu et al., 2005; Padilla and Shannon, 2002; Luo et al., 2007; Vongphoe and Zeng, 2005; Smith et al., 2002). As the difficulty of the listening task is increased, more spectral channels are needed to maintain good performance, with more than 32 channels needed to support complex music perception. Most of the difficult listening tasks (e.g., Mandarin tone recognition, music perception, speaker identification) rely strongly on the reception of F0 cues and therefore require more spectral channels. Most of the easy tasks (e.g., sentence or phoneme recognition in quiet) require relatively few spectral channels, relying more strongly on temporal envelope cues within each channel. Four to eight spectral channels may be adequate for speech perception under optimal listening conditions, but complex listening tasks such as music perception require many more channels.
Figure 1.
Estimated number of channels needed to support good performance (>80% correct) by NH subjects listening to acoustic CI simulations, for various listening tasks.
There has been a recent surge of research interest in CI users’ music perception, with many studies showing the deficit in CI users’ music perception and appreciation, relative to NH listeners. As of yet, there are few standardized measurements for CI music perception. Part of the difficulty arises from the goal of the assessment. If the goal is to determine how much melodic pitch information is received by CI users, and further, how to effectively transmit more pitch information, what is the best way to assess CI performance? Subjective quality ratings are important (e.g. Gfeller et al., 2000), but do not provide much information regarding melodic pitch resolution or guidance toward improving melodic pitch perception. Simple single-channel psychophysics (e.g., electrode discrimination, rate discrimination) may reveal some performance limitations, but local single-channel measures may not predict multi-channel performance, especially in the context of dynamic, complex stimuli. Indeed, electrode discrimination has not been strongly correlated with speech performance (e.g., Henry et al., 2000; Nelson et al., 1995) or music perception (Galvin et al., 2007) in CI users. Familiar melody identification (FMI) has been used to describe CI users’ music perception in many studies (e.g., Kong et al., 2004; 2005). Because rhythm cues are readily perceived by CI users and contribute strongly to FMI performance, FMI is often measured without rhythm cues, using simple stimuli such as pulse trains or sine waves. This manipulation is meant to assess the limits of CI users’ melodic pitch perception. The FMI task without rhythm cues is problematic, in that it relies on CI users’ memory of familiar melodies that are now distorted in terms of rhythm cues and melodic pitch (due to the CI processing). The results of FMI testing provide little guidance as to the limits of melodic pitch perception (e.g., what is the semitone resolution across a given frequency range) and little opportunity to reliably retest performance with novel processing strategies (due to repeated testing with a closed set of melodies).
To address some of these concerns and to provide a more objective measure of CI users’ melodic pitch perception, Galvin et al. (2007) designed a melodic contour identification (MCI) task. The stimuli in the MCI test consist of nine five-note melodic contours (shown in Figure 1), comprised of combinations of rising, flat and falling pitch sequences. To test CI users’ melodic pitch resolution, the intonation (i.e., the spacing between successive notes in the contour) is varied between 1, 2, 3, 4, and 5 semitones. Given CI users’ coarse spectral resolution, 1-semitone intonation (which might only stimulate a small number of electrodes) would be expected to be much more difficult than 5-semitone intonation (which might stimulate most of the electrode array). The notes in each contour are of equal duration, as are the silent intervals between notes; thus, there are no rhythm cues that might influence melodic pitch perception. The notes in each contour were generated in relation to a “root note” (the lowest note in the contour) according to: , where f is the frequency of the target note, x is the number of semitones relative to the root note and fref is the frequency of the root note. During MCI testing, a contour is randomly selected from the stimulus set and presented to the listener, who is asked to click on the matching response choice. For more information about the MCI procedures, please refer to Galvin et al. (2007).
2. MCI WITH SIMPLE STIMULI (Galvin et al., 2007)
To provide an objective measure of melodic pitch perception, MCI was measured in CI and NH subjects. A 3-tone complex was used for the musical notes to simulate some of the harmonic components found in musical instruments; the 3-tone complex also provided more spectral components than F0 alone, requiring CI users to extract melodic pitch from a somewhat broad stimulation pattern. Three frequency ranges were tested to examine whether local spectral regions influenced MCI performance.
2.1 Methods
Eleven CI users and nine NH subjects participated in the experiment. CI subjects were comprised of users of different devices (e.g., Cochlear, Advanced Bionics, Med-El) and speech processing strategies (ACE, SPEAK, Hi-Res, CIS). CI subjects were tested while wearing their clinically assigned speech processors and settings; once set, subjects were asked to not change these settings during the course of testing. All stimuli were presented via a single loudspeaker at 70 dBA in a sound-treated booth.
Nine melodic contours (see Figure 2) were generated and included simple pitch contours (“Rising,” “Flat,” “Falling”) and changes in pitch contour (“Flat-Rising,” “Falling-Rising,” “Rising-Flat,” “Falling-Flat,” “Rising-Falling,” “Flat-Falling”). The notes consisted of 3-tone complexes: F0, the first harmonic (F1, −3 dB relative to F0) and the second harmonic (F2, −6 dB relative to F0). Each note was 250 ms in duration and the interval between notes was 50 ms. Three frequency ranges were tested, with root notes of A3 (220 Hz), A4 (440 Hz) and A5 (880 Hz). Five intonation conditions were tested: 1, 2, 3, 4, or 5 semitones between successive notes in the contour. Thus, MCI was measured using 135 melodic contours in the stimulus set. During testing, a contour would be randomly selected (without replacement) from the stimulus set and presented to the subject. The subject was asked to click on one of nine response buttons, pictographically labeled according to the nine contour shapes. No preview or trial-by-trial feedback was provided. For more details, please refer to Galvin et al. (2007).
Figure 2.
Nine melodic contours used in the MCI test.
2.2 Results and discussion
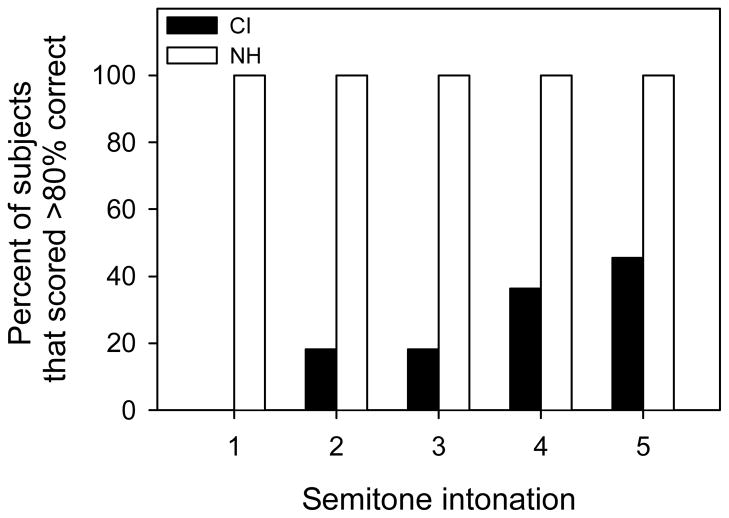
Mean NH performance was 94.8% correct, with scores ranging from 88.1% to 100% correct. Mean CI performance was 53.3% correct; there was much greater great inter-subject variability, with scores ranging from 14.1% to 90.7% correct. Figure 3 shows the distribution of NH and CI subjects that scored >80% correct (i.e., good performance) within each intonation condition. All NH subjects scored >80% correct with 1 or more semitone intonation. No CI subjects scored >80% correct with 1 semitone intonation, and less than 20% of CI subjects scored 80% correct with 2 or 3 semitone intonation. Even with 5 semitone intonation, less than 50% of CI subjects scored >80% correct. Thus, while NH subjects were capable of good performance with only 1 semitone intonation, the majority of CI users were not capable of good performance even with 5 semitone intonation. The best performing CI subjects seemed to make use of cross-channel spectral cues as well as within-channel temporal cues (especially for the 1- and 2-semitone intonation conditions). Poorer performing subjects were unable to make use of strong cross-channel differences to track melodic pitch. There was only a minor effect for frequency range; mean CI performance was 49.7 % correct for A3, 54.6 % correct for A4 and 55.7 % correct for A5.
Figure 3.
Percent of CI (black bars) and NH (white bars) subjects who scored >80% correct in the MCI test with simple stimuli, as a function of the semitone intonation between notes in the melodic contour.
3. TIMBRE INFLUENCES MCI (Galvin et al., 2008)
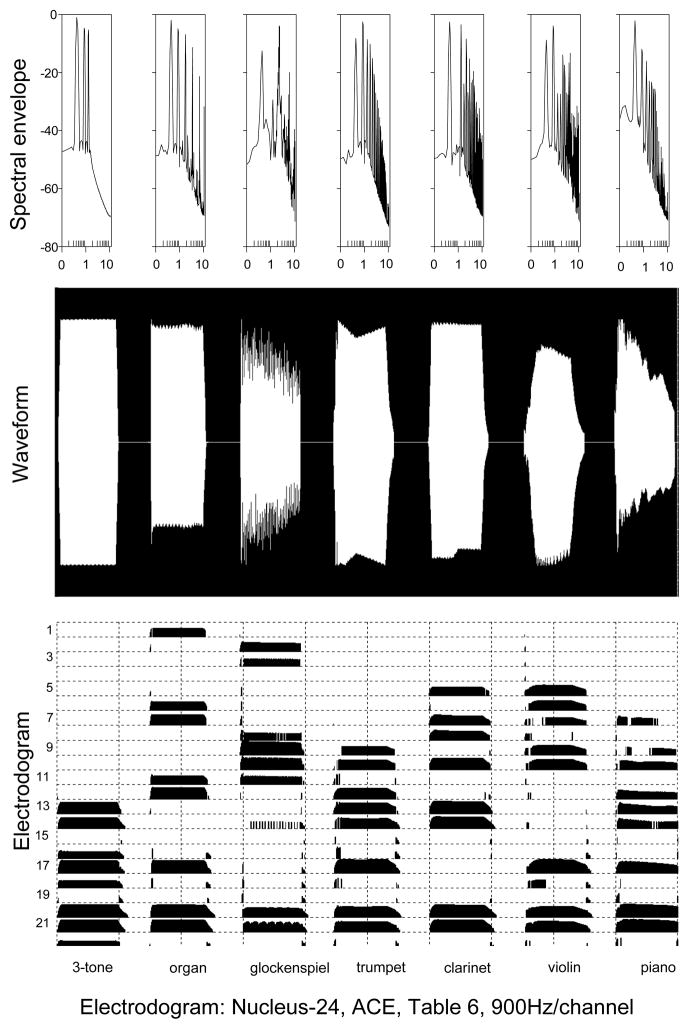
In the previous experiment, MCI performance was measured for a relatively simple stimulus (3-tone harmonic complex). “Real” musical instruments are more complex in terms of spectral and temporal properties. Instrument “timbre” has been defined as “that attribute of auditory sensation in terms of which a listener can judge that two sounds similarly presented and having the same loudness and pitch are dissimilar” (ANSI, 1960). Timbre cues are important to identify a musical instrument, or to segregate musical instruments in a polyphonic context. Timbre has been shown to influence pitch perception in NH listeners (e.g., Poulin et al., 2004; Wolpert, 1990). Given the parameters of CI signal processing, instrument timbre may influence CI users’ melodic pitch perception. Differences in instrument timbre can be analyzed according to spectral and temporal envelope properties. Figure 4 shows spectral envelopes, temporal waveforms and electrodograms (patterns of electrodes stimulated over time) for the 3-tone complex from the previous MCI experiment and for the six instruments in the present MCI experiment; the note is the same for all instruments (A4). Some instruments (piano, violin) have relatively complex spectral envelopes while others have relatively dynamic temporal envelopes (glockenspiel, violin, piano). The electrodograms were generated using the default stimulation rate and frequency allocation used by many Nucleus-24 CI patients. The different instruments give rise to very different stimulation patterns, even for the same note. To better evaluate CI users’ “real-world” music perception, melodic pitch perception was measured for six different instruments using the MCI task.
Figure 4.
Spectral envelopes (top), waveforms (midldle) and electrodograms for A4 (440 Hz), as a function of the instruments used in the MCI test. The electrodograms were generated using custom software that simulated the default parameters used in the Nucleus-24 device with the ACE strategy.
3.1 Methods
Eight CI users and eight NH subjects participated in the experiment. Most of the CI subjects participated in the previous MCI experiment (Galvin et al., 2007). Test methodology was exactly as in the previous experiment.
Nine melodic contours (the same as in the previous experiment) were generated for each instrument using MIDI sampling and synthesis. The six instruments included: organ, glockenspiel (similar to a xylophone), trumpet, clarinet, violin and piano. Similar to the previous experiment, the note duration was 250 ms, and the interval between notes was 50 ms. Also, similar to the previous experiment, five intonation conditions were tested. In the present experiment, only the A4 root note was tested (F0 range: 440 – 1397 Hz). MCI performance was measured independently for each instrument. Further details can be found in Galvin et al. (2008).
3.2 Results and discussion
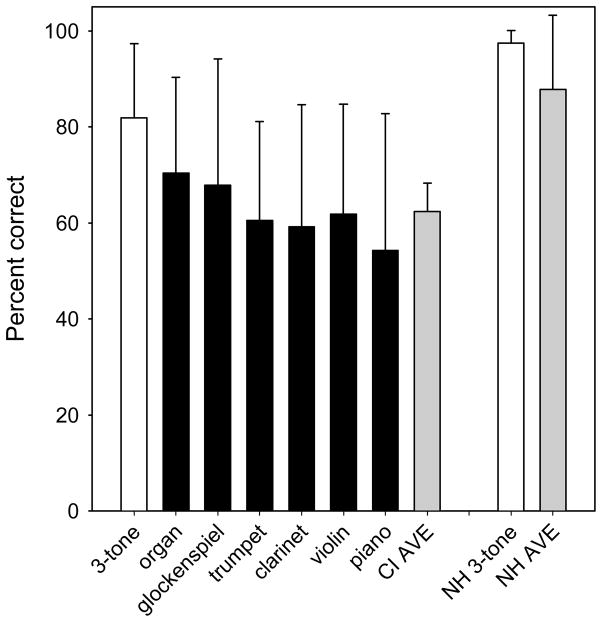
Mean CI performance across subjects and instruments was 62.3% correct; individual subjects’ mean scores across instruments ranged from 30.1% to 97.9% correct. Mean CI performance was best with the organ (70.4% correct) and poorest with the piano (54.2% correct). Mean NH performance across subjects and instruments was much higher than that of CI users (86.8% correct, ranging from 61.5% to 100.0% correct). Similar to CI subjects, mean NH performance was best with the organ (89.5% correct) and poorest with the piano (83.4% correct). A two-way repeated-measures (RM) ANOVA showed that instrument [F(5,140)=3.74, p=0.008] and intonation significantly affected CI performance [F(5,140)=4.06, p=0.01]. Figure 5 shows mean CI performance for the 3 tone complex [A4 data only from subjects who participated in the previous Galvin et al. (2007) study] and for the six instruments; mean NH data for the 3-tone complex and across instruments are shown for comparison. For both CI and NH subjects, performance across the six instruments was markedly worse than that with the 3-tone complex.
Figure 5.
Percent correct for the A4 root note for different instruments, for CI and NH subjects. The results for the 3-tone complex (Galvin et al., 2007) are shown by the white bars. The black bars show results for individual instruments. The gray bars show mean results across subjects and instruments (excluding the 3-tone complex). The error bars show one standard deviation of the mean.
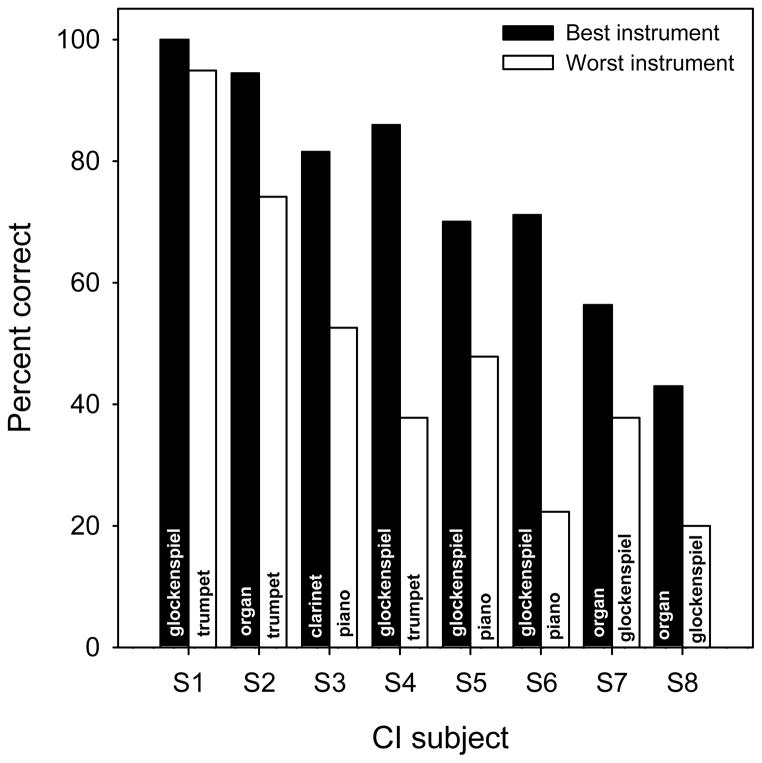
While mean CI performance was significantly affected by instrument timbre, individual subjects exhibited different patterns of results across the six instruments. Figure 6 shows individual CI subject performance for the best and worst instrument. The performance deficit with the worst instrument ranged from 5.2 percentage points (S1) to 48.1 percentage points (S4). The best and worst instruments also varied among CI subjects, suggesting that the optimal pattern for melodic pitch perception differed from subject to subject. There were no clear spectral or temporal properties of the instruments (e.g., “noisy” spectrum, sharp attack, etc.) that reliably predicted performance. Overall, a relatively simple harmonic structure (3-tone complex, organ) seemed to provide the best performance while spectral and temporal complexity (piano) seemed to reduce performance.
Figure 6.
Percent correct for best instrument (black bars) and worst instrument (white bars), as a function of individual subject. Instruments are labeled within each bar.
The fact that the best and worst instruments were highly idiosyncratic across listeners suggests that the distribution of harmonics across electrodes plays a major role in melodic pitch recognition. The differences in MCI performance between the best and worst instruments are sometimes quite large. These performance differences may be due to patient-related factors (e.g., electrode location, uniformity of nerve survival, etc.). For example, instruments that contain more low-frequency harmonic components may better convey melodic pitch better for CI users with deep electrode insertions. Alternatively, CI users may differ in terms of the spectral components used to extract melodic pitch. Some CI listeners may attend to high-frequency components and others to low-frequency components. Additional research may help to better understand the relation between instrument timbre, melodic pitch perception and individual CI patient factors.
4. COMPETING INSTRUMENT INTERFERES WITH MCI (Galvin et al., submitted)
In the previous experiment, instrument timbre was shown to affect CI users’ melodic pitch perception. Individual CI subjects appeared to use different aspects of the stimulation patterns to extract melodic pitch. This suggests that some components of the stimulation pattern may better support or interfere with melodic pitch perception, and that these components may differ among individual CI users. The previous experiment was conducted in a monophonic context (i.e., single instrument). In a polyphonic context (i.e., multiple instruments), timbre cues allow listeners to segregate instruments and track the different melodic components (e.g., a singer’s voice within a musical ensemble). Most music is presented in a polyphonic context, and polyphonic music is especially challenging for CI users (e.g., Looi et al., 2008). It is not well known how CI users’ melodic pitch perception may be influenced by the presence of two or more instruments.
In the present study, melodic pitch perception was measured for three target instruments (organ, violin, piano) in the presence of a competing masker instrument (piano), using the MCI task. The target instruments were selected to represent a range of spectral and temporal properties that were similar or dissimilar to the masker instrument. The F0 of the masker instrument was varied to provide different degrees of overlap with the target instruments. In music, different melodic lines may dynamically overlap in time while occupying different frequency ranges, i.e., a bass may play a melodic line with quarter notes while a piccolo flute may play a different melodic line with 16th notes. The present study was designed to represent a worst-case scenario, i.e., simultaneous presentation of competing instruments and contours. As such, some CI users’ may not perceive two instruments playing two contours, but rather a single “hybrid” instrument playing a single contour.
4.1 Methods
Seven CI users and seven NH subjects participated in the experiment. Most of the CI and NH subjects participated in the previous MCI timbre experiment (Galvin et al., 2008). Test methodology was exactly as in the previous MCI experiments.
Nine melodic contours (the same as in the previous MCI experiments) were generated for each instrument using MIDI sampling and synthesis; each note was 250 ms in duration, and the interval between notes was 50 ms. The three target instruments were the organ, violin and piano, and the masker instrument was the piano. For the target instruments, MCI was measured only the A3 root note (F0 range: 220 – 698 Hz). The masker consisted of the “Flat” contour played by the piano (i.e., each note was the same). The F0 of the masker was varied to be A3 (220 Hz), A4 (440 Hz), A5 (880 Hz), or A6 (1720 Hz). Subjects were explicitly instructed that the masker was the piano, and that the masker contour was Flat. The target and masker contours were normalized to have the same long term RMS (65 dB) and then summed; the signal was output at 70 dBA. The target and masker contours were presented simultaneously, i.e., the onset, duration and offset for each note of the target and masker contours were the same. MCI was also measured for each target instrument without the masker. The different target instruments and masker F0 conditions were tested independently, but randomized across subjects and tests.
4.1 Results and discussion
Mean CI performance with the target instruments was significantly lower in the presence of the competing piano masker. A two-way RM ANOVA showed significant effects for target instrument [F(2,48)=10.20, p=0.003] and masker F0 [F(4,48)=8.03, p<0.001]. Post-hoc Bonferroni t-tests showed that the piano was significantly worse than the organ or violin target instruments (p<0.05), and that the “No masker” condition was significantly better than any of the masker F0 conditions (p<0.05); there was no significant difference between the violin and organ, or between the four F0 masker conditions. For NH subjects, a two-way RM ANOVA showed no significant effects for target instrument [F(2,48)=3.83, p=0.052] or masker F0 [F(4,48)=0.49, p=0.743]. Thus, while CI users’ MCI performance was significantly affected by the presence of a competing instrument, NH performance was not affected by the competing instrument.
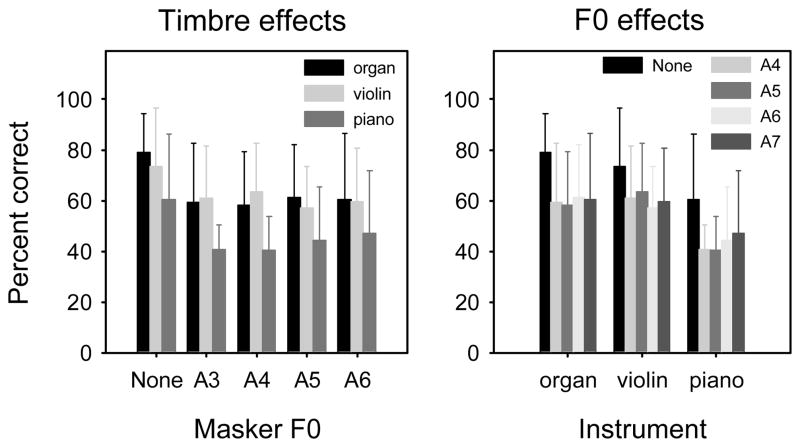
Figure 7 shows mean CI performance analyzed in terms of timbre effects (left panel) and masker F0 effects (right panel). For all masker F0 conditions, only small differences were observed between the organ and violin, both of which provided better performance than the piano target. This suggests that CI listeners were able to make use of some timbre differences between the target and masker instruments. Within each instrument, there were no significant differences between masker F0s, all of which provided poorer performance than the No masker condition. This result is similar to competing speech data from Stickney et al. (2007), who found that CI listeners were unable to use F0 differences between target and masker speakers in a sentence recognition task.
Figure 7.
Mean CI results (across subjects) for MCI with a competing instrument, as a function of masker-target instrument F0 overlap (left panel) or target instrument (right panel). The error bars show one standard deviation of the mean
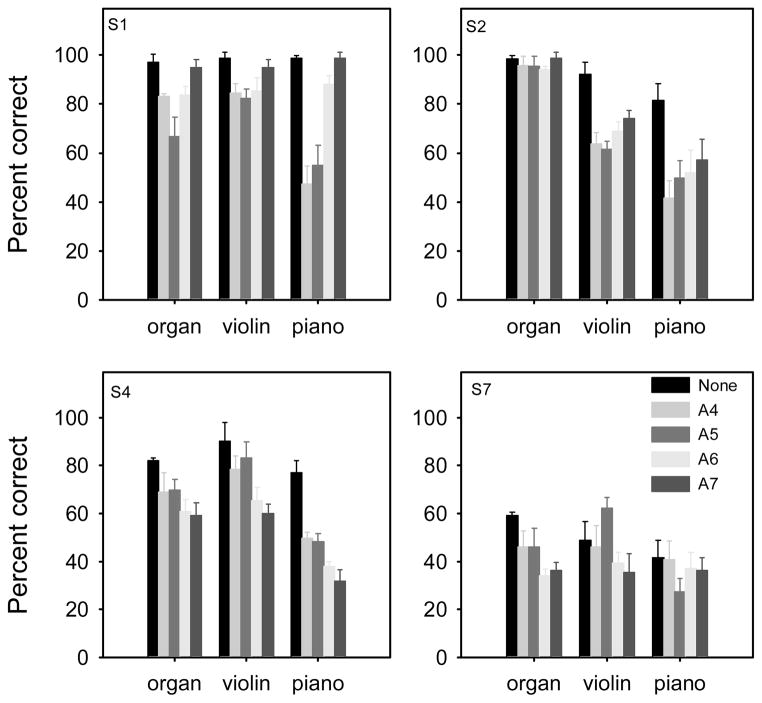
Similar to the previous MCI timbre experiment (Galvin et al., 2008), individual CI subjects exhibited markedly different patterns of results. Figure 8 shows data for 4 CI subjects. Subject S1 was able to make use of both timbre and F0 differences between the target and masker; performance with the piano was poorer than that with the organ or violin, and performance generally improved as the masker F0 was increased. Note that S1 had extensive music experience before and after implantation. For subject S2, the piano masker had no effect on performance with the organ; note that S2 received organ lessons as a child. S2 was also able to make use of some timbre and F0 differences between target and masker. For subject S4, performance worsened as the masker F0 was increased, suggesting that S4 attended to high frequency components when extracting melodic pitch. For subject S7, performance was generally poor with or without the masker; the competing instrument did not necessarily worsen performance.
Figure 8.
CI results for 4 CI subjects for MCI with a competing instrument, as a function of target instrument. The error bars show one standard deviation of the mean.
5. WHAT FREQUENCY REGIONS BEST SUPPORT MELODIC PITCH PERCEPTION BY CI USERS?
In the previous MCI studies, there was great inter-subject variability in performance among CI users. With simple stimuli, some CI users could identify >90% of contours with 2-semitone intonation, while other could identify only 35% of contours even with 5-semtione intonation. Different instruments produced different MCI performance among individual CI subjects, with some instruments reducing performance by as much as 48 percentage points. The presence of a competing instrument also affected individual CI subjects differently, with some subjects attending to the lower frequency components and others attending to the higher frequency components. Individual CI users may extract pitch from different regions of the stimulation pattern. It is unclear which regions may contribute (or interfere) with melodic pitch perception. In the following pilot study, MCI was measured for different band-pass frequency regions and compared to performance with broadband stimulation.
5.1 Methods
Three CI users participated in this pilot study. The methodology was similar to that used in the previous MCI experiments (Galvin et al., 2007; 2008). Subjects were tested using their clinically assigned speech processors and settings.
MCI was measured using only the piano sample and the A3 root note (220 Hz). Nine contours were generated. Four bandwidth conditions were tested: 0–8000 Hz (broadband), 0–500 Hz, 500–2000 Hz, 2000–8000 Hz. For each bandwidth condition, each contour was bandpass-filtered (24 dB/octave) and the output was normalized to have the same long-term RMS as the input signal (65 dB); the bandpassed signal was output at 70 dBA. Only three intonation conditions were tested: 1, 2 or 3 semitones. Intonation was limited to 3 semitones to ensure that the F0s for the Rising and Falling contours fell within the 0–500 Hz bandwidth condition. Thus, there were 27 stimuli within each bandwidth condition. Subjects completed 2–3 MCI tests for each bandwidth condition, and the conditions were randomized within and across subjects.
5.2 Results and discussion
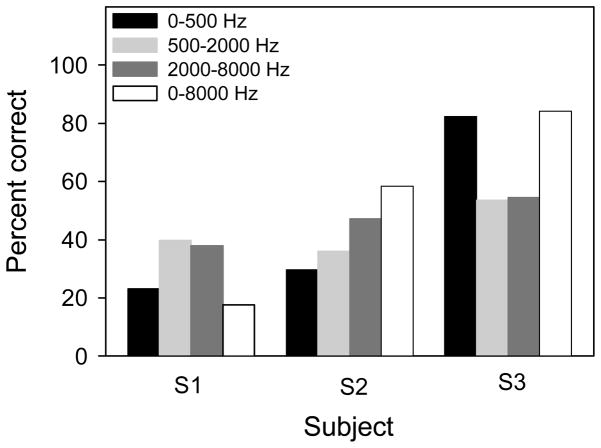
Figure 9 shows individual CI subject performance for the different bandwidth conditions. Similar to the previous MCI studies, individual subjects exhibited different patterns of results. For subject S21, the mid and upper frequency regions provided better performance than the low frequency region. Broadband performance was similar to that with the low frequency region, suggesting that low-frequency components dominated (and interfered with) melodic pitch perception. For subject S22, MCI performance improved from the low to the mid, and from the mid to the upper frequency regions. Broadband performance was better than that with any of the band-limited frequency regions. While performance may have been dominated by the upper frequency region, the low frequency region did not reduce performance. For subject S23, broadband performance was dominated by the low-frequency region. Performance was poorer for the mid and upper frequency regions; however, these regions did not reduce broadband performance. This limited data set suggests that individual CI listeners may attend to different portions of the acoustic input to extract melodic pitch. For some CI users, some frequency regions provide weaker melodic pitch, and may even interfere with broadband melodic pitch perception. Note that the best overall performance among these three CI subjects was for S23 who predominately used low-frequency cues; the poorest overall performance was for S21, for whom low-frequency cues were detrimental. For these CI users, optimal signal processing may enhance melodic pitch perception and reduce interference by problematic frequency regions. It is possible that training with an optimally band-limited signal, then adding other frequency components may improve broadband performance in these CI users.
Figure 9.
MCI performance with the piano (A3 root note), for individual CI subjects. The different bars show performance for different band-pass frequency ranges.
6. MUSICAL EXPERIENCE AND/OR TRAINING CAN IMPROVE MELODIC PITCH PERCEPTION
Musical experience has been shown to influence CI users’ music perception and appreciation (e.g., Gfeller et al., 2000). Musical experience may be particularly important when listening to distorted or mistuned melodies (Lynch et al., 1991), as may often occur with CIs. In the previous MCI studies with different instruments (Galvin et al., 2008) or a competing instrument (Galvin et al., submitted), the top performers (S1 and S2) were also the most musically-experienced, before and after implantation. Subject S1 was and remains a performing musician and songwriter, while subject S2 took organ lessons as a child and spent extended periods listening to music with the CI after implantation. The strong previous musical experience and the effort to engage music after implantation may have provided these CI users some advantage for melodic pitch perception. For less experienced CI users, targeted training may benefit melodic pitch perception. Indeed, training has been shown to improve CI patients’ musical timbre perception (Gfeller et al. 2002). For a subset of CI subjects who participated in the MCI experiments with simple stimuli (Galvin et al., 2007) and with different instruments (Galvin et al., 2008), MCI training was performed on home computers using novel stimuli not used in the MCI testing.
6.1 Methods
Six CI subjects from the Galvin et al. (2007) study were trained using simple stimuli (3-tone complexes). Baseline MCI performance was measured for the A3, A4 and A5 frequency ranges. Baseline familiar melody identification (FMI) without rhythm cues was also measured in four of the six CI subjects. The FMI test consisted of 12 familiar melodies. As rhythm contributes strongly to CI users’ melody recognition, the rhythm cues were removed (i.e., all notes had the same duration), similar to previous studies (e.g., Kong et al., 2004; 2005). After completing baseline measures, MCI training was begun.
MCI training stimuli were similar to those used for baseline testing (i.e., 3-tone complexes), except that different root notes were used for training. For five of the six subjects, training was conducted on a home computer, using custom training software (see Fu et al., 2005); one subject was trained in the laboratory. Subjects listened to stimuli at a comfortably loud level via Cochlear’s TV/Hi-Fi cable connected to the headphone jack of the computer. In general, subjects trained for a half-hour per day, five days per week; the duration of training ranged from one week to nearly two months. During training, a melodic contour was presented and subjects clicked on the matching response. If the subject answered correctly, visual feedback was provided and a new contour was presented. If the subject answered incorrectly, audio and visual feedback were provided, allowing the subject to compare his/her incorrect response to the correct response. The number of response choices and intonation was adjusted according to subject performance across training exercises. At the end of the training, subjects returned to the lab for re-testing of the baseline measures (MCI and FMI). For additional details regarding the training procedures, please refer to Galvin et al. (2007).
After completing the training and testing with the 3-tone complexes, four of the six training subjects participated in an additional training experiment. After completing baseline MCI performance measures with different instruments (Galvin et al., 2008), subjects were trained at home using only piano stimuli. Similar to the previous training with the 3-tone complex, different root notes were used for training than used for testing. Subjects received audio and visual feedback, and the number of response choices and/or intonation was adjusted according to subject performance in the training exercises. Subjects trained for a half-hour per day, five days per week, for one month. After training was competed, subjects returned to the laboratory to re-test baseline MCI performance for all instruments.
6.2 Results and discussion
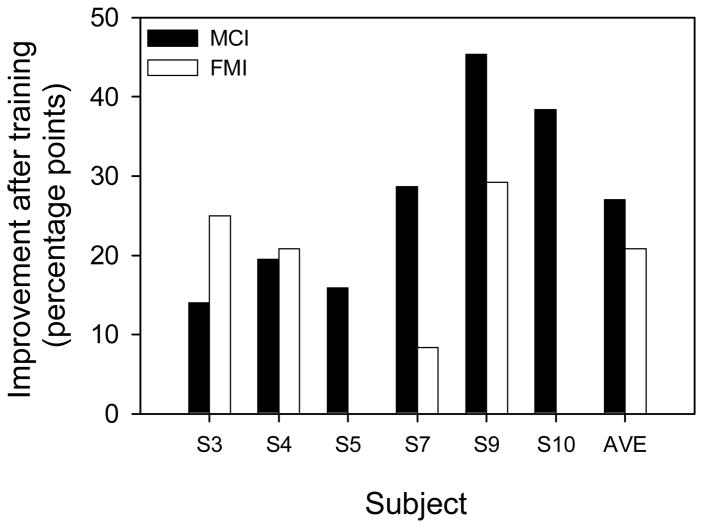
Figure 10 shows the improvement in MCI and FMI performance after MCI training with the 3-tone complex (i.e., simple stimuli). Across subjects, the mean improvement in MCI performance was 27.0 percentage points (range: 14.0 – 45.4 percentage points). The greatest improvements were observed for subjects whose baseline performance was relatively poor. Follow-up measures (one month or more after training was stopped) in three subjects showed that the improved MCI performance was largely retained; while performance declined slightly from immediate post-training levels, performance remained much higher than pre-training baseline levels. Across subjects, the mean improvement in FMI performance (without rhythm cues) was 20.8 percentage points (range: 8.3 – 29.2 percentage points); note that baseline and post-training performance was measured in only four of the six CI subjects. These results suggest that MCI training with novel frequency ranges generalized to improved MCI performance for the test frequency ranges, and to improved FMI performance (even though FMI was not explicitly trained). Anecdotal reports suggested that the MCI training also improved real-life music perception and appreciation; one subject commented that she was able to better hear the singer’s voice while listening to music in the car.
Figure 10.
Improvement in MCI (black bars) and FMI performance (white bars) after MCI training with the 3-tone complex and novel frequency ranges, for individual CI subjects.
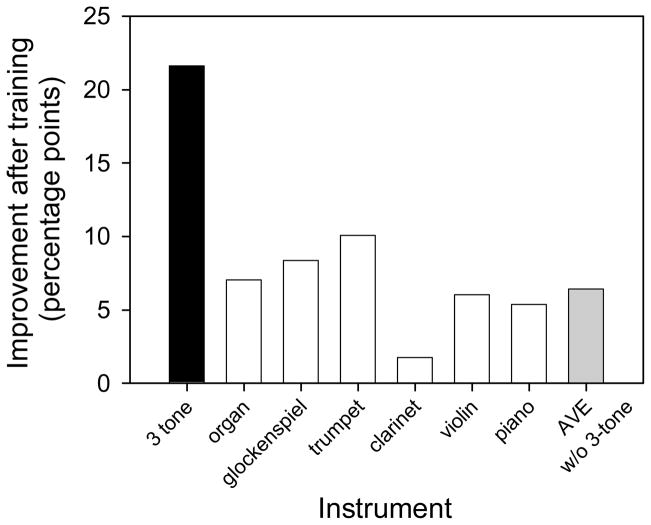
Figure 11 shows the mean improvement in MCI performance for different instruments after training with the piano stimuli and novel frequency ranges; for comparison purposes, the mean improvement in MCI performance with the 3-tone complex (A4 root note only) is shown at the left side of the figure. Across subjects and instruments (excluding the 3-tone complex), the mean improvement was 6.4 percentage points (range: 1.8 – 10.1 percentage points). Even though subjects trained only with the piano stimuli, the greatest improvement was not for the piano; on average, the post-training improvement for the organ, glockenspiel, trumpet and violin was greater than that for the piano. The improvement for the previous training with the 3-tone complex was much greater than that with the piano training. The subjects who received the piano training had previously trained with the 3-tone complex in Galvin et al. (2007). Mean baseline performance was 57.5% correct for the A4 root note; after training with the 3 tone complex, mean performance improved to 81.8% correct. These subjects subsequently participated in the MCI experiment with different instruments and the piano training. Mean baseline performance (across instruments) for these four subjects was 66.2% correct, nearly 10 points higher than baseline pre-training performance with the 3-tone complex. After training with the piano stimuli, mean performance (across instruments) improved to 71.2% correct, lower than post-training performance with the 3-tone complex. It is possible that these subjects experienced more learning with the original training with the 3-tone complex, and that the more difficult piano stimuli limited the amount of learning in the piano training. It is also possible that if listeners had originally trained with the piano stimuli rather than the 3-tone complex, a stronger training effect might have occurred. It is unclear whether training with relatively simple or complex stimuli may best benefit CI users’ melodic pitch perception.
Figure 11.
Improvement in MCI performance after MCI training with novel frequency ranges. The black bar shows the improvement after initial training with the 3-tone complex. The white bars show the improvement for different instruments after subsequent training with the piano. The gray bar shows the mean improvement (across instruments, excluding the 3-tone complex) after training with the piano.
7. GENERAL DISCUSSION
The experiments reported here represent initial investigations into melodic pitch recognition in CI listeners. Better understanding of the effects of CI processing on music perception is needed to improve the design of CI devices and signal processors and in turn, to improve CI users’ music perception and appreciation. Experiments with degraded spectral representations, such as those received by CI listeners, can inform basic understanding of necessary components for melodic pitch perception. It appears that contemporary CI processing and devices are poor at representing musical pitch, but that a relatively short period of training can improve melodic pitch perception. This suggests that some weak pitch cues may be available in CI signals, but that CI listeners must be trained to use them.
The previous MCI experiments were conducted with post-lingually deafened adult CI users. As such, most of these listeners had developed central patterns for speech and music during their previous experience with normal or impaired (aided) hearing. Many CI users are able to quickly adapt to electric hearing during the first six months of implant use (e.g., Spivak and Waltzman, 1990; Loeb and Kessler, 1995) due to the robustness of these central speech patterns. The coarse spectral and temporal resolution provided by CIs is adequate for speech perception under optimal listening conditions. Music requires spectro-temporal fine structure to support complex pitch perception, melody recognition and timbre perception. It is possible that the diminished quality of music perceived by post-lingually deafened CI users is related to central patterns developed when fine structure cues were available. Once these cues are no longer available (as in a CI), melodic pitch perception is greatly diminished.
Currently, profoundly deaf children are implanted as young as 18 months. As such, all central speech and music patterns are developed in the context of electric hearing. Previous studies have shown that early implantation (i.e., a shorter duration of deafness) allows children to develop near-normal speech perception, at least for quiet listening conditions (e.g., Nicholas and Geers, 2007; Eggermont and Ponton, 2003; Svirsky et al., 2000; Robbins et al., 2004; Manrique et al., 2004). Delayed implantation can result in long-standing or permanent developmental deficits. If early-implanted children are able to develop near-normal speech patterns, it is possible that music perception may also develop near normal. While the precise intervals between notes may differ between electric and acoustic hearing, relative intervals may be similar, or at least convey similar melodic information. As such, music perception and appreciation by early-implanted children may be better than that of post-lingually deafened adult CI users. Recent work by Mitani et al. (2007) showed that early-implanted children were able to identify ~34% correct of popular television theme songs when the original performance was presented. When instrumental versions were presented, child CI subjects could only identify 3% correct, suggesting that the central patterns developed during electric hearing were restricted to the auditory objects themselves, rather than structural components such as rhythm and pitch. Interestingly, these subjects gave favorable quality ratings to both the familiar (original) and instrumental versions, suggesting that even though they may not have received important musical cues, these child CI users enjoyed listening to the music itself. Thus, while early-implanted CI users “may not know what they’re missing,” they may appreciate and enjoy music more than later-implanted adults, for whom the CI version of music is a poor representation of their auditory memory of music.
While music experience and training may offset some of the difficulties for CI users’ music perception and appreciation, the challenge remains to provide more spectral channels and/or spectral fine-structure cues. Recent CI processing strategies such Advanced Bionics’ Fidelity 120 (e.g., Koch et al., 2007) employ current steering to transmit 120 “virtual channels” across 16 electrodes. While Fidelity 120 has not provided any consistent advantage over traditional CIS processing with 16 physical electrodes, some users report quality differences, with Fidelity 120 improving music quality. Most likely, the current spread associated with monopolar stimulation limits the channel selectivity for current steering strategies. Current-focusing via tri-polar stimulation may improve the channel selectivity, thereby making current steering more effective (e.g., Bierer, 2007; Litvak et al., 2007). Novel electrode designs such as the penetrating electrode array (Middlebrooks and Snyder, 2007) may reduce current levels and increase the number of channels. Hybrid acoustic and electric hearing via hearing aids (HAs) and CIs have been shown to provide a strong advantage for music perception and speech perception in noise (e.g., Kong et al., 2005), due to the improved transmission and reception of F0 cues via HAs. However it is accomplished, CIs must restore spectro-temporal fine structure cues if they are to provide excellent music perception. The MCI paradigm provides a good framework with which to test any gains in melodic pitch perception these new CI strategies and devices may provide.
Acknowledgments
The authors would like to thank all of the CI and NH subjects who participated in these experiments. This work was supported by NIH grant DC004993.
Contributor Information
John J. Galvin, III, Email: jgalvin@hei.org.
Qian-Jie Fu, Email: qfu@hei.org.
Robert V. Shannon, Email: bshannon@hei.org.
References
- ANSI 1960. American Standard Acoustical Terminology. American National Standards Institute; New York: [Google Scholar]
- Bierer JA. Threshold and channel interaction in cochlear implant users: evaluation of the tripolar electrode configuration. J Acoust Soc Am. 2007;121:1642–53. doi: 10.1121/1.2436712. [DOI] [PubMed] [Google Scholar]
- Burns EM, Viemeister NF. Nonspectral Pitch. J Acoust Soc Am. 1976;60:863–869. [Google Scholar]
- Burns EM, Viemeister NF. Played-again SAM: Further observations on the pitch of amplitude-modulated noise. J Acoust Soc Am. 1981;70:1655–1660. [Google Scholar]
- Eggermont JJ, Ponton CW. Auditory-evoked potential studies of cortical maturation in normal hearing and implanted children: correlations with changes in structure and speech perception. Acta Otolaryngol. 2003;123:249–252. doi: 10.1080/0036554021000028098. [DOI] [PubMed] [Google Scholar]
- Friesen LM, Shannon RV, Baskent D, et al. Speech recognition in noise as a function of the number of spectral channels: comparison of acoustic hearing and cochlear implants. J Acoust Soc Am. 2001;110:1150–1163. doi: 10.1121/1.1381538. [DOI] [PubMed] [Google Scholar]
- Fu QJ, Chinchilla S, Nogaki G, et al. Voice gender identification by cochlear implant users: The role of spectral and temporal resolution. J Acoust Soc Am. 2005;118:1711–1718. doi: 10.1121/1.1985024. [DOI] [PubMed] [Google Scholar]
- Fu Q-J, Galvin JJ, III, Wang X, et al. Moderate auditory training can improve speech performance of adult cochlear implant users. J Acoust Soc Am ARLO. 2005;6:106–111. [Google Scholar]
- Galvin JJ, Fu QJ, Nogaki G. Melodic contour identification by cochlear implant listeners. Ear Hear. 2007;28:302–319. doi: 10.1097/01.aud.0000261689.35445.20. [DOI] [PMC free article] [PubMed] [Google Scholar]
- Galvin JJ, Fu Q-J, Oba S. Effect of instrument timbre on melodic contour identification by cochlear implant users. J Acoust Soc Am. 2008;124:EL189–195. doi: 10.1121/1.2961171. [DOI] [PMC free article] [PubMed] [Google Scholar]
- Galvin JJ, Fu Q-J, Oba S. Effect of a competing instrument on melodic contour identification by cochlear implant users. J Acoust Soc Am. 2008 doi: 10.1121/1.3062148. Submitted 9, 9, 2008. [DOI] [PMC free article] [PubMed] [Google Scholar]
- Gfeller K, Christ A, Knutson JF, et al. Musical backgrounds, listening habits, and aesthetic enjoyment of adult cochlear implant recipients. J Am Acad Audiol. 2000;11:390–406. [PubMed] [Google Scholar]
- Gfeller K, Wiit S, Adamek M, et al. Effects of training on timbre recognition and appraisal by postlingually deafened cochlear implant recipients. J Am Acad Audiol. 2002;13:132–145. [PubMed] [Google Scholar]
- Henry BA, McKay CM, McDermott HJ, et al. The relationship between speech perception and electrode discrimination in cochlear implantees. J Acoust Soc Am. 2000;108:1269–1280. doi: 10.1121/1.1287711. [DOI] [PubMed] [Google Scholar]
- Koch DB, Downing M, Osberger MJ, et al. Using current steering to increase spectral resolution in CII and HiRes 90K users. Ear Hear. 2007;28(Suppl):S38–41. doi: 10.1097/AUD.0b013e31803150de. [DOI] [PubMed] [Google Scholar]
- Kong YY, Cruz R, Jones JA, et al. Music perception with temporal cues in acoustic and electric hearing. Ear Hear. 2004;25:173–185. doi: 10.1097/01.aud.0000120365.97792.2f. [DOI] [PubMed] [Google Scholar]
- Kong YY, Stickney GS, Zeng FG. Speech and melody recognition in binaurally combined acoustic and electric hearing. J Acoust Soc Am. 2005;117:1351–61. doi: 10.1121/1.1857526. [DOI] [PubMed] [Google Scholar]
- Litvak LM, Spahr AJ, Emadi G. Loudness growth observed under partially tripolar stimulation: model and data from cochlear implant listeners. J Acoust Soc Am. 2007;122:967–81. doi: 10.1121/1.2749414. [DOI] [PubMed] [Google Scholar]
- Loeb GE, Kessler DK. Speech recognition performance over time with the Clarion cochlear prosthesis. Ann Otol Rhinol Laryngol Suppl. 1995;166:290–292. [PubMed] [Google Scholar]
- Looi V, McDermott H, McKay C, et al. Music perception of cochlear implant users compared with that of hearing aid users. Ear Hear. 2008;29:421–434. doi: 10.1097/AUD.0b013e31816a0d0b. [DOI] [PubMed] [Google Scholar]
- Luo X, Fu QJ, Galvin JJ. Vocal emotion recognition by normal-hearing listeners and cochlear implant users. Trends Amplif. 2007;11:301–315. doi: 10.1177/1084713807305301. [DOI] [PMC free article] [PubMed] [Google Scholar]
- Lynch MP, Eilers RE, Oller KD, et al. Influences of acculturation and musical sophistication on perception of musical interval patterns. J Exp Psych Human Percept Performance. 1991;17:467–475. doi: 10.1037//0096-1523.17.4.967. [DOI] [PubMed] [Google Scholar]
- Manrique M, Cevera-Paz FJ, Huarte A, et al. Advantages of cochlear implantation in prelingual deaf children before 2 years of age when compared to later implantation. Laryngoscope. 2004;114:1462–1469. doi: 10.1097/00005537-200408000-00027. [DOI] [PubMed] [Google Scholar]
- Middlebrooks JC, Snyder RL. Auditory prosthesis with a penetrating nerve array. J Assoc Res Otolaryngol. 2007;8:258–79. doi: 10.1007/s10162-007-0070-2. [DOI] [PMC free article] [PubMed] [Google Scholar]
- Mitani C, Nakata T, Trehub SE, et al. Music recognition, music listening, and word recognition by deaf children with cochlear implants. Ear Hear. 2007;28(Suppl):S29–33. doi: 10.1097/AUD.0b013e318031547a. [DOI] [PubMed] [Google Scholar]
- Nelson DA, Van Tasell DJ, Schroder AC, et al. Electrode ranking of “place pitch” and speech recognition in electrical hearing. J Acoust Soc Am. 1995;98:1987–1999. doi: 10.1121/1.413317. [DOI] [PubMed] [Google Scholar]
- Nicholas JG, Geers AE. Will they catch up? The role of age at cochlear implantation in the spoken language development of children with severe to profound hearing loss. J Speech Lang Hear Res. 2007;50:1048–1062. doi: 10.1044/1092-4388(2007/073). [DOI] [PMC free article] [PubMed] [Google Scholar]
- Padilla M, Shannon RV. Could a lack of experience witha second language be modeled as a hearing loss? [abstract] J Acoust Soc Am. 2002;112:2385. [Google Scholar]
- Robbins KM, Koch DB, Osberger MJ, et al. The effect of age at cochlear implantation on auditory skill development in infants and toddlers. Arch Otolaryngol Head Neck Surg. 2004;130:570–574. doi: 10.1001/archotol.130.5.570. [DOI] [PubMed] [Google Scholar]
- Rosen S. Philos Trans Royal Soc London Ser B Biol Sci. 1992. Temporal information in speech and its relevance for cochlear implants; pp. 336–367. [DOI] [PubMed] [Google Scholar]
- Shannon RV, Zeng FG, Kamath V, et al. Speech recognition with primarily temporal cues. Science. 1995;270:303–304. doi: 10.1126/science.270.5234.303. [DOI] [PubMed] [Google Scholar]
- Shannon RV, Fu QJ, Galvin JJ. The number of spectral channels required for speech recognition depends on the difficulty of the listening situation. Acta Oto-Laryngologica, Suppl. 2004;552:50–54. doi: 10.1080/03655230410017562. [DOI] [PubMed] [Google Scholar]
- Smith ZM, Delgutte B, Oxenham AJ. Chimaeric sounds reveal dichotomies in auditory perception. Nature. 2002;416:87–90. doi: 10.1038/416087a. [DOI] [PMC free article] [PubMed] [Google Scholar]
- Spivak LG, Waltzman SB. Performance of cochlear implant patients as a function of time. J Speech Hear Res. 1990;33:511–519. doi: 10.1044/jshr.3303.511. [DOI] [PubMed] [Google Scholar]
- Stickney G, Assmann P, Chang J, et al. Effects of cochlear implant processing and fundamental frequency on the intelligibility of competing sentences. J Acoust Soc Am. 2007;122:1069–1078. doi: 10.1121/1.2750159. [DOI] [PubMed] [Google Scholar]
- Svirsky MA, Robbins AM, Kirk KI, et al. Language development in profoundly deaf children with cochlear implants. Psychological Science. 2000;11:153–158. doi: 10.1111/1467-9280.00231. [DOI] [PMC free article] [PubMed] [Google Scholar]
- Vongphoe M, Zeng FG. Speaker recognition with temporal cues in acoustic and electric hearing. J Acoust Soc Am. 2005;118:1055–1061. doi: 10.1121/1.1944507. [DOI] [PubMed] [Google Scholar]


