

Abstract
This pilot study investigates the value of baseline total lesion glycolysis (TLG) in 18F-FDG PET/CT scans for prediction of progression-free survival (PFS) in patients with Diffuse Large B-Cell Lymphoma (DLBCL). We also evaluate the role of other quantitative parameters measured at baseline and interim PET/CT for prediction of PFS. A retrospective review (2003-2010) of patients with DLBCL who underwent 18F-FDG PET/CT before, after cycle two, and after completion of R-CHOP treatment, identified 84 patients. Twenty patients fulfilled the inclusion criteria. Standardized uptake values (SUVmax and SUVmean), total metabolic tumor volume (TMTV), and TLG were measured in baseline and interim PET/CT. Relationship between quantitative parameters and PFS was statistically analyzed using Log-rank test and univariate Cox-regression analysis. Of 20 patients (F/M: 7/13, range: 20-73 years), six patients (30%) developed recurrence after chemotherapy (mean follow-up: 51.35±17.05 months, range: 12-81 months). Results of statistical analysis showed TLG as the only discriminator of recurrence at baseline (cut-point: 704.77 g, HR: 11.21, CI: 1.29-97, P=0.02). Among the interim PET/CT parameters, SUVmean (cut -point: 2.07, HR: 6.31, CI: 1.25-31.61), SUVmax (cut-point: 2.3, HR: 6.31, CI: 1.25-31.61), and TLG (cut-point: 96.5 g, HR: 6.38, CI: 1.29 - 31.61) could all help predict PFS (P<0.05). Although not routinely reported, high baseline TLG may be a useful index to identify patients with DLBCL who are at increased risk for relapse after conventional R-CHOP. If confirmed in larger prospective studies, this may allow the selection of alternate therapeutic choices at the onset of treatment.
Keywords: Diffuse large B-cell lymphoma, 18F-FDG PET/CT, progression-free survival, quantitative parameters
Introduction
Optimization of the management of patients with Diffuse Large B-cell Lymphoma (DLBCL) is of upmost importance since conventional chemotherapy has been shown to be effective only in 60% of patients [1,2]. Hence, an accurate predictive tool to identify patients more likely to relapse is needed to allow both for stratification of patients in clinical trials as well as for early implementation of more appropriate treatment strategies.
It has been demonstrated that 18F-FDG PET/CT is an accurate diagnostic tool in detection of neoplastic disease, staging, and early evaluation of tumor response to therapy [3,4]; the latter allows for early alteration of ineffective therapy regimens and selection of the patients who can benefit from second line therapies [5]. One such clinical scenario, in which interim monitoring of therapy response using 18F-FDG PET/CT has been shown useful is DLBCL. Considering the substantial recurrence rate of disease in a large group of these patients after standard chemotherapy regimens, it is crucial to identify those at high risk for disease recurrence [6]. Recent clinical trials have demonstrated that interim 18F-FDG PET/CT may be employed to monitor the response to chemotherapy and predict disease recurrence [7-9]. Nevertheless, the role of interim PET for prediction of clinical outcome in DLBCL is still controversial and remains to be fully elucidated [10,11]. Some groups have suggested that baseline 18F-FDG PET/CT scans might be as valuable as interim PET/CT scans in the prediction of progression-free survival (PFS) and disease recurrence in various types of neoplasms. Among all quantitative PET parameters, the total glycolytic burden of disease, also known as total lesion glycolysis (TLG), in the baseline 18F-FDG PET/CT scans has been shown to be an independent factor associated with PFS and recurrence in various types of cancer, including lymphoma and thoracic neoplasm [12-15].
The aim of the present study was to investigate the value of baseline TLG in the prediction of PFS in a homogeneous group of patients with DLBCL. The relationship between PFS and various quantitative PET parameters measured at baseline and interim 18F-FDG PET/CT scans was also evaluated.
Materials and methods
Subjects
Records of eighty-four patients with histologically proven DLBCL were retrospectively reviewed. The patients were referred to Massachusetts General Hospital between September 2003 and August 2010. They underwent 18F-FDG PET/CT at baseline, after 2 cycles of standard chemotherapy with cyclophosphamide, hydroxydaunorubicin, vincristine, prednisone, rituximab (R-CHOP), and after completion of chemotherapy. Patients who fulfilled the inclusion criteria and did not have any of the exclusion criteria were then enrolled in the study (Table 1). The study protocol was approved by Institutional Review Board (IRB) of the hospital.
Table 1.
Patients’ inclusion and exclusion criteria
| Inclusion criteria | Exclusion criteria |
|---|---|
| Negative 18F-FDG-PET scan after completion of chemotherapy | History of previous lymphoma or other malignancies |
| A record of normal blood glucose level immediately before 18F-FDG injection (<200 mg/dL) | Active infection or granulomatous disease before treatment |
| At least 12 month of follow-up after completion of chemotherapy | Pregnancy |
| No regimen other than standard R-CHOP | Age younger than 18 years |
Clinical data obtained from all patients included the information about sex, age of disease onset (by the date of diagnosis), presence of B symptoms, number of involved regions, clinical stage of disease according to Ann Arbor staging system, quantitative PET/CT parameters at the baseline and interim PET/CT, duration of treatment and duration of follow-up after completion of therapy, interim PET/CT results, PFS, and occurrence of relapse.
18F-FDG PET/CT acquisition
All scans were performed using a Siemens Biograph PET/CT scanner. Patients were instructed to fast for at least 6 hours and blood glucose level was measured to ensure that it was less than 200 mg/dL before radiotracer injection. Approximately, sixty minutes after intravenous injection of 18F-FDG per standard MGH protocol (555-925 MBq; BMI-based dose), a whole body emission PET scan was performed in 6-8 bed positions (3-5 min acquisition time per bed position based on BMI), covered from base of skull to upper thigh. Non-contrast-enhanced CT with 120-keV, 11-100-mAs (based on BMI), 5-mm collimation and pitch of 0.75 was performed for attenuation correction. The datasets were reconstructed using OSEM algorithm with 2 iterations (BMI < 31) or 3 iterations (BMI ≥ 31), 8 subsets, and 5 mm gaussian filter. The reconstructed images were reviewed in transverse, sagittal and coronal planes, using a dedicated PET/CT fusion workstation with built-in software (Syngo TrueD; Siemens Medical Solutions).
All patients received R_CHOP regimen for six to eight cycles. A baseline 18F-FDG PET/CT scan was acquired before starting R-CHOP treatment. Interim scan was performed within the last 0-3 days before administration of the third cycle of chemotherapy, and the last scan was done 3-6 weeks after completion of treatment. Response to therapy was evaluated one month after the completion of chemotherapy. Pretreatment staging and response evaluation after completion of R-CHOP therapy were based on clinical examination, CT scan, bone marrow biopsy, and 18F-FDG PET/CT.
PET quantitative parameters
The PET/CT datasets were reviewed by two radiologists, blinded from patient clinical information. Using the Siemens TrueD workstation, quantitative parameters were measured for each patient at both baseline and interim PET/CT scans.
Any focus of 18F-FDG uptake outside normal physiological whole organ uptake with SUVmax greater than 1.5 liver SUVmean plus 2.5 standard deviation of liver SUV was considered a measurable lesion [16]. When in doubt, the contrast enhanced CT of the patients at the same time point, which was acquired from every lymphoma patient undergoing 18F-FDG PET/CT, was reviewed to evaluate the suspicious focus. We used a relative threshold method for measuring quantitative PET parameters; we created a 3D contour around voxels that were equal to or greater than 50% of the maximum voxel value inside a spherical region. In cases where the relative threshold method resulted in overgrowing of the lesion to include the surrounding background tissue or other organs (based on CT images) an absolute threshold method was employed. In this method, we manually drew a 3D spherical contour within which the voxels equal or greater than absolute value of liver SUVmean plus 2.5 standard deviation of mean liver SUV were defined as tumor [17].
From each baseline and interim PET/CT image, SUVmax, SUVmean, and total metabolic tumor volume (TMTV) were extracted. Metabolic tumor burden (MTB) was measured as the product of SUVmean and MTV for the most 18F-FDG avid lesion. TLG was calculated as the sum of the product of SUVmean and MTV of all lesions (TLG = sum of [SUVmean × MTV]).
Progression-free survival (PFS) was measured as the interval between the initiation of treatment until either disease recurrence or last documented follow-up of the patient if he/she remains disease-free. Disease recurrence was defined as clinical evidence of recurrence or a positive follow-up 18F-FDG-PET study. Observations were censored on the date the patient was last known to be alive or the date of death.
Statistical analysis
Descriptive frequencies and relationships between quantitative PET/CT parameters and PFS were statistically analyzed to define demographic and prognostic characteristics of the patients.
The receiver-operating-characteristic (ROC) curve was plotted to estimate the most discriminating decision threshold (cut-off point) for each parameter to maximize the sensitivity and specificity in predicting the recurrence of disease. By dichotomizing the parameters based on their cut-point, a Kaplan-Meier survival curve was generated and Log-rank test was used to compare PFS between each of the two groups [18]. The estimated hazard ratio (HR) of each parameter at the definite threshold was assessed using univariate Cox proportional hazard analysis [19]. Log-rank test was also used to compare PFS between the negative and positive 18F-FDG uptake at the interim PET/CT using dichotomized visual assessment.
The data were statistically processed using SPSS version 20 for Macintosh (SPSS, Chicago, IL). All quantitative values are reported as mean ± standard deviation (SD) and the tests with a P-value <0.05 (two-sided) were considered as statistically significant.
Results
Patients
Twenty patients fulfilled the inclusion criteria including 13 women and 7 men (F/M ratio: 0.54 mean age of the onset 58.6 ± 16.02 years, range 20-73 years). Patients’ demographic and clinical characteristics and the qualitative PET/CT results are reported in Table 2. Two patients were Ann Arbor stage I (10%), six were stage II (30%), five patients were stage III (25%), and seven were stage IV (35%). After the second cycle of chemotherapy, six patients (30%) had 18F-FDG uptake in at least one site in the whole body PET/CT scan at interim PET/CT (Table 2).
Table 2.
Patients’ demographic and clinical characteristics and the qualitative PET/CT results
| No | Sex | Age (years) | B symptom | No of Regions | Ann Arbor Stage | Duration of follow-up (months) | PFS (months) | Interim result | Relapse |
|---|---|---|---|---|---|---|---|---|---|
| 1 | M | 60 | P | 4 | 3 | 54 | 54 | N | N |
| 2 | F | 71 | N | 3 | 4 | 56 | 56 | N | N |
| 3 | M | 81 | N | 1 | 2 | 49 | 49 | N | N |
| 4 | M | 62 | N | 4 | 3 | 63 | 63 | N | N |
| 5 | F | 70 | N | 3 | 4 | 63 | 63 | N | N |
| 6 | M | 64 | N | 1 | 2 | 62 | 62 | N | N |
| 7 | M | 55 | N | 1 | 1 | 52 | 52 | N | N |
| 8 | M | 59 | N | 4 | 2 | 56 | 56 | N | N |
| 9 | M | 59 | P | 2 | 4 | 59 | 59 | N | N |
| 10 | F | 60 | P | 2 | 3 | 50 | 50 | N | N |
| 11 | F | 31 | N | 1 | 1 | 74 | 74 | N | N |
| 12 | F | 63 | N | 2 | 2 | 32 | 14 | N | P |
| 13 | M | 53 | P | 2 | 2 | 29 | 19 | N | P |
| 14 | M | 20 | P | 2 | 3 | 49 | 32 | N | P |
| 15 | F | 81 | P | 2 | 4 | 48 | 48 | P | N |
| 16 | M | 76 | P | 4 | 4 | 57 | 57 | P | N |
| 17 | M | 38 | P | 1 | 2 | 62 | 62 | P | N |
| 18 | F | 54 | N | 3 | 4 | 81 | 32 | P | P |
| 19 | M | 42 | P | 2 | 3 | 19 | 6 | P | P |
| 20 | M | 73 | N | 4 | 4 | 12 | 4 | P | P |
N: negative result, P: positive result, PFS: progression-free survival.
Follow-up and progression-free survival
The mean follow-up duration was 51.35± 17.05 months (range: 12-81 months). No patient died as a result of related or unrelated disease by the last follow-up. During the follow-up (i.e. starting from the first cycle of chemotherapy), 14 patients (70%) were in remission with no evidence of disease, while six patients (30%) developed disease recurrence; three of these patients did not have any focus of abnormal 18F-FDG uptake at interim PET/CT images, while the other three had at least one 18F-FDG positive lesion. The mean PFS was 45.6 ± 20.5 months (range -74 months) (Table 2).
Results regarding the prognostic and predictive values of all considered parameters using Log-rank test, Kaplan-Meier survival curves, and univariate Cox-regression analysis are reported in Table 3.
Table 3.
Univariate analysis using Kaplan–Meier survival curves and Cox-regression analysis
| Parameters | ROC curve & Log-rank test | PFS | Univariate Cox-regression | |||||
|---|---|---|---|---|---|---|---|---|
|
| ||||||||
| AUC | Threshold | Sensitivity - Specificity (%) | P-valuea | Mean PFS (months) | HR | 95% CI | P-valueb | |
| Baseline SUVmax | 0.58 | 13.84 | 66 - 72 | 0.1 | 51.7 vs. 36.3 | 3.64 | 0.66 - 19.98 | 0.136 |
| Baseline SUVmean | 0.47 | 6.44 | 66 - 58 | 0.32 | 50.8 vs. 40.4 | 2.26 | 0.41 - 12.37 | 0.347 |
| Baseline TLG | 0.71 | 704.77 | 83 - 79 | 0.006 | 56.5 vs. 29.2 | 11.21 | 1.29 - 97 | 0.028 |
| Baseline TMTV | 0.66 | 379.16 | 66 - 72 | 0.09 | 53 vs. 34.5 | 3.79 | 0.69 - 20.78 | 0.124 |
| Interim SUVmax | 0.68 | 2.3 | 50 - 93 | 0.01 | 50.8 vs. 24.7 | 6.31 | 1.25 - 31.61 | 0.025 |
| Interim SUVmean | 0.68 | 2.07 | 50 - 93 | 0.01 | 50.8 vs. 24.7 | 6.31 | 1.25 - 31.61 | 0.025 |
| Interim TLG | 0.72 | 96.5 | 33 - 99 | 0.01 | 50.5 vs. 26 | 6.38 | 1.29 - 31.61 | 0.025 |
| Interim TMTV | 0.66 | 5.95 | 33- 93 | 0.16 | 50.2 vs. 34.8 | 2.95 | 0.59 - 14.7 | 0.185 |
PFS: progression-free survival, AUC: area under the curve, HR: hazard ratio, CI: confidence interval.
P-values showing the level of significance in Kaplan-Meier survival analysis.
P-values showing the level of significance in univariate Cox-regression analysis.
SUV: standardized uptake value, TLG: total lesion glycolysis, TMTV: total metabolic tumor volume.
There was no significant association of PFS with age, gender, or stage of disease. Log-rank test showed baseline TLG as the only predictor of PFS among the baseline PET/CT parameters. A threshold of greater or equal to 704.77 g was the cut-off point for discrimination of relapse (P = 0.006). (Figure 1) Figures 3, 4, 5 and 6 highlight this concept through examples, in which regardless of the interim PET/CT results, the patients with baseline TLG above the defined cut-point of 704.77g would be at higher risk for progression of the disease (Figures 2 and 3), whereas the ones with baseline TLG below this amount would be less likely to experience the relapse (Figures 4 and 5).
Figure 1.

Kaplan-Meier estimate of progression-free survival (PFS) according to the threshold of baseline parameters at their optimal cut point; A. SUVmax was not significantly associated with PFS (cut-point: 13.84, P = 0.1, Sensitivity: 66%, Specificity: 72%). B. TMTV was not significantly associated with PFS (cut-point: 379.16, P = 0.09, Sensitivity: 66%, Specificity: 72%). C. TLG was the only discriminator at baseline of recurrence identified, with the optimal cut-point of 704.77 (P = 0.006, Sensitivity: 83%, Specificity: 79%).
Figure 3.
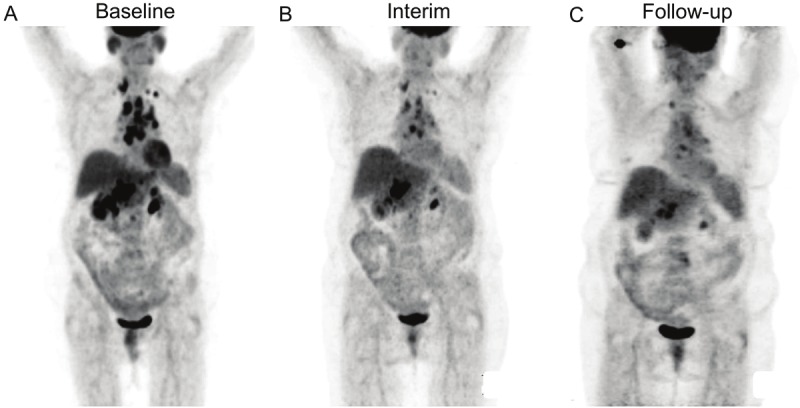
18F-FDG PET results from Patient No. 18. Pre-treatment PET image shows high metabolic burden of disease with TLG of 2759 g (A), Interim PET shows positive 18F-FDG uptake with TLG of 942 g (B), the patient experienced relapse 32 months after completion of chemotherapy (C).
Figure 4.
18F-FDG PET results from Patient No. 4. The pre-treatment PET image shows low metabolic burden of disease with total TLG of 340 g (A). Interim PET shows negative 18F-FDG uptake (B), there was no evidence of relapse during the follow-up period of 74 months after completion of chemotherapy (C).
Figure 5.
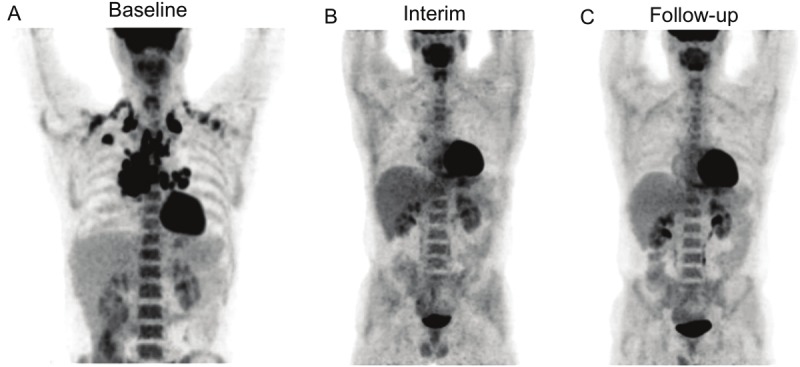
18F-FDG PET results from Patient No. 17. Pre-treatment PET image shows low metabolic burden of disease with TLG of 686 g (A), Despite showing positive 18F-FDG uptake in mediastinum at interim PET (TLG: 14 g) (B), the patient did not experience relapse during the follow-up period of 62 months after completion of chemotherapy (C).
Figure 6.
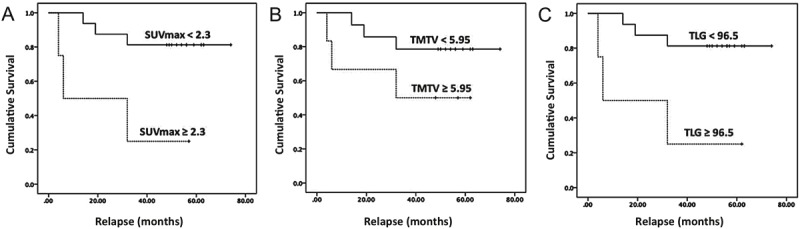
Kaplan-Meier estimate of progression-free survival (PFS) according to the threshold of interim parameters at their optimal cut point; A. SUVmax was significantly associated with PFS (cut-point: 2.3, P = 0.01, Sensitivity: 50%, Specificity: 93%). B. TMTV was not significantly associated with PFS (cut-point: 5.95, P = 0.16, Sensitivity: 33%, Specificity: 93%). C. TLG was a discriminator of recurrence with the optimal cut-point of 96.5 g (P = 0.01, Sensitivity: 33%, Specificity: 93%).
Figure 2.

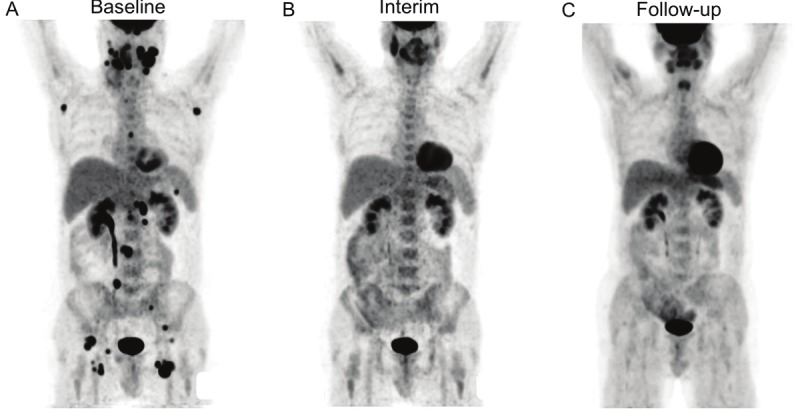
18F-FDG PET results from Patient No. 13; The pre-treatment PET image shows high metabolic burden of disease with total TLG of 9028 g (A). Despite showing no 18F-FDG uptake at interim PET (B), the patient experienced relapse 19 months after completion of chemotherapy (C).
At interim PET/CT, SUVmax (cut-point: 2.3), SUVmean (cut-point: 2.07), and TLG (cut-point: 96.5 g) were significant predictors of progression of disease (P < 0.05). (Figure 6) TMTV could not significantly predict the relapse either in baseline or in interim PET/CT images (Table 3).
Through the univariate Cox-regression analysis there was a statistically significant association of longer PFS with lower levels of SUVmean (HR: 6.31, CI: 1.25 – 31.61, P = 0.025), SUVmax (HR: 6.31, CI: 1.25 – 31.61, P = 0.025), and TLG at interim PET/CT (HR: 6.38, CI: 1.29 - 31.61, P = 0.025). Similar results were found in the association of PFS with TLG in the pre-treatment phase (HR: 11.21, CI: 1.29 – 97, P = 0.028) (Table 3).
Log-rank test did not show a significant difference in PFS of the patients based on the visual assessment of 18F-FDG uptake at interim PET/CT (interim PET-negative vs. interim PET-positive groups: 50.2 vs. 34.8 months, Chi square: 1.97, df: 1, P = 0.16).
Discussion
Our results show a strong predictive value of baseline TLG on the occurrence of relapse in a homogenous series of patients with DLBCL treated with R-CHOP. TLG represents the metabolic burden of disease that depends on both tumor volume and glucose utilization rate. This index has been considered as a potentially reliable parameter in providing more details about the status of disease in various types of cancers, especially in lung tumors, oro/nasopharyngeal, and rectal cancers [20-24]. The role of baseline TLG in prediction of PFS in lymphoma has not been routinely reported in the literature. Manohar, et. al. showed a weak but statistically significant association of PFS with baseline TLG and functional tumor volume in a group of patients with high-grade non-Hodgkin’s lymphoma, while the SUVmean and SUVmax failed to show any significant correlation with PFS [25]. Another study conducted by Cazaentre, et. al. demonstrated that pre-treatment TLG could be a useful index in predicting response to radioimmunotherapy in patients with non-Hodgkin’s lymphoma, whereas the conventional prognostic indices could not predict the response [26]. To the best of our knowledge, this is the first study in which the value of pretreatment TLG is evaluated in a highly selected group of patients with DLBCL. Our results suggest that the baseline TLG could help identify the patients at the onset of treatment who are at increased risk for relapse.
Previous studies suggested that the visual dichotomized assessment of interim PET results would help in predicting relapse. The patients in whom a positive 18F-FDG uptake was visually detected would be more likely to have relapse after treatment [27]. However, a more recent study published by Prengo, et. al., showed that regardless of the different time point that the interim PET/CT was obtained (after second to fourth cycle), the negative interim PET uptake was associated with favorable clinical outcome, but the positive interim PET uptake was not necessarily associated with a higher risk of relapse [28]. As represented in Table 2, our results are in concordance, showing that from the six patients with positive 18F-FDG uptake at interim PET, three of them experienced relapse, while the other three did not. Our Log-rank test result failed to show any significant difference in PSF of patients based on the visual assessment of interim 18F-FDG uptake (50.2 months in positive uptake vs. 34.8 months in negative uptake, Chi square: 1.97, df: 1, P = 0.16). It appears that visual interpretation of interim PET/CT may not be useful in the prediction of clinical outcome.
SUV is the most commonly used quantitative index, having shown its superior role in interpretation of interim images in comparison to visual assessment of 18F-FDG uptake [27,29,30]. Since this parameter is commonly affected by various technical and patient-dependent factors, the role of this index is still unconfirmed [31-33]. Results of univariate Cox-regression analysis in our study revealed that the interim SUV measurements have significant prognostic values. However, multivariate Cox-regression analysis could not be done to identify the independent prognostic factor among the parameters that were significant in univariate analysis.
Some recent studies have reported the baseline TMTV as a strong predictor of PFS in patients with lymphoma [34,35]. Sharma, et. al. found the TMTV as an independent prognostic factor in pediatric patients with lymphoma [36] and Song, et. al. showed similar results in DLBCL patients with gastrointestinal involvement treated with R-CHOP [37]. Another study conducted by the same group on DLBCL patients with no extranodal involvement showed that higher TMTV values are associated with lower PFS regardless of the stage of disease [38]. Despite the potential value of functional tumor volume reported in recent studies, we did not find any significant association of TMTV with PFS.
Univariate analysis revealed the significant association of TLG with PFS at both baseline and interim PET/CT images; the interim SUV measurements showed significant results as well. However, due to a small sample size and having only six out of twenty patients with relapse, multivariate Cox-regression analysis was not performed, and we could not define the independent prognostic factors among these indices. However, the baseline TLG showed a relatively higher AUC, with higher sensitivity and specificity and higher significance level in the Log-rank test in comparison to the other parameters.
Conclusion
This study showed that the baseline TLG may be used as a predictor of relapse in patients with DLBCL. Baseline predictors such as TLG could be especially of value, since interim 18F-FDG-PET scans for DLBCL patients are still limited, due in part to cost and availability of PET scans. However, the retrospective review of small patient population is a limitation of our study. The role of baseline TLG in prediction of relapse and its association with response to treatment needs to be confirmed in further prospective investigations with larger sample sizes and longer follow-up period.
Conflict of interest statement
None declared.
References
- 1.Gisselbrecht C, Glass B, Mounier N, Singh GD, Linch DC, Trneny M, Bosly A, Ketterer N, Shpilberg O, Hagberg H, Ma D, Briere J, Moskowitz CH, Schmitz N. Salvage regimens with autologous transplantation for relapsed large B-cell lymphoma in the rituximab era. J. Clin. Oncol. 2010;28:4184–4190. doi: 10.1200/JCO.2010.28.1618. [DOI] [PMC free article] [PubMed] [Google Scholar]
- 2.Juweid ME, Stroobants S, Hoekstra OS, Mottaghy FM, Dietlein M, Guermazi A, Wiseman GA, Kostakoglu L, Scheidhauer K, Buck A, Naumann R, Spaepen K, Hicks RJ, Weber WA, Reske SN, Schwaiger M, Schwartz LH, Zijlstra JM, Siegel BA, Cheson BD. Use of positron emission tomography for response assessment of lymphoma: consensus of the Imaging Subcommittee of International Harmonization Project in Lymphoma. J. Clin. Oncol. 2007;25:571–578. doi: 10.1200/JCO.2006.08.2305. [DOI] [PubMed] [Google Scholar]
- 3.Baba S, Abe K, Isoda T, Maruoka Y, Sasaki M, Honda H. Impact of FDG-PET/CT in the management of lymphoma. Ann Nucl Med. 2011;25:701–716. doi: 10.1007/s12149-011-0549-0. [DOI] [PubMed] [Google Scholar]
- 4.Juweid ME. FDG-PET/CT in lymphoma. Methods Mol Biol. 2011;727:1–19. doi: 10.1007/978-1-61779-062-1_1. [DOI] [PubMed] [Google Scholar]
- 5.MacManus MP, Seymour JF, Hicks RJ. Overview of early response assessment in lymphoma with FDG-PET. Cancer Imaging. 2007;7:10–18. doi: 10.1102/1470-7330.2007.0004. [DOI] [PMC free article] [PubMed] [Google Scholar]
- 6.Coiffier B, Thieblemont C, Van Den Neste E, Lepeu G, Plantier I, Castaigne S, Lefort S, Marit G, Macro M, Sebban C, Belhadj K, Bordessoule D, Ferme C, Tilly H. Long-term outcome of patients in the LNH-98.5 trial, the first randomized study comparing rituximab-CHOP to standard CHOP chemotherapy in DLBCL patients: a study by the Groupe d’Etudes des Lymphomes de l’Adulte. Blood. 2010;116:2040–2045. doi: 10.1182/blood-2010-03-276246. [DOI] [PMC free article] [PubMed] [Google Scholar]
- 7.Jerusalem G, Beguin Y, Fassotte MF, Najjar F, Paulus P, Rigo P, Fillet G. Persistent tumor 18F-FDG uptake after a few cycles of polychemotherapy is predictive of treatment failure in non-Hodgkin‘s lymphoma. Haematologica. 2000;85:613–618. [PubMed] [Google Scholar]
- 8.Mikhaeel NG, Hutchings M, Fields PA, O‘Doherty MJ, Timothy AR. FDG-PET after two to three cycles of chemotherapy predicts progression-free and overall survival in high-grade non-Hodgkin lymphoma. Ann Oncol. 2005;16:1514–1523. doi: 10.1093/annonc/mdi272. [DOI] [PubMed] [Google Scholar]
- 9.Kostakoglu L, Coleman M, Leonard JP, Kuji I, Zoe H, Goldsmith SJ. PET predicts prognosis after 1 cycle of chemotherapy in aggressive lymphoma and Hodgkin‘s disease. J Nucl Med. 2002;43:1018–1027. [PubMed] [Google Scholar]
- 10.Itti E, Juweid ME, Haioun C, Yeddes I, Hamza-Maaloul F, El Bez I, Evangelista E, Lin C, Dupuis J, Meignan M. Improvement of early 18F-FDG PET interpretation in diffuse large B-cell lymphoma: importance of the reference background. J Nucl Med. 2010;51:1857–1862. doi: 10.2967/jnumed.110.080556. [DOI] [PubMed] [Google Scholar]
- 11.Yang DH, Min JJ, Song HC, Jeong YY, Chung WK, Bae SY, Ahn JS, Kim YK, Bom HS, Chung IJ, Kim HJ, Lee JJ. Prognostic significance of interim 18F-FDG PET/CT after three or four cycles of R-CHOP chemotherapy in the treatment of diffuse large B-cell lymphoma. Eur J Cancer. 2011;47:1312–1318. doi: 10.1016/j.ejca.2010.12.027. [DOI] [PubMed] [Google Scholar]
- 12.Lee P, Weerasuriya DK, Lavori PW, Quon A, Hara W, Maxim PG, Le QT, Wakelee HA, Donington JS, Graves EE, Loo BW Jr. Metabolic tumor burden predicts for disease progression and death in lung cancer. Int J Radiat Oncol Biol Phys. 2007;69:328–333. doi: 10.1016/j.ijrobp.2007.04.036. [DOI] [PubMed] [Google Scholar]
- 13.Lee HY, Hyun SH, Lee KS, Kim BT, Kim J, Shim YM, Ahn MJ, Kim TS, Yi CA, Chung MJ. Volume-based parameter of 18F-FDG PET/CT in malignant pleural mesothelioma: prediction of therapeutic response and prognostic implications. Ann Surg Oncol. 2010;17:2787–2794. doi: 10.1245/s10434-010-1107-z. [DOI] [PubMed] [Google Scholar]
- 14.Arslan N, Tuncel M, Kuzhan O, Alagoz E, Budakoglu B, Ozet A, Ozguven MA. Evaluation of outcome prediction and disease extension by quantitative 2-deoxy-2-[18F] fluoro-D-glucose with positron emission tomography in patients with small cell lung cancer. Ann Nucl Med. 2011;25:406–413. doi: 10.1007/s12149-011-0478-y. [DOI] [PubMed] [Google Scholar]
- 15.Kim TM, Paeng JC, Chun IK, Keam B, Jeon YK, Lee SH, Kim DW, Lee DS, Kim CW, Chung JK, Kim IH, Heo DS. Total lesion glycolysis in positron emission tomography is a better predictor of outcome than the International Prognostic Index for patients with diffuse large B cell lymphoma. Cancer. 2012;119:1195–202. doi: 10.1002/cncr.27855. [DOI] [PubMed] [Google Scholar]
- 16.Wahl RL, Jacene H, Kasamon Y, Lodge MA. From RECIST to PERCIST: Evolving Considerations for PET response criteria in solid tumors. J Nucl Med. 2009;50(Suppl 1):122S–150S. doi: 10.2967/jnumed.108.057307. [DOI] [PMC free article] [PubMed] [Google Scholar]
- 17.Erlich F, Camisao C, Nogueira-Rodrigues A, Altino S, Ferreira CG, Mamede M. 18F-FDG-PET-based tumor delineation in cervical cancer: Threshold contouring and lesion volumes. Rev Esp Med Nucl Imagen Mol. 2012 doi: 10.1016/j.remn.2012.06.003. Epub ahead of print. [DOI] [PubMed] [Google Scholar]
- 18.Kaplan EL, Meier P. Non parametric estimation from incomplete observation. J Am Stat Assoc. 1958;53:457–481. [Google Scholar]
- 19.Cox DR. Regression models and life-tables (with discussion) J R Stat Soc Series B (Methodol) 1972;34:187–220. [Google Scholar]
- 20.Hatt M, van Stiphout R, le Pogam A, Lammering G, Visvikis D, Lambin P. Early prediction of pathological response in locally advanced rectal cancer based on sequential 18F-FDG PET. Acta Oncol. 2012;52:619–26. doi: 10.3109/0284186X.2012.702923. [DOI] [PMC free article] [PubMed] [Google Scholar]
- 21.Kim K, Kim SJ, Kim IJ, Kim YS, Pak K, Kim H. Prognostic value of volumetric parameters measured by 18F-FDG PET/CT in surgically resected non-small-cell lung cancer. Nucl Med Commun. 2012;33:613–620. doi: 10.1097/MNM.0b013e328351d4f5. [DOI] [PubMed] [Google Scholar]
- 22.Chen HH, Chiu NT, Su WC, Guo HR, Lee BF. Prognostic Value of Whole-Body Total Lesion Glycolysis at Pretreatment FDG PET/CT in Non-Small Cell Lung Cancer. Radiology. 2012;264:559–566. doi: 10.1148/radiol.12111148. [DOI] [PubMed] [Google Scholar]
- 23.Lim R, Eaton A, Lee NY, Setton J, Ohri N, Rao S, Wong R, Fury M, Schoder H. 18F-FDG PET/CT Metabolic Tumor Volume and Total Lesion Glycolysis Predict Outcome in Oropharyngeal Squamous Cell Carcinoma. J Nucl Med. 2012;53:1506–1513. doi: 10.2967/jnumed.111.101402. [DOI] [PubMed] [Google Scholar]
- 24.Moon SH, Choi JY, Lee HJ, Son YI, Baek CH, Ahn YC, Park K, Lee KH, Kim BT. Prognostic value of 18F-FDG PET/CT in patients with squamous cell carcinoma of the tonsil: Comparisons of volume-based metabolic parameters. Head Neck. 2013;35:15–22. doi: 10.1002/hed.22904. [DOI] [PubMed] [Google Scholar]
- 25.Manohar K, Mittal BR, Bhattacharya A, Malhotra P, Varma S. Prognostic value of quantitative parameters derived on initial staging 18F-fluorodeoxyglucose positron emission tomography/computed tomography in patients with high-grade non-Hodgkin‘s lymphoma. Nucl Med Commun. 2012;33:974–981. doi: 10.1097/MNM.0b013e32835673ec. [DOI] [PubMed] [Google Scholar]
- 26.Cazaentre T, Morschhauser F, Vermandel M, Betrouni N, Prangere T, Steinling M, Huglo D. Pre-therapy 18F-FDG PET quantitative parameters help in predicting the response to radioimmunotherapy in non-Hodgkin lymphoma. Eur J Nucl Med Mol Imaging. 2010;37:494–504. doi: 10.1007/s00259-009-1275-x. [DOI] [PubMed] [Google Scholar]
- 27.Lin C, Itti E, Haioun C, Petegnief Y, Luciani A, Dupuis J, Paone G, Talbot JN, Rahmouni A, Meignan M. Early 18F-FDG PET for prediction of prognosis in patients with diffuse large B-cell lymphoma: SUV-based assessment versus visual analysis. J Nucl Med. 2007;48:1626–1632. doi: 10.2967/jnumed.107.042093. [DOI] [PubMed] [Google Scholar]
- 28.Pregno P, Chiappella A, Bello M, Botto B, Ferrero S, Franceschetti S, Giunta F, Ladetto M, Limerutti G, Menga M, Nicolosi M, Priolo G, Puccini B, Rigacci L, Salvi F, Vaggelli L, Passera R, Bisi G, Vitolo U. Interim 18F-FDG-PET/CT failed to predict the outcome in diffuse large B-cell lymphoma patients treated at the diagnosis with rituximab-CHOP. Blood. 2012;119:2066–2073. doi: 10.1182/blood-2011-06-359943. [DOI] [PubMed] [Google Scholar]
- 29.Casasnovas RO, Meignan M, Berriolo-Riedinger A, Bardet S, Julian A, Thieblemont C, Vera P, Bologna S, Briere J, Jais JP, Haioun C, Coiffier B, Morschhauser F. SUVmax reduction improves early prognosis value of interim positron emission tomography scans in diffuse large B-cell lymphoma. Blood. 2011;118:37–43. doi: 10.1182/blood-2010-12-327767. [DOI] [PubMed] [Google Scholar]
- 30.Meignan M, Itti E, Gallamini A, Haioun C. Interim 18F -fluorodeoxyglucose positron emission tomography in diffuse large B-cell lymphoma: qualitative or quantitative interpretation--where do we stand? Leuk Lymphoma. 2009;50:1753–1756. doi: 10.3109/10428190903308056. [DOI] [PubMed] [Google Scholar]
- 31.Sugawara Y, Zasadny KR, Neuhoff AW, Wahl RL. Reevaluation of the standardized uptake value for FDG: variations with body weight and methods for correction. Radiology. 1999;213:521–525. doi: 10.1148/radiology.213.2.r99nv37521. [DOI] [PubMed] [Google Scholar]
- 32.Hamberg LM, Hunter GJ, Alpert NM, Choi NC, Babich JW, Fischman AJ. The dose uptake ratio as an index of glucose metabolism: useful parameter or oversimplification? J Nucl Med. 1994;35:1308–1312. [PubMed] [Google Scholar]
- 33.Zhang H, Wroblewski K, Appelbaum D, Pu Y. Independent prognostic value of whole-body metabolic tumor burden from FDG-PET in non-small cell lung cancer. Int J Comput Assist Radiol Surg. 2012;8:181–91. doi: 10.1007/s11548-012-0749-7. [DOI] [PubMed] [Google Scholar]
- 34.Rossi M, Korkola P, Pertovaara H, Jarvenpaa R, Dastidar P, Wu X, Soimakallio S, Eskola H, Kellokumpu-Lehtinen PL. PET imaging in a longitudinal non-Hodgkin‘s lymphoma study: association with tumor volume. Acta Radiol. 2011;52:995–1002. doi: 10.1258/ar.2011.110099. [DOI] [PubMed] [Google Scholar]
- 35.Berkowitz A, Basu S, Srinivas S, Sankaran S, Schuster S, Alavi A. Determination of whole-body metabolic burden as a quantitative measure of disease activity in lymphoma: a novel approach with fluorodeoxyglucose-PET. Nucl Med Commun. 2008;29:521–526. doi: 10.1097/MNM.0b013e3282f813a4. [DOI] [PubMed] [Google Scholar]
- 36.Sharma P, Gupta A, Patel C, Bakhshi S, Malhotra A, Kumar R. Pediatric lymphoma: metabolic tumor burden as a quantitative index for treatment response evaluation. Ann Nucl Med. 2012;26:58–66. doi: 10.1007/s12149-011-0539-2. [DOI] [PubMed] [Google Scholar]
- 37.Song MK, Chung JS, Shin HJ, Moon JH, Lee JO, Lee HS, Lee SM, Lee GW, Lee SE, Kim SJ. Prognostic value of metabolic tumor volume on PET/CT in primary gastrointestinal diffuse large B cell lymphoma. Cancer Sci. 2012;103:477–482. doi: 10.1111/j.1349-7006.2011.02164.x. [DOI] [PMC free article] [PubMed] [Google Scholar]
- 38.Song MK, Chung JS, Shin HJ, Lee SM, Lee SE, Lee HS, Lee GW, Kim SJ, Chung DS. Clinical significance of metabolic tumor volume by PET/CT in stages II and III of diffuse large B cell lymphoma without extranodal site involvement. Ann Hematol. 2012;91:697–703. doi: 10.1007/s00277-011-1357-2. [DOI] [PMC free article] [PubMed] [Google Scholar]